
I’ve seen many people using the terms process, thread and program interchangeably. However, under legitimate glossary, processes, threads and programs represent different definitions. Here is my take on it
Program : A set of instructions written to perform a specific function(s), which holds memory on the disk.
Process : When we run the written program (i.e. the executable, obtained after compiling and linking), it creates its own memory space in the RAM. This running instance is a process. I like to call it a program in action.
Thread: Thread is like a building block of a process. A process can have one or more threads running, where all the threads in a process share the same virtual address space and system resources.
Processes in Memory
Well, we know that a running process occupies memory in RAM. But then what next? how is this memory allocated, and how does it work?

In this article, I am aiming to get good hold of memory layout of linux processes, which might involve some linux-OS specific concepts and a bit of understanding of memory management. However, I have tried to focus more on fun and experiential learnings.
While a process is running, it is performing a certain task, and, it may have to use the system resources. A very basic example to illustrate a system resource is a file on the disk. In order to read a file from the file system, it has be accessed. Now, what if another process has to access the same file on the disk? Who will decide whether it should be allowed to be accessed or not? Moreover for all the allowed accesses, it is the operating system, i.e. the linux in our case, which has to manage all the accesses to the file.
How Linux manages its resources is, it does not allow any user running process to directly access any of the system resource. It offers system calls, which are called from the user space to use the system resources. Only when a process enters the kernel space it can access the file, and the kernel keeps track of the opened files in the form of kernel file tables.
For reference, system memory in Linux can be divided into two distinct regions: kernel space and user space. Kernel space is where the kernel (i.e., the core of the operating system) executes(i.e., runs) and provides its services.[Reference: here]
In memory, every running process is given 4GB of virtual address space considering a 32-bit architecture. The lower 3GB virtual addresses is accessible to the user space portion of the process and the upper 1GB is accessible to the kernel space portion. Following is a diagram illustrating the 4GB process virtual address space.
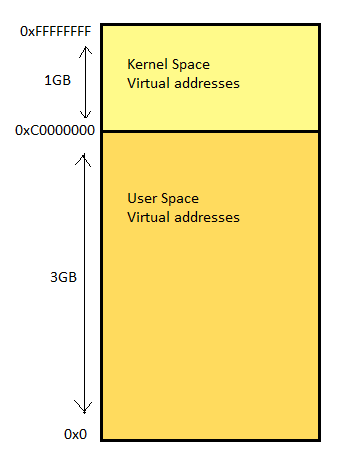
The above process memory split of 1GB to kernel space and 3GB to user space is changeable though, as per the need. However, in most of the cases, 1GB/3GB split suits the best.
Zooming into the user space address memory layout, there are various segments in a process. Following is a diagram to illustrate a picture:
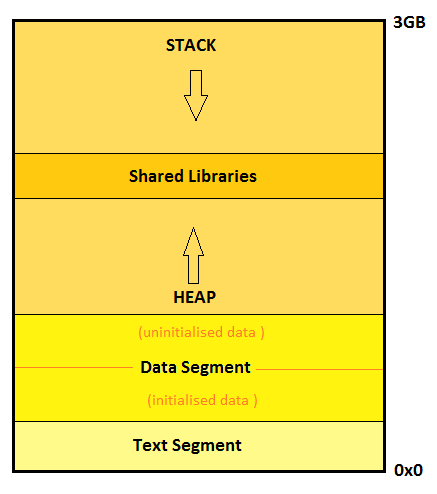
The above diagram is an abstract snapshot of a generic process image in memory. We see the memory has been categorized into various segments in accordance with the ELF format. ELF (Executable and Linking format) is a common standard file format for executables and libraries on unix-like systems. Let us walk through these segments and see what is in store there.
Text Segment
The executable binary is mapped onto this text segment and therefore is a read only segment for the process. Basically, this segment contains the instructions to be followed by the processor in a language that the processor understands (machine language :D). Hence this is also called the code segment. In certain scenarios, where multiple processes are created out of the same program, Linux allows sharing of the text segment to avoid reloading the same instructions.
Data Segment
This segment cannot be shared among processes. The data segment is internally parted into two areas.
One part of the segment memory holds all the initialized data variables i.e. initialized global variables or static variables.
The second part, also called the BSS segment of the process image has the uninitialized data of the program, which includes the global variables which have not been initialized. However, upon the onset of the process, all the data of the BSS segment is zero-initialized.
Heap
Whenever the programmer needs to allocate memory during runtime, heap is the segment from which the memory is provided.
Stack
The stack contains all the local variables used in the program considering their respective local scopes. Whenever a local variable is defined, it is pushed into the stack and whenever the scope for that local variable ends, it is popped out.
The stack might be decreasing or increasing in linear addresses depending upon the underlying architecture.
Shared Libraries
This is no segment as such. In case we have dynamically linked our program to shared objects, shared objects are loaded at the runtime. This part of memory help the process in mapping and accessing the exposed functions which from the shared libraries.
The process stats
Now, we are ready ready to see the real memory address numbers in the memory. However, getting down into the memory, it is very helpful if one knows and understands the intricacies of concepts like paging, physical address mappings, etc which is out of scope of this article.
Nevertheless, I am trying to keep it as simple and broad as possible.
To begin with, we need to write a code. I just randomly chose a mathematical program which gives us the sum of squares of numbers in a list.
const size_t SIZE = 6;
int main()
{
std::vector<int32_t> list;
int64_t sqSum = 0;
int32_t initialVal = 1;
// Populate the list some random way
for (uint32_t i = 0; i < SIZE; i++)
{
list.push_back(initialVal * i);
}
sleep(100);
//Compute square sum
for (uint32_t i = 0; i < SIZE; i++)
{
sqSum += (list.at(i)*list.at(i));
}
std::cout << “Squared Sum is : “ <<sqSum<<std::endl;
return 0;
}
Well, we have the ‘sleep()’ call in there because, we want the process to be valid for sometime. While the process is sleeping, we want to explore the memory layout of the process before it ends.
We compile the program and run it in the background.
$g++ -g -Wall -std=c++11 squareSum.cpp -o squareSum
$./squareSum &bg
To get any information regarding a process, PID is the prime key. Hence, we need to retrieve the assigned PID of our process.
$ ps
PID TTY TIME CMD
18009 pts/19 00:00:00 bash
19014 pts/19 00:00:00 squareSum
19095 pts/19 00:00:00 ps
In order to get the complete status of our newly created process including the status, size of memory segments, etc, we do
$ cat /proc/19014/status
Well, this is a command to retrieve data using /proc file system which is a special linux file system providing information about system and processes. We will see, procfs is really helpful in getting more and more about the current processes.
The output I see on my system is
Name: squareSum
State: S (sleeping)
Tgid: 19014
Ngid: 0
Pid: 19014
PPid: 18009
TracerPid: 0
Uid: 1000 1000 1000 1000
Gid: 1000 1000 1000 1000
FDSize: 256
Groups: 4 24 27 30 46 113 128 1000
NStgid: 19014
NSpid: 19014
NSpgid: 19014
NSsid: 18009
VmPeak: 13276 kB
VmSize: 13276 kB
VmLck: 0 kB
VmPin: 0 kB
VmHWM: 1552 kB
VmRSS: 1552 kB
VmData: 280 kB
VmStk: 136 kB
VmExe: 12 kB
VmLib: 4564 kB
VmPTE: 48 kB
VmPMD: 12 kB
VmSwap: 0 kB
HugetlbPages: 0 kB
Threads: 1
SigQ: 0/3797
SigPnd: 0000000000000000
ShdPnd: 0000000000000000
SigBlk: 0000000000000000
SigIgn: 0000000000000000
SigCgt: 0000000000000000
CapInh: 0000000000000000
CapPrm: 0000000000000000
CapEff: 0000000000000000
CapBnd: 0000003fffffffff
CapAmb: 0000000000000000
Seccomp: 0
Cpus_allowed: ffffffff
Cpus_allowed_list: 0–31
Mems_allowed: 00000000,00000001
Mems_allowed_list: 0
voluntary_ctxt_switches: 1
nonvoluntary_ctxt_switches: 0
The output gives us a beautiful picture of our process.
It is fine, if one is not able to understand what each and every value in the output means. The more one plays around and experiment, the more concepts gets absorbed in our minds.
Although, at the moment it is significant to know the following :
State: S (sleeping)
Since, the process is currently having a valid PID, only because of the sleep() call, hence we know the process is sleeping.
Tgid: 19014
The thread group ID(Tgid) here is same as the PID of the process
Pid: 19014
Nothing new here, we already are familiar with this number.
PPid: 18009
The parent ID. In our case, the bash shell is the parent process as we executed the binary from the shell. To confirm, just note the PID of ‘bash’ from the ‘ps’ command output.
$ps
PID TTY TIME CMD
18009 pts/19 00:00:00 bash
22228 pts/19 00:00:00 ps
VmPeak: 13276 kB
As the name suggests, it is the peak memory size of the process. It also infers that the memory size of the process keeps on varying.
VmSize: 13276 kB
The current size of the virtual memory being used by the process.
VmData: 280 kB
The size of the data segment of the process in memory.
VmStk: 136 kB
The size of the stack segment of the process in memory
VmExe: 12 kB
The size of the text segment of the process in memory is 4KB
VmLib: 4564 kB
The size of virtual memory occupied by the shared objects is 1788KB.
Threads: 1
The number of threads. Since, we never started any new thread, just the main thread is running.
If you are interested to learn the complete output of your process, the man page is very helpful.
The real addresses
It’s time to jump into the addresses of the segments of our process. The process segments are also termed as virtual areas in the kernel terminology. Worth mentioning, the addresses we see in this section are all virtual addresses.
We shall pick up the same squareSum program what we wrote in the previous section.
Let us create our process and get it running and sleeping 🙂
$./squareSum &
We again will use the procfs to get the absolute process virtual memory mapping to each segment. Here is how I do it:
cat /proc/<process pid>/maps
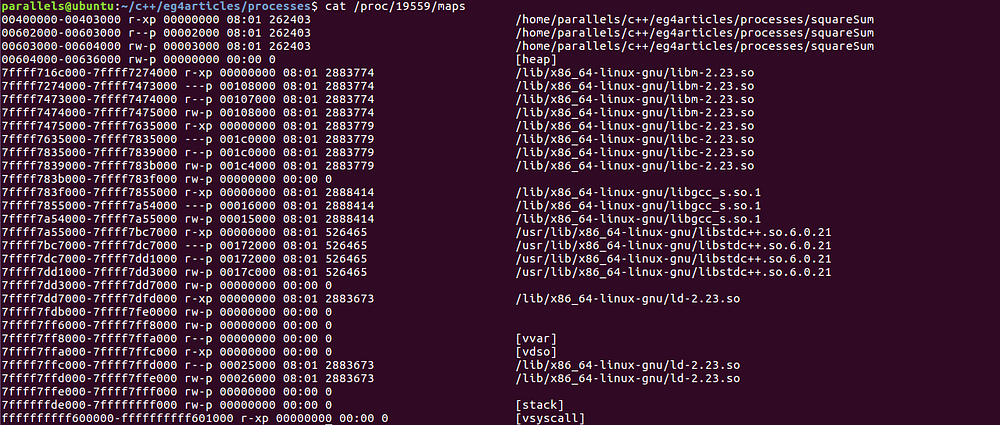
The memory maps from my system looks like
$ cat /proc/25371/maps
00400000–00403000 r-xp 00000000 08:01 262403 /home/parallels/c++/eg4articles/processes/squareSum
00602000–00603000 r — p 00002000 08:01 262403 /home/parallels/c++/eg4articles/processes/squareSum
00603000–00604000 rw-p 00003000 08:01 262403 /home/parallels/c++/eg4articles/processes/squareSum
00df2000–00e24000 rw-p 00000000 00:00 0 [heap]
7f87f7979000–7f87f7a81000 r-xp 00000000 08:01 2888287 /lib/x86_64-linux-gnu/libm-2.23.so
7f87f7a81000–7f87f7c80000 — -p 00108000 08:01 2888287 /lib/x86_64-linux-gnu/libm-2.23.so
7f87f7c80000–7f87f7c81000 r — p 00107000 08:01 2888287 /lib/x86_64-linux-gnu/libm-2.23.so
7f87f7c81000–7f87f7c82000 rw-p 00108000 08:01 2888287 /lib/x86_64-linux-gnu/libm-2.23.so
7f87f7c82000–7f87f7e41000 r-xp 00000000 08:01 2888281 /lib/x86_64-linux-gnu/libc-2.23.so
7f87f7e41000–7f87f8041000 — -p 001bf000 08:01 2888281 /lib/x86_64-linux-gnu/libc-2.23.so
7f87f8041000–7f87f8045000 r — p 001bf000 08:01 2888281 /lib/x86_64-linux-gnu/libc-2.23.so
7f87f8045000–7f87f8047000 rw-p 001c3000 08:01 2888281 /lib/x86_64-linux-gnu/libc-2.23.so
7f87f8047000–7f87f804b000 rw-p 00000000 00:00 0
7f87f804b000–7f87f8061000 r-xp 00000000 08:01 2888414 /lib/x86_64-linux-gnu/libgcc_s.so.1
7f87f8061000–7f87f8260000 — -p 00016000 08:01 2888414 /lib/x86_64-linux-gnu/libgcc_s.so.1
7f87f8260000–7f87f8261000 rw-p 00015000 08:01 2888414 /lib/x86_64-linux-gnu/libgcc_s.so.1
7f87f8261000–7f87f83d3000 r-xp 00000000 08:01 526465 /usr/lib/x86_64-linux-gnu/libstdc++.so.6.0.21
7f87f83d3000–7f87f85d3000 — -p 00172000 08:01 526465 /usr/lib/x86_64-linux-gnu/libstdc++.so.6.0.21
7f87f85d3000–7f87f85dd000 r — p 00172000 08:01 526465 /usr/lib/x86_64-linux-gnu/libstdc++.so.6.0.21
7f87f85dd000–7f87f85df000 rw-p 0017c000 08:01 526465 /usr/lib/x86_64-linux-gnu/libstdc++.so.6.0.21
7f87f85df000–7f87f85e3000 rw-p 00000000 00:00 0
7f87f85e3000–7f87f8609000 r-xp 00000000 08:01 2888270 /lib/x86_64-linux-gnu/ld-2.23.so
7f87f87ec000–7f87f87f1000 rw-p 00000000 00:00 0
7f87f8806000–7f87f8808000 rw-p 00000000 00:00 0
7f87f8808000–7f87f8809000 r — p 00025000 08:01 2888270 /lib/x86_64-linux-gnu/ld-2.23.so
7f87f8809000–7f87f880a000 rw-p 00026000 08:01 2888270 /lib/x86_64-linux-gnu/ld-2.23.so
7f87f880a000–7f87f880b000 rw-p 00000000 00:00 0
7ffe71238000–7ffe71259000 rw-p 00000000 00:00 0 [stack]
7ffe712c4000–7ffe712c6000 r — p 00000000 00:00 0 [vvar]
7ffe712c6000–7ffe712c8000 r-xp 00000000 00:00 0 [vdso]
ffffffffff600000-ffffffffff601000 r-xp 00000000 00:00 0 [vsyscall]
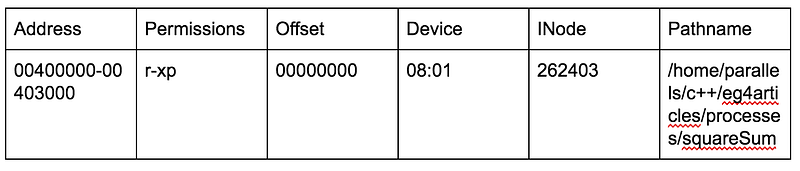
Aahh… multitude of hexadecimal numbers. I love it! Welcome to the world of memory addresses! Following table illustrates what each column of our output mean:
The best resource to learn what each column means and signifies is our very own wise man pages
$man proc
Here is my attempt to provide brief introductions by taking reference from the man page:
Address :
The start address and the end address in the process that the mapping occupies
Permissions:
Set of permissions where,
r means readable
w means writable
x means executable
p means private i.e it is not shared.
s means shared
Offset:
The offset in the file where the mapping begins. Not every mapping is mapped from a file, so the value of offset is zero in that case.
Device :
In the form “major number : minor number” of the associated device, as in, the file from which this mapping is mapped from. Again, the mappings which are not mapped from any file, value is 00:00.
INode:
I-node of the related file.
Pathname:
The path of the related file. Its blank in case there is no related file.
In order to identify the segments, we check the access permissions associated with each segment. Let us take the first segment i.e. the first row of the output.
00400000–00403000 r-xp 00000000 08:01 262403 /home/parallels/c++/eg4articles/processes/squareSum
The access permissions implies it is a readable and executable private segment. From all the segment descriptions, we can make out it is the text segment. The text segment is the read-only with contains the instructions from the binary. Looking at the related file, it is not hard to guess, the region from virtual address 0x00400000 to 0x00403000 is our text segment.
Moving on to the next row
00602000–00603000 r — p 00002000 08:01 262403 /home/parallels/c++/eg4articles/processes/squareSum
From the permissions, this looks like a read-only private segment. This is one of the additional read-only segment a process can possess.
The next one,
00603000–00604000 rw-p 00003000 08:01 262403 /home/parallels/c++/eg4articles/processes/squareSum
Again, noticing the access permissions, its a read/write segment which points to the data segment of the process.
The following next row again looks like a segment with read/write permissions.
00df2000–00e24000 rw-p 00000000 00:00 0 [heap]
It is the heap segment as indicated by the map entry itself. However, notice, it is not related to any file (as offset = major # = minor # = inode = 0).
The next ones, again reads like text segment, read-only segment and data segment respectively, but the related file is a shared object. As we can see we are linking to: libm (GNU Math), libc, libgc, libstdc++ and ld.
7f87f7979000–7f87f7a81000 r-xp 00000000 08:01 2888287 /lib/x86_64-linux-gnu/libm-2.23.so
7f87f7a81000–7f87f7c80000 — -p 00108000 08:01 2888287 /lib/x86_64-linux-gnu/libm-2.23.so
7f87f7c80000–7f87f7c81000 r — p 00107000 08:01 2888287 /lib/x86_64-linux-gnu/libm-2.23.so
7f87f7c81000–7f87f7c82000 rw-p 00108000 08:01 2888287 /lib/x86_64-linux-gnu/libm-2.23.so
7f87f7c82000–7f87f7e41000 r-xp 00000000 08:01 2888281 /lib/x86_64-linux-gnu/libc-2.23.so
7f87f7e41000–7f87f8041000 — -p 001bf000 08:01 2888281 /lib/x86_64-linux-gnu/libc-2.23.so
7f87f8041000–7f87f8045000 r — p 001bf000 08:01 2888281 /lib/x86_64-linux-gnu/libc-2.23.so
7f87f8045000–7f87f8047000 rw-p 001c3000 08:01 2888281 /lib/x86_64-linux-gnu/libc-2.23.so
7f87f8047000–7f87f804b000 rw-p 00000000 00:00 0
Note that, although these segments are mapped out of a shared object, though currently in this virtual memory area, they are not shared. Hence the permissions states them as private memory mapping.
We also see some mappings inside the linked shared objects, where have pathnames as blank. These are anonymous mappings, hence sources are unknown.
Besides, we have more additional mappings as we can see below:
7f87f880a000–7f87f880b000 rw-p 00000000 00:00 0
The first one represents yet another anonymous read/write segment which may be used as a backing store.
7ffe71238000–7ffe71259000 rw-p 00000000 00:00 0 [stack]
The next one with [Stack], is the main thread’s stack segment which enfolds the local variables. The stack mapping can also be listed as [Stack:<threadID>] where it represents the stack for the specified thread ID.
7ffe712c4000–7ffe712c6000 r — p 00000000 00:00 0 [vvar]
I’ll talk about the [vvar] mapping with [vsyscall] mappings, as they are tied to the same concepts.
7ffe712c6000–7ffe712c8000 r-xp 00000000 00:00 0 [vdso]
The above one, though not related to any file, but specifies itself by [vdso]. It is a special memory area for kernel provided shared library to aid userspace call to kernel-space. The abbreviated full form is virtual dynamically linked shared object.
ffffffffff600000-ffffffffff601000 r-xp 00000000 00:00 0 [vsyscall]
7ffe712c4000–7ffe712c6000 r — p 00000000 00:00 0 [vvar]
The above two mappings are related to the concepts of how system calls work. As we know, the system calls uses the kernel address space and needs the switch to kernel mode from the user mode. However, these context switching are overheads. To make things work faster, Linux allows to put the read-only system calls into the user process address space, so that they are accessible without the need to switch to the kernel mode. These user-space functions which can access the kernel space informations are called virtual system calls. Hence, we see the mapping for [vsyscall]. As we can see from the permissions in the mapping, it is read only, private and executable segment. To aid virtual system calls, variables from the kernel address space are mapped to the user-space addresses. This mapping is [vvar] as we see here. Its also important to understand here, that now kernel variables will have two address — kernel-space a address and mapped user-space address. Though the later has restricted permissions.
A simple exercise
As a very basic experiment, let’s print addresses of the variables we use and match what range and mapping it belongs to.
I use gdb to take a peek at addresses of the variables, however feel free to add another std::cout in the program, if you like.
$ gdb squareSum
(gdb) run
Starting program: /home/parallels/c++/eg4articles/processes/squareSum
Breakpoint 1, main () at squareSum.cpp:21
21 sqSum += (list.at(i)*list.at(i));
(gdb) print&sqSum
$2 = (int64_t *) 0x7fffffffdde8
Here is the process memory map of my current squareSum process:
Studying the addresses in the procfs mapping, we see that the local variables belong to the stack segment, as stack memory begins at address 0x7ffffffde000 and end at 0x7ffffffff000. The address of the local variable ‘local_size’ is ‘0x7fffffffdde8’ which is
0x7ffffffde000 > 0x7fffffffdde8 < 0x7ffffffff000
|stack-start-addr| |local_size addr| |stack-end-addr|
Therefore, the mapping we are interested in is,
7ffe71238000-7ffe71259000 rw-p 00000000 00:00 0 [stack]
Well, nothing new except the feeling of fulfillment to see our local variable actually sits inside the stack. 🙂
One more
So, now, we know the virtual addresses of the process memory areas and we’ve also experienced the joy to see that the local variables address within the main thread’s stack. Let’s explore more addresses in the space. However, this time I’ll write another program using more of the varied memory areas.
My next program converts a number to a string.
// global variables
uint32_t g_initializedNum = 1210;
uint32_t g_uninitializedNum;
/*convert a number to a string*/
int main()
{
//local variables
uint32_t local_size = 1;
unsigned char *heap_str = NULL; // will find a place in heap
int32_t local_i = 0;
uint32_t local_temp = 0;
/*Determine the length of our output
string i.e how many numbers form our number*/
g_uninitializedNum = g_initializedNum;
while (1)
{
g_uninitializedNum /= 10;
if (!g_uninitializedNum)
{
break;
}
local_size++;
}
printf(“ The computed local size is %dn”, local_size);
// Allocate memory for string of
//computed size + 1 for terminating
// null character
heap_str = (unsigned char*) std::malloc ((local_size + 1) * sizeof(unsigned char));
if (heap_str == NULL)
{
printf(“Memory error!n”);
exit(1);
}
g_uninitializedNum = g_initializedNum;
for (local_i = local_size — 1;local_i >= 0 ; local_i--)
{
local_temp = g_uninitializedNum % 10;
heap_str[local_i] = local_temp + ‘0’;
g_uninitializedNum /= 10;
}
heap_str[local_size] = 0;
printf(“The output string is %s n”, heap_str);
//We need time to get hold of the memory maps
sleep(100);
// Free the heap memory
std::free(heap_str);
return 0;
}
My intention while writing the above code was to sprinkle the variables in different memory segments, hence pardon the liberty I have taken against writing the most efficient and optimized code. 🙂
We are all set for the fun!
$ g++ -g -Wall num2string.cpp -o num2string
$ gdb num2string
51 heap_str[local_size] = 0;
(gdb) print &g_initializedNum
$1 = (uint32_t *) 0x601078 <g_initializedNum>
(gdb) print &g_uninitializedNum
$2 = (uint32_t *) 0x601080 <g_uninitializedNum>
(gdb) print &local_size
$3 = (uint32_t *) 0x7fffffffde0c
(gdb) print heap_str
$4 = (unsigned char *) 0x614030 “1210”
Let me grab the mappings as well for our currently running num2string process:
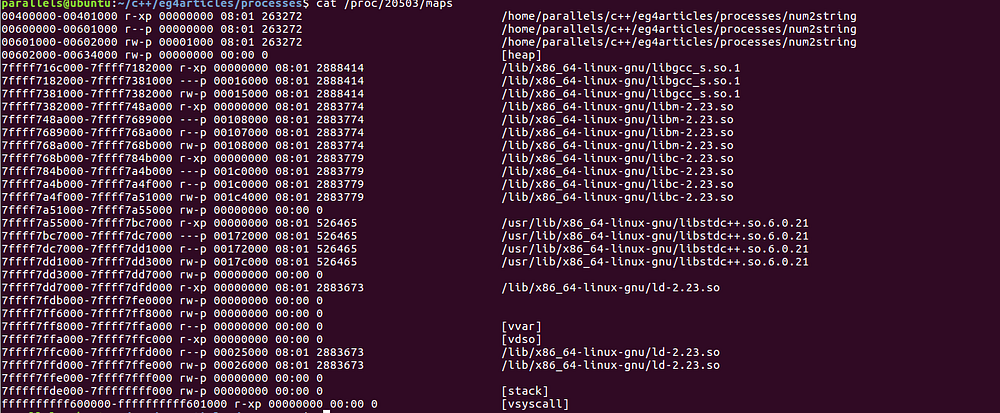
We got all the data to analyze.
Picking up the global variables:
$1 = (uint32_t *) 0x601078 <g_initializedNum>
Here is the mapping where it belongs:
00601000–00602000 rw-p 00001000 08:01 263272 /home/parallels/c++/eg4articles/processes/num2string
It is the data segment mapping with read/write permissions.
With the uninitialized global variables,
$2 = (uint32_t *) 0x601080 <g_uninitializedNum>
We can see this variable is placed right next to the other global variable in the data segment:
00601000–00602000 rw-p 00001000 08:01 263272 /home/parallels/c++/eg4articles/processes/num2string
The memory address for the local variables seems to be coming to another mapping.
(gdb) print &local_size
$3 = (uint32_t *) 0x7fffffffde0c
Going back to our memory map, here is where it belongs:
7ffffffde000–7ffffffff000 rw-p 00000000 00:00 0 [stack]
Next one is our dynamically allocated memory. Lets see the memory address is in the heap mapping addresses.
(gdb) print heap_str
$4 = (unsigned char *) 0x614030 “1210”
Here is the mapping the address falls into:
00602000–00634000 rw-p 00000000 00:00 0 [heap]
Quite obvious and still feels good to see.
Creating Processes in programs
Standard C facilitates creating processes from a running process. Another interesting and vital fact is that, when a process creates a new process, both the two processes have their own separate memories in the RAM, where each of the process have their own individual process memory segments.
Let’s look at the two popular ways of creating new processes in a program.
The system() method
There is a convenient option to run commandline commands/executables from within a program. It is done through the system() method.
The syntax from the man page looks like:
int system(const char *command);
It takes a command in the format of a string as its input argument and returns the command status after the command completion.
Here is an example program to illustrate the use of the system() method
int main()
{
int retcode = 0;
retcode = system(“cat sys.c”);
return retcode;
}
Compiling and running the built binary,
$ gcc sys.c -Wall -o sys
$./sys
The output I get is:
int main()
{
int retcode = 0;
retcode = system(“cat sys.c”);
return retcode;
}
Pretty much as we expected. It runs the command given to the system() method which displays the contents of the ‘sys.c’ file on the standard output.
However, interesting to know is that it isn’t the ‘sys’ process which created the new process running ‘cat’ executable. With the system() method, it creates new process ‘shell’ and hands over the command to it, which in turn triggers the ‘cat’ command and creates that process. To confirm, let us run our squareSum binary from our source and check its parent process.
Here is the modified source, to trigger squareSum
int main()
{
int retcode = 0;
retcode = system(“./squareSum”);
return retcode;
}
We build the source and run the binary in the background.
$ gcc sys.c -Wall -o sys
$./sys &
We know running ‘squareSum’ executable is a blocking call as it has a 100 sec sleep().
Therefore, in the meanwhile, we wish to see what all processes are running and their PID’s.
$ ps
PID TTY TIME CMD
5543 pts/2 00:00:00 bash
14847 pts/2 00:00:00 sys
14848 pts/2 00:00:00 sh
14849 pts/2 00:00:00 squareSum
14883 pts/2 00:00:00 ps
We get an inkling from the running ‘sh’ process that it must have been started by the system() call in the ‘sys’ process. Along with, we also notice the ‘squareSum’ process running, which has been launched from within our program using the ‘system()’ call.
To check the parent process of ‘squareSum’, we use the linux command ‘ps’ as
$ ps -f
UID PID PPID C STIME TTY TIME CMD
paralle+ 5543 5536 0 06:02 pts/2 00:00:00 bash
paralle+ 14847 5543 0 14:06 pts/2 00:00:00 ./sys
paralle+ 14848 14847 0 14:06 pts/2 00:00:00 sh -c ./squareSum
paralle+ 14849 14848 0 14:06 pts/2 00:00:00 ./squareSum
paralle+ 14929 5543 0 14:06 pts/2 00:00:00 ps -f
Note: One can also use the procfs as /proc/14849/status to know the PPID of the ‘squareSum’ process.
From the ‘ps -f’ output, we are interested in following processes,
paralle+ 14847 5543 0 14:06 pts/2 00:00:00 ./sys
paralle+ 14848 14847 0 14:06 pts/2 00:00:00 sh -c ./squareSum
paralle+ 14849 14848 0 14:06 pts/2 00:00:00 ./squareSum
./squareSum sets forth the PPID as ‘14848’ which is the PID of the shell process (i.e. sh -c ./squareSum). Moreover, the PPID of the shell process is ‘14847’ which is the PID of our ‘sys’ process.
Caveat Although, using the ‘system()’ method is pretty convenient, it has limitations and drawbacks too. Since, it uses shell to run the command, the behavior of the command will depend upon what shell it is using. If the shell is compromised in security, using the ‘system()’ method could be hazardous.
The fork() method
The fork() call is used to create a duplicate child process as the parent process which is calling it. So, from the point, the fork() call was made, both the parent and the child process starts executing the same program instructions following the fork() call.
The syntax from the man page is
#include <unistd.h >
pid_t fork(void);
Notice we have a data-type provided for the PIDs
pid_t
Therefore, if we want to store a PID in a variable, we now know what data-type it should be.
Although we have additional new processes initiating after a fork() is called, there is one distinguishing value to identity the parent vs child process. This distinguishing value is the PID value returned by the fork() call. The parent process will will see the PID returned as the pid of the newly spawned child process. However, in the newly created child process, this PID return value will be zero
Further, we shall experience using the fork() method in a a very basic program which looks like.
int main()
{
pid_t pid_child = 0;
int a = 12;
int b = 3;
int result = -1;
printf(“All set to create another processn”);
pid_child = fork();
if (pid_child)
{
result = a + b;
printf(“Root process : The result is %dn”, result);
}
else
{
/*The pid_child = 0*/
result = a * b;
printf(“Child process : The result is %dn”, result);
}
/*Buying time to check the running processes*/
sleep(100);
return 0;
}
In the above example source code, we do two different operations in both the child and parent processes. In the parent process, the value returned by fork() would be a valid PID i.e. non-zero positive value. However, in the child process instance, the variable value would be just zero, as this process has just been created.
Well, are sending both the processes to sleep for 100 seconds.
Time to compile and launch the process:
$ gcc -Wall forkExample.c -o forkExample
$ ./forkExample &
[1] 17338
$ All set to create another process
Root process : The result is 15
Child process : The result is 36
The processes are now sleeping after printing the results. Meanwhile, let us check the active process information.
$ ps -f
UID PID PPID C STIME TTY TIME CMD
paralle+ 5543 5536 0 06:02 pts/2 00:00:00 bash
paralle+ 17338 5543 0 14:19 pts/2 00:00:00 ./forkExample
paralle+ 17339 17338 0 14:19 pts/2 00:00:00 ./forkExample
paralle+ 17430 5543 0 14:20 pts/2 00:00:00 ps -f
From the above output, we identify our two processes with the same command.
One of them [PID =17338 : CMD = ./forkExample] is our ‘Root’ process which has the PPID [= 5536], same as of the ‘bash’ and second one [ PID = 17339 : CMD = ./forkExample] is the ‘Child’ process which has the PPID [ = 17338] same as as the PID of the first one..
Thats all for today. Hope you enjoyed fiddling around with the linux processes.
$ps
PID CMD
333 PenProcess
$kill -9 333


