
Home Blog

Implementing Secure Zero-Touch Provisioning in AI and Edge Infrastructure
By Juha Holkkola, FusionLayer Group
How DHCP Changed Connectivity
In the late 1990s, the DHCP (Dynamic Host Configuration Protocol) quietly catalyzed a revolution in digital connectivity. Before DHCP was introduced, connecting devices to a network involved manual entry of IP addresses, DNS servers, subnet masks, and gateways. Networks were fragile, prone to errors, and severely limited in scalability. The introduction of DHCP changed everything and became a game-changer for networking.
With widespread adoption across operating systems, DHCP made networking a plug-and-play experience. This fundamental change accelerated the adoption of Wi-Fi, standardized enterprise networks using DHCP-based addressing, and propelled the mobile Internet to viability. While DHCP simplified network connectivity by automating IP address assignments, it also introduced the world to the essence of effortless connectivity.
Fast forward to today, connectivity remains effortless, yet escalating threats continuously challenge digital trust. Just as DHCP revolutionized connectivity, we are primed for a transformation of equal magnitude concerning digital trust. The solution is clear: we must automate trust through Secure Zero-Touch Provisioning (SZTP).
SZTP: Secure Zero-Touch Provisioning
Modern digital infrastructure, spanning cloud nodes, edge systems, IoT sensors, industrial robotics, home gateways, and AI-centered factories, necessitates robust security measures. To maintain secure environments, each device in this extensive ecosystem must autonomously verify its needs. This includes self-authentication, receiving verified firmware, installing necessary credentials, and joining orchestrated environments without human intervention, which DHCP alone cannot accomplish.
Secure Zero-Touch Provisioning (SZTP), as defined in RFC 8572, steps up to address these needs in our complex digital reality. It builds trust by automating the exchange of essential artifacts and certificates required for seamless device bootstrapping: verifying hardware identity, delivering trusted firmware and OS images, applying patches, injecting cryptographic credentials, and setting up a complete runtime environment automatically, without manual interaction.
SZTP is based on open standards, making it vendor-neutral and ideal for large-scale deployments. As digital ecosystems grow in complexity, SZTP promises a future in which AI agents can autonomously request and deploy secure infrastructure within minutes, enhancing operational efficiency and security simultaneously.
Step-by-Step: Implementing SZTP in Your Infrastructure
- Device Identification and Authentication
Begin by integrating SZTP in your network infrastructure. Once a device powers on, it must first establish identity through a secure channel. This is typically done using hardware-based security measures, such as a TPM (Trusted Platform Module), to provide hardware attestation.
- Firmware Verification and Secure Image Delivery
Implement policies to verify firmware integrity. Use cryptographic signatures to ensure firmware authenticity. SZTP can fetch secure firmware and OS images from trusted repositories. For instance, create a policy that requires all devices to verify their firmware against a centralized manifest.
- Credential Injection and Environment Initialization
Devices securely receive cryptographic credentials and configuration files. Use automated scripts to distribute these credentials from a central management server. Next, deploy containerized workloads using tools such as Kubernetes to orchestrate the environment.
- Lifecycle Management and Patch Automation
With SZTP, configure automated patch management systems to apply security patches and software updates. Implement CI/CD pipelines that automatically redeploy updated firmware images, ensuring devices run the latest software versions.
SZTP is ideal for AI and Edge Clouds
AI factories rely on specialized processors, such as DPUs, to offload networking, storage, and security tasks from GPUs. Linux Foundation’s OPI project has adopted SZTP as a standard initialization method for these devices.
Here’s how SZTP simplifies AI and edge cloud deployment:
- Device Identity and Trust Management
SZTP serves DPUs like DHCP did for laptops, answering questions crucial to trust: “Who are you?” and “Can you be trusted?” Use open-source libraries to develop trust protocols integrated with SZTP, enhancing the security posture.
- Automated Secure Provisioning
Ensure your infrastructure is secure by default. Initiate hardware attestation, verify boot components, and use automated tools to deliver secure images and deploy cryptographic credentials. Platforms like HashiCorp Vault can manage secrets during this process.
- Comprehensive Software Stack Deployment
SZTP allows for defining a device’s mission by automating the deployment of OS components, runtimes, and security agents. Leverage Docker and Kubernetes to handle container runtimes and orchestration, ensuring efficient management of service mesh layers and logging telemetries.
- Scalable Client Implementations
Establish open-source client initiatives to enhance adoption. Encourage device manufacturers and OS vendors to integrate this client to promote SZTP adoption further and reduce integration complexity.
Conclusion
Open clients enabled DHCP to transform networking, and they will guide SZTP in defining secure, automated infrastructure’s next era for AI-enabled applications. Automate your edge and AI factory environments with SZTP, elevating digital trust to unprecedented levels.
By following these steps and leveraging SZTP technology, organizations can enhance their network security, automate deployment processes, and prepare their infrastructure for a future driven by AI and IoT.
From DHCP to SZTP – The Trust Revolution
By Juha Holkkola, FusionLayer Group
The Dawn of Effortless Connectivity
In the transformative years of the late 1990s, a quiet revolution took place, fundamentally altering how we connect to networks. The introduction of DHCP answered a crucial question, “Where are you on the network?”, by automating IP address assignment. This innovation eradicated the manual configuration nightmares, paving the way for seamless connectivity. Today, as digital trust becomes increasingly vital, a new revolution is emerging—one that demands an equally transformative approach: Secure Zero-Touch Provisioning (SZTP).
Trust: The Next Frontier
As we stand on the brink of this next wave of innovation, we recognize a pressing need to automate trust. Much like DHCP revolutionized connectivity, SZTP is poised to redefine security and trust in modern networking infrastructures. The digital landscape is evolving; spanning from cloud nodes and IoT sensors to AI-driven systems and intelligent robotics, the future of secure networking lies in our ability to trust devices automatically and unequivocally.
SZTP: Pioneering the Trust Paradigm
SZTP, as defined in RFC 8572, represents a groundbreaking shift in how we establish trust across diverse digital infrastructures. This open standard is vendor-neutral, heralding a universally adoptable solution fit for large-scale deployment. It automates trust by managing the exchange of secure artifacts and certificates, ushering in an era in which devices self-authenticate, receive verified firmware, and securely initialize without human intervention.
For organizations navigating the complexities of modern digital ecosystems, SZTP is more than a protocol; it’s a strategic approach equipped to handle the challenges of autonomous, scalable, and secure operations.
Unlocking Potential: AI and Edge Clouds
One of the most compelling use cases for SZTP is its application within AI data centers—environments now likened to future-ready AI factories. Here, devices such as DPUs (Data Processing Units) and IPUs (Infrastructure Processing Units) perform critical tasks by offloading networking and security operations from traditional GPUs, running complex, containerized workloads. With SZTP, these environments are provisioned and secured at unprecedented scales, aligning perfectly with the Linux Foundation’s Open Programmable Infrastructure (OPI) project’s standards.
Additionally, edge clouds represent a burgeoning frontier. As AI-driven applications demand lower latency, bringing operations geographically closer to end users becomes crucial. With SZTP, deployment at tens of thousands of sites becomes feasible, secure, and remarkably efficient, empowering next-generation applications from autonomous vehicles to immersive synthetic realities.
Strategic Pillars of SZTP Implementation
- From Addresses to Identity
Just as DHCP provides basic network connectivity, SZTP redefines the initial handshake with devices, answering the questions “Who are you?” and “What role do you play?” This trust-centric evolution reflects an essential shift towards identity verification and operational certainty from the outset.
- Secure-by-Default Provisioning
Establishing secure-by-default infrastructures is increasingly critical. SZTP ensures onboarding initiates with hardware attestation, swiftly evolving devices into secure nodes through verified boot processes, secure image delivery, and cryptographic credential injection.
- From Firmware to Mission-Centric Deployments
In advanced environments, SZTP delivers a complete software stack—it not only defines device roles across domains such as XR workloads and IoT pipelines but also simulates workloads pre-deployment to ensure readiness and optimal performance.
- Scaling Through Open Clients and Adoption
Industry-wide adoption of SZTP mirrors DHCP’s trajectory, necessitating robust open-source client solutions. The availability of open-source SZTP clients under permissive licenses is accelerating adoption across the ecosystem.
Driving the Secure Future
As digital networks extend their reach and capabilities, securing these environments becomes not just a priority but a necessity. SZTP shines as a beacon of innovation, demonstrating that with open standards and robust automation, trust can be as effortless as connectivity once was.
By nurturing open client ecosystems, SZTP doesn’t just promise enhanced digital trust; it actively defines what secure, automated infrastructure looks like in an AI-enabled world of applications. It lays the groundwork for what digital trust should be in future network paradigms, leading the charge into a new era of connectivity redefined by trust.
Moreover, adopting SZTP empowers organizations to innovate confidently, knowing their infrastructure is resilient and agile enough to handle growth and complexity. As businesses shift toward data-driven models and consumers demand more sophisticated digital interactions, SZTP ensures security and performance are uncompromised. Organizations embracing this strategy will secure operations and cultivate trust, enhancing customer relationships and accelerating digital transformation.
Looking ahead, SZTP is more than an implementation; it is pivotal for future-proofing the digital economy, setting new benchmarks for security, efficiency, and trust in the evolving technological ecosystem.
Celebrating the Second Year of Linux Man-Pages Maintenance Sponsorship

Sustaining a Core Part of the Linux Ecosystem
The Linux Foundation has announced a second year of sponsorship for the ongoing maintenance of the Linux manual pages (man-pages) project, led by Alejandro (Alex) Colomar. This critical initiative is made possible through the continued support of Google, Hudson River Trading, and Meta, who have renewed their sponsorship to ensure the long-term health of one of the most fundamental resources in the Linux ecosystem.
Since 2020, Alex Colomar has been the lead maintainer of the man-pages, providing detailed documentation for system calls, library functions, and other core aspects of the Linux API. While Alex initially maintained the project voluntarily, sponsorship beginning in 2024—supported by Google, Hudson River Trading, Meta, and others—has enabled him to dedicate more time and focus to improving the quality, accessibility, and accuracy of the Linux man-pages.
Expanding and Modernizing the Man-Pages
Over the last year, Alex’s work has resulted in major improvements that benefit both developers and maintainers across the Linux ecosystem. Highlights include:
- Enhanced readability and structure: The SYNOPSIS sections of many pages now include clearer parameter names and array bounds, while large pages such as
fcntl(2),futex(2), andkeyctl(2)have been refactored into more focused, maintainable units. - Build system improvements: Updates make packaging easier for distributions and introduce new diagnostic checks that help identify inconsistencies across pages.
- New documentation for GCC and Clang attributes: These additions reduce the documentation burden on the LLVM project while helping developers better understand compiler-specific features.
- Coverage of POSIX.1-2024 and ISO C23 updates: Nearly all recent standard changes have been documented, with more updates in progress.
- Developer tools and scripts: Utilities such as
diffman-git(1),mansect(1), andpdfman(1)help developers compare versions, extract specific sections, and generate printable documentation. Some are now included by default in major Linux distributions. - Historical preservation: Documentation now includes guidance for producing PDF books of manual pages and the ongoing project of recreating original Unix manuals to compare modern APIs against historical references.
- Upstream fixes and contributions: Beyond man-pages, Alex has submitted patches to groff, the Linux kernel, and GCC, and contributed to improving the spatial memory safety of C through the ISO C Committee, including by adding the new _Countof()operator which will continue to evolve in the coming years.
Enabling Sustainability Through Collaboration
The man-pages project continues to be one of the most relied-upon open documentation resources in computing, providing millions of developers with accurate and accessible information directly from the command line. Its continued maintenance is vital to the long-term health of Linux and open source software at large.
Disaggregated Routing with SONiC and VPP: Lab Demo and Performance Insights – Part Two
In Part One of this series, we examined how the SONiC control plane and the VPP data plane form a cohesive, software-defined routing stack through the Switch Abstraction Interface.
We outlined how SONiC’s Redis-based orchestration and VPP’s user-space packet engine come together to create a high-performance, open router architecture.
In this second part, we’ll turn theory into practice. You’ll see how the architecture translates into a working environment, through a containerized lab setup that connects two SONiC-VPP routers and Linux hosts.
Reconstructing the L3 Routing Demo
Understanding the architecture is foundational, but the true power of this integration becomes apparent through a practical, container-based lab scenario.
The demo constructs a complete L3 routing environment using two SONiC-VPP virtual routers and two Linux hosts, showcasing how to configure interfaces, establish dynamic routing, and verify end-to-end connectivity.
Lab Environment and Topology
The demonstration is built using a containerized lab environment, orchestrated by a tool like Containerlab. This approach allows for the rapid deployment and configuration of a multi-node network topology from a simple declarative file. The topology consists of four nodes:
- router1: A SONiC-VPP virtual machine acting as the gateway for the first LAN segment.
- router2: A second SONiC-VPP virtual machine, serving as the gateway for the second LAN segment.
- PC1: A standard Linux container representing a host in the first LAN segment.
- PC2: Another Linux container representing a host in the second LAN segment.
These nodes are interconnected as follows:
- An inter-router link connects router1:eth1 to router2:eth1.
- PC1 is connected to router1 via PC1:eth2 and router1:eth2.
- PC2 is connected to router2 via PC2:eth2 and router2:eth2.
Initial Network Configuration
Once the lab is deployed, a startup script applies the initial L3 configuration to all nodes.
- Host Configuration: The Linux hosts, PC1 and PC2, are configured with static IP addresses and routes.
- PC1 is assigned the IP address 10.20.1.1/24 and is given a static route for the 10.20.2.0/24 network via its gateway, router1 (10.20.1.254).
- PC2 is assigned the IP address 10.20.2.1/24 and is given a static route for the 10.20.1.0/24 network via its gateway, router2 (10.20.2.254).
- Router Interface Configuration: The SONiC-VPP routers are configured using the standard SONiC CLI.
- router1:
- The inter-router interface Ethernet0 is configured with the IP 10.0.1.1/30.
- The LAN-facing interface Ethernet4 is configured with the IP 10.20.1.254/24.
- router2:
- The inter-router interface Ethernet0 is configured with the IP 10.0.1.2/30.
- The LAN-facing interface Ethernet4 is configured with the IP 10.20.2.254/24.
- After IP assignment, each interface is brought up using the sudo config interface startup command.
Dynamic Routing with BGP
With the interfaces configured, dynamic routing is established between the two routers using the FRRouting suite integrated within SONiC. The configuration is applied via the vtysh shell.
- iBGP Peering: An internal BGP (iBGP) session is established between router1 and router2 as they both belong to the same Autonomous System (AS) 65100.
- router1 (router-id 10.0.1.1) is configured to peer with router2 at 10.0.1.2.
- router2 (router-id 10.0.1.2) is configured to peer with router1 at 10.0.1.1.
- Route Advertisement: Each router advertises its connected LAN segment into the BGP session.
- router1 advertises the 10.20.1.0/24 network.
- router2 advertises the 10.20.2.0/24 network.
This BGP configuration ensures that router1 learns how to reach PC2’s network via router2, and router2 learns how to reach PC1’s network via router1.
Verification and Data Path Analysis
The final phase is to verify that the configuration is working correctly at every layer of the stack.
- Control Plane Verification: The BGP session status and learned routes can be checked from within vtysh on either router. On router1, the command show ip bgp summary would confirm an established peering session with router2. The command show ip route would display the route to 10.20.2.0/24 learned via BGP from 10.0.1.2.
- Data Plane Verification: To confirm the route has been programmed into the VPP data plane, an operator would access the VPP command-line interface (vppctl) inside the syncd container. The command show ip fib would display the forwarding table, which should include the BGP-learned route to 10.20.2.0/24, confirming that the state has been successfully synchronized from the control plane.
- End-to-End Test: The ultimate test is to generate traffic between the hosts. A simple ping 10.20.2.1 from PC1 should succeed. This confirms that the entire data path is functional: PC1 sends the packet to its gateway (router1), router1 performs a lookup in its VPP FIB and forwards the packet to router2, which then forwards it to PC2. The return traffic follows the reverse path, validating the complete, integrated solution.
This practical demonstration, using standard container tooling and declarative configurations, powerfully illustrates the operational simplicity and robustness of the SONiC-VPP architecture for building high-performance, software-defined L3 networks.
Performance Implications and Future Trajectories
The elegance of the SONiC-VPP integration is matched by its impressive performance and its applicability to a wide range of modern networking challenges.
By offloading the data plane from the kernel to a highly optimized user-space framework, this solution unlocks capabilities that are simply unattainable with traditional software-based routing.
The performance gains are impressive.
VPP is consistently benchmarked as being much faster than kernel-based forwarding, with some sources claiming a 10x to 100x improvement in packet processing throughput.2
This enables use cases like “Terabit IPSec” on multi-core COTS servers, a feat that would have been unthinkable just a few years ago.3 Real-world deployments have validated this potential.
A demonstration at the ONE Summit 2024 showcased a SONiC-VPP virtual gateway providing multi-cloud connectivity between AWS and Azure. The performance testing revealed a round-trip time of less than 1 millisecond between application workloads and the cloud provider on-ramps (AWS Direct Connect and Azure ExpressRoute), highlighting its suitability for high-performance, low-latency applications.4
This level of performance opens the door to a variety of demanding use cases:
- High-Performance Edge Routing: As a virtual router or gateway, SONiC-VPP can handle massive traffic volumes at the network edge, serving as a powerful and cost-effective alternative to proprietary hardware routers.5
- Multi-Cloud and Hybrid Cloud Connectivity: The solution is ideal for creating secure, high-throughput virtual gateways that interconnect on-premises data centers with multiple public clouds, as demonstrated in the ONE Summit presentation.4
- Integrated Security Services: The performance of VPP makes it an excellent platform for computationally intensive security functions. Commercial offerings based on this architecture, like AsterNOS-VPP, package the solution as an integrated platform for routing, security (firewall, IPsec VPN, IDS/IPS), and operations.5
While the raw throughput figures are compelling, a more nuanced benefit lies in the nature of the performance itself.
The Linux kernel, for all its power, is a general-purpose operating system. Its network stack is subject to non-deterministic delays, caused by system interrupts, process scheduling, and context switches. This introduces unpredictable latency, which can be detrimental to sensitive applications.12
VPP, by running in user space on dedicated cores and using poll-mode drivers, sidesteps these sources of unpredictability. This provides not just high throughput, but consistent, low-latency performance. For emerging workloads at the edge, such as real-time IoT data processing, AI/ML inference, and 5G network functions, this predictable performance is often more critical than raw aggregate bandwidth.16 The key value proposition, therefore, is not just being “fast,” but being “predictably fast.”
The SONiC-VPP project is not static; it is an active area of development within the open-source community.
A key focus for the future is to deepen the integration by extending the SAI API to expose more of VPP’s rich feature set to the SONiC control plane. Currently, SAI primarily covers core L2/L3 forwarding basics.
However, VPP has a vast library of advanced features. Active development efforts are underway to create SAI extensions for features like Network Address Translation (NAT) and advanced VxLAN multi-tenancy capabilities, which would allow these functions to be configured and managed directly through the standard SONiC interfaces.6
A review of pull requests on thesonic-platform-vpp GitHub repository shows ongoing work to add support for complex features like VxLAN BGP EVPN and to improve ACL testing, indicating a healthy and forward-looking development trajectory.6
The Future is Software-Defined and Open
The integration of the SONiC control plane with the VPP data plane is far more than a clever engineering exercise.
It is a powerful testament to the maturity and viability of the disaggregated networking model. This architecture successfully combines the strengths of two of the most significant open-source networking projects, creating a platform that is flexible, performant, and free from the constraints of proprietary hardware.
It proves that the separation of the control and data planes is no longer a theoretical concept but a practical, deployable reality that offers unparalleled architectural freedom.
The synergy between SONiC and FD.io VPP, both flagship projects of the Linux Foundation, highlights the immense innovative power of collaborative, community-driven development.1
This combined effort has produced a solution that fundamentally redefines the router, transforming it from a monolithic hardware appliance into a dynamic, high-performance software application that can be deployed on commodity servers.
Perhaps most importantly, this architecture provides the tools to manage network infrastructure with the same principles that govern modern software development.
As demonstrated by the L3 routing demo’s lifecycle-building from code, configuring with declarative files, and deploying as a versioned artifact, the SONiC-VPP stack paves the way for true NetDevOps. It enables network engineers and operators to embrace automation, version control, and CI/CD pipelines, finally treating network infrastructure as code. 7
In doing so, it delivers on the ultimate promise of software-defined networking – a network that is as agile, scalable, and innovative – as the applications it supports.
Sources
- SONiC Foundation – Linux Foundation Project https://sonicfoundation.dev/
- SONiC Architecture – Software for Open Networking in the Cloud (SONiC) – Cisco DevNet https://developer.cisco.com/docs/sonic/sonic-architecture/
- The Technology Behind FD.io – FD.io
https://fd.io/technology/ - SONiC Architecture and Deployment Deep Dive – Cisco Live https://www.ciscolive.com/c/dam/r/ciscolive/global-event/docs/2025/pdf/BRKMSI-2004.pdf
- Openstack edge cloud with SONiC VPP for high-speed and low-latency multi-cloud connectivity – YouTube https://www.youtube.com/watch?v=R6elTX_Zmtk
- Pull requests · sonic-net/sonic-platform-vpp – GitHub https://github.com/sonic-net/sonic-platform-vpp/pulls
- SONiC VPP-BGP Multipath https://pantheon.tech/blog-news/demo-sonic-vpp-bgp-multipath/
Disaggregated Routing with SONiC and VPP: Architecture and Integration – Part One
The networking industry is undergoing a fundamental architectural transformation, driven by the relentless demands of cloud-scale data centers and the rise of software-defined infrastructure. At the heart of this evolution is the principle of disaggregation: the systematic unbundling of components that were once tightly integrated within proprietary, monolithic systems.
This movement began with the separation of network hardware from the network operating system (NOS), a paradigm shift championed by hyperscalers to break free from vendor lock-in and accelerate innovation.
In this blog post, we will explore how disaggregated networking takes shape, when the SONiC control plane meets the VPP data plane. You’ll see how their integration creates a fully software-defined router – one that delivers ASIC-class performance on standard x86 hardware, while preserving the openness and flexibility of Linux-based systems.
Disaggregation today extends to the software stack, separating the control plane from the data plane. This decoupling enables modular design, independent component selection, and more efficient performance and cost management.
The integration of Software for Open Networking in the Cloud (SONiC) and the Vector Packet Processing (VPP) framework represents the peak of this disaggregated model.
SONiC, originally developed by Microsoft and now a thriving open-source project under the Linux Foundation, has established itself as the de facto standard for a disaggregated NOS, offering a rich suite of L3 routing functionalities hardened in the world’s largest data centers.1 Its core design philosophy is to abstract the underlying switch hardware, allowing a single, consistent software stack to run on a multitude of ASICs from different vendors. This liberates operators from the constraints of proprietary systems and fosters a competitive, innovative hardware ecosystem.
Complementing SONiC’s control plane prowess is VPP, a high-performance, user-space data plane developed by Cisco and now part of the Linux Foundation’s Fast Data Project (FD.io).
VPP’s singular focus is to deliver extraordinary packet processing throughput on commodity commercial-off-the-shelf (COTS) processors. By employing techniques like vector processing and bypassing the traditional kernel network stack, VPP achieves performance levels previously thought to be the exclusive domain of specialized, expensive hardware like ASICs and FPGAs.
The fusion of these two powerful open-source projects creates a new class of network device: a fully software-defined router that combines the mature, feature-rich control plane of SONiC with the blistering-fast forwarding performance of VPP.
This architecture directly addresses a critical industry need for a network platform that is simultaneously programmable, open, and capable of line-rate performance without relying on specialized hardware.
The economic implications are profound. By replacing vertically integrated, vendor-locked routers with a software stack running on standard x86 servers, organizations can fundamentally alter their procurement and operational models. This shift transforms network infrastructure from a capital-expenditure-heavy (CAPEX) model, characterized by large upfront investments in proprietary hardware, to a more agile and scalable operational expenditure (OPEX) model.
The ability to leverage COTS hardware drastically reduces total cost of ownership (TCO) and breaks the cycle of vendor lock-in, democratizing access to high-performance networking and enabling a more dynamic, cost-effective infrastructure strategy.
Deconstructing the Components: A Tale of Two Titans
To fully appreciate the synergy of the SONiC-VPP integration, it is essential to first understand the distinct architectural philosophies and capabilities of each component. While they work together to form a cohesive system, their internal designs are optimized for entirely different, yet complementary, purposes. SONiC is engineered for control, abstraction, and scalability at the management level, while VPP is purpose-built for raw, unadulterated packet processing speed.
SONiC: The Cloud-Scale Control Plane
SONiC is a complete, open-source NOS built upon the foundation of Debian Linux. Its architecture is a masterclass in modern software design, abandoning the monolithic structure of traditional network operating systems in favor of a modular, containerized, microservices-based approach. This design provides exceptional development agility and serviceability.
Key networking functions, such as:
- Border Gateway Protocol (BGP) routing stack
- Link Layer Discovery Protocol (LLDP)
- platform monitoring (PMON)
each run within their own isolated Docker container. This modularity allows individual components to be updated, restarted, or replaced without affecting the entire system, a critical feature for maintaining high availability in large-scale environments.
The central nervous system of this distributed architecture is an in-memory Redis database engine, which serves as the single source of truth for the switch’s state.
Rather than communicating through direct inter-process communication (IPC) or rigid APIs, SONiC’s containers interact asynchronously by publishing and subscribing to various tables within the Redis database. This loosely coupled communication model is fundamental to SONiC’s flexibility. Key databases include:
- CONFIG_DB: Stores the persistent, intended configuration of the switch.
- APPL_DB: A high-level, application-centric representation of the network state, such as routes and neighbors.
- STATE_DB: Holds the operational state of various components.
- ASIC_DB: A hardware-agnostic representation of the forwarding plane’s desired state.
The cornerstone of SONiC’s hardware independence, and the very feature that makes the VPP integration possible, is the Switch Abstraction Interface (SAI). SAI is a standardized C API that defines a vendor-agnostic way for SONiC’s software to control the underlying forwarding elements. A dedicated container, syncd, is responsible for monitoring the ASIC_DB. Upon detecting changes, making the corresponding SAI API calls to program the hardware. Each hardware vendor provides a libsai.so library that implements this API, translating the standardized calls into the specific commands required by their ASIC’s SDK. This elegant abstraction allows the entire SONiC control plane to remain blissfully unaware of the specific silicon it is running on.
VPP: The User-Space Data Plane Accelerator
While SONiC manages the high-level state of the network, VPP is singularly focused on the task of moving packets as quickly as possible. As a core component of the FD.io project, VPP is an extensible framework that provides the functionality of a router or switch entirely in software. Its remarkable performance is derived from several key architectural principles.
Vector Processing
The first and most important is vector processing. Unlike traditional scalar processing, where the CPU processes one packet at a time through the entire forwarding pipeline, VPP processes packets in batches, or “vectors”. A vector typically contains up to 256 packets. The entire vector is processed through the first stage of the pipeline, then the second, and so on. This approach has a profound impact on CPU efficiency. The first packet in the vector effectively “warms up” the CPU’s instruction cache (i-cache), loading the necessary instructions for a given task. The subsequent packets in the vector can then be processed using these cached instructions, dramatically reducing the number of expensive fetches from main memory and maximizing the benefits of modern superscalar CPU architectures.
User-Space Orientation & Kernel Bypass
The second principle is user-space operation and kernel bypass. The Linux kernel network stack, while powerful and flexible, introduces performance overheads from system calls, context switching between kernel and user space, and interrupt handling. VPP avoids this entirely by running as a user-space process. It typically leverages the Data Plane Development Kit (DPDK) to gain direct, exclusive access to network interface card (NIC) hardware. Using poll-mode drivers (PMDs), VPP continuously polls the NIC’s receive queues for new packets, eliminating the latency and overhead associated with kernel interrupts. This direct hardware access is a critical component of its high-throughput, low-latency performance profile.
Packet Processing Graph
Finally, VPP’s functionality is organized as a packet processing graph. Each feature or operation-such as an L2 MAC lookup, an IP4 route lookup, or an Access Control List (ACL) check-is implemented as a “node” in a directed graph. Packets flow from node to node as they are processed. This modular architecture makes VPP highly extensible. New networking features can be added as plugins that introduce new graph nodes or rewire the existing graph, without requiring changes to the core VPP engine.
The design of SAI was a stroke of genius, originally intended to abstract the differences between various hardware ASICs.
However, its true power is revealed in its application here. The abstraction is so well-defined, that it can be used to represent not just a physical piece of silicon, but a software process. The SONiC control plane does not know or care whether the entity on the other side of the SAI API is a Broadcom Tomahawk chip or a VPP instance running on an x86 CPU. It simply speaks the standardized language of SAI.
This demonstrates that SAI successfully abstracted away not just the implementation details of a data plane, but the very notion of it being physical, allowing a purely software-based forwarder to be substituted with remarkable elegance.
| Feature | SONiC | VPP |
| Primary Function | Control Plane & Management Plane | Data Plane |
| Architectural Model | Containerized Microservices | Packet Processing Graph |
| Key Abstraction | Switch Abstraction Interface (SAI) | Graph Nodes & Plugins |
| Operating Environment | Kernel/User-space Hybrid (Linux-based) | Pure User-space (Kernel Bypass) |
| Core Performance Mechanism | Distributed State Management via Redis | Vector Processing & CPU Cache Optimization |
| Primary Configuration Method | Declarative (config_db.json, Redis) | Imperative (startup.conf, Binary API) |
Creating a High-Performance Software Router
The integration of SONiC and VPP is a sophisticated process that transforms two independent systems into a single, cohesive software router.
The architecture hinges on SONiC’s decoupled state management and a clever translation layer that bridges the abstract world of the control plane with the concrete forwarding logic of the data plane. Tracing the lifecycle of a single route update reveals the elegance of this design.
The End-to-End Control Plane Flow
The process begins when a new route is learned by the control plane. In a typical L3 scenario, this happens via BGP.
- Route Reception: An eBGP peer sends a route update to the SONiC router. This update is received by the bgpd process, which runs within the BGP container. SONiC leverages the well-established FRRouting (FRR) suite for its routing protocols, so bgpd is the FRR BGP daemon.
- RIB Update: bgpd processes the update and passes the new route information to zebra, FRR’s core component that acts as the Routing Information Base (RIB) manager.
- Kernel and FPM Handoff: zebra performs two critical actions. First, it injects a route into the host Linux kernel’s forwarding table – via a Netlink message. Second, it sends the same route information to the fpmsyncd process using the Forwarding Plane Manager (FPM) interface, a protocol designed for pushing routing updates from a RIB manager to a forwarding plane agent.
- Publishing to Redis: The fpmsyncd process acts as the first bridge between the traditional routing world and SONiC’s database-centric architecture. It receives the route from zebra and writes it into the APPL_DB table in the Redis database. At this point, the route has been successfully onboarded into the SONiC ecosystem.
- Orchestration and Translation: The Orchestration Agent (orchagent), a key process within the Switch State Service (SWSS) container, is constantly subscribed to changes in the APPL_DB. When it sees the new route entry, it performs a crucial translation. It converts the high-level application intent (“route to prefix X via next-hop Y”) into a hardware-agnostic representation and writes this new state to the ASIC_DB table in Redis.
- Synchronization to the Data Plane: The final step in the SONiC control plane is handled by the syncd container. This process subscribes to the ASIC_DB. When it detects the new route entry created by orchagent, it knows it must program this state into the underlying forwarding plane.
This entire flow is made possible by the architectural decision to use Redis as a central, asynchronous message bus.
In a traditional, monolithic NOS, the BGP daemon might make a direct, tightly coupled function call to a forwarding plane driver. This creates brittle dependencies. SONiC’s pub/sub model, by contrast, ensures that each component is fully decoupled. The BGP container’s only responsibility is to publish routes to the APPL_DB; it has no knowledge of who will consume that information.
This allows the final consumer the data plane-to be swapped out with zero changes to any of the upstream control plane components. This decoupled architecture is what allows VPP to be substituted for a hardware ASIC so cleanly and implies that other data planes could be integrated in the future – simply by creating a new SAI implementation.
The Integration Foundation: libsaivpp.so
The handoff from syncd to the data plane is where the specific SONiC-VPP integration occurs.
In a standard SONiC deployment on a physical switch, the syncd container would be loaded with a vendor-provided shared library (e.g., libsai_broadcom.so). When syncd reads from the ASIC_DB, it calls the appropriate standardized SAI API function (e.g., sai_api_route->create_route_entry()), and the vendor library translates this into proprietary SDK calls, to program the physical ASIC.
In the SONiC-VPP architecture, this vendor library is replaced by a purpose-built shared library: libsaivpp.so. This library is the critical foundationof the entire system. It implements the full SAI API, presenting the exact same interface tosyncd as any hardware SAI library would.
However, its internal logic is completely different. When syncd calls a function like create_route_entry(), libsaivpp.so does not communicate with a hardware driver. Instead, it translates the SAI object and its attributes into a binary API message that the VPP process understands.
It then sends this message to the VPP engine, instructing it to add the corresponding entry to its software forwarding information base (FIB). This completes a “decision-to-execution” loop, bridging SONiC’s abstract control plane with VPP’s high-performance software data plane.
| Component (Container) | Key Process(es) | Role in Integration |
| BGP Container | bgpd | Receives BGP updates from external peers using the FRRouting stack. |
| SWSS Container | zebra, fpmsyncd | zebra manages the RIB. fpmsyncd receives route updates from zebra and publishes them to the Redis APPL_DB. |
| Database Container | redis-server | Acts as the central, asynchronous message bus for all SONiC components. Hosts the APPL_DB and ASIC_DB. |
| SWSS Container | orchagent | Subscribes to APPL_DB, translates application intent into a hardware-agnostic format, and publishes it to the ASIC_DB. |
| Syncd Container | syncd | Subscribes to ASIC_DB and calls the appropriate SAI API functions to program the data plane. |
| VPP Platform | libsaivpp.so | The SAI implementation for VPP. Loaded by syncd, it translates SAI API calls into VPP binary API messages. |
| VPP Process | vpp | The user-space data plane. Receives API messages from libsaivpp.so and programs its internal forwarding tables accordingly. |
In the second part of our series, we will move from architecture to action – building and testing a complete SONiC-VPP software router in a containerized lab.
We’ll configure BGP routing, verify control-to-data plane synchronization, and analyze performance benchmarks that showcase the real-world potential of this disaggregated design.
Sources
- SONiC (operating system) – Wikipedia https://en.wikipedia.org/wiki/SONiC_(operating_system)
- Broadcom https://www.broadcom.com/products/ethernet-connectivity/software/enterprise-sonic
- Vector Packet Processing Documentation – FD.io
https://docs.fd.io/vpp/21.06/ - FD.io VPP Whitepaper — Vector Packet Processing Whitepaper https://fd.io/docs/whitepapers/FDioVPPwhitepaperJuly2017.pdf
- SONiC Virtual Switch with FD.io Vector Packet Processor (VPP) on Google Cloud https://ronnievsmith.medium.com/sonic-virtual-switch-with-fd-ios-vector-packet-processor-vpp-on-google-cloud-89f9c62f5fe3
- Simplifying Multi-Cloud Networking with SONiC Virtual Gateway https://sonicfoundation.dev/simplifying-multi-cloud-networking-with-sonic-virtual-gateway/
- Deep dive into SONiC Architecture & Design – SONiC Foundation https://sonicfoundation.dev/deep-dive-into-sonic-architecture-design/
- Vector Packet Processing – Wikipedia https://en.wikipedia.org/wiki/Vector_Packet_Processing
- Kernel Bypass Networking with FD.io and VPP — Toonk.io https://toonk.io/kernel-bypass-networking-with-fd-io-and-vpp/index.html
- PANTHEON.tech*, Delivers Fast Data and Control Planes – Intel® Network Builders https://builders.intel.com/docs/networkbuilders/pantheon-tech-intel-deliver-fast-data-and-control-planes-1663788453.pdf
VPP Guide — PANTHEON.tech
https://pantheon.tech/blog-news/vpp-guide/
Kubernetes on Bare Metal for Maximum Performance
When teams consider deploying Kubernetes, one of the first questions that arises is: where should it run? The default answer is often the public cloud, thanks to its flexibility and ease of use. However, a growing number of organizations are revisiting the advantages of running Kubernetes directly on bare metal servers. For workloads that demand maximum performance, predictable latency, and direct hardware access, bare metal Kubernetes can achieve results that virtualized or cloud-hosted environments simply cannot match.
Why Bare Metal Still Matters
Virtualization and cloud abstractions have delivered convenience, but they also introduce overhead. By eliminating the virtualization layer, applications gain direct access to CPUs, memory, storage devices, and network interfaces. This architectural difference translates into tangible benefits:
- Near-Native Performance – Applications can leverage the full power of the hardware, experiencing minimal overhead from hypervisors or cloud APIs. (Cloud Native Bare Metal Report, CNCF 2023)
- Predictable Latency – A critical factor in industries such as real-time analytics, telecommunications, and financial trading, where even microseconds matter.
- Efficient Hardware Utilization – GPUs, NVMe storage, or SmartNICs can be accessed directly, without restrictions or performance bottlenecks introduced by virtualization.
- Cost Optimization – For workloads that are steady and long-term, owning and operating bare metal servers can be significantly more cost-effective than continuously paying cloud provider bills (IDC: Bare Metal Economics).
- Deep Infrastructure Control – Operators can configure firmware, tune networking, and manage storage directly, without depending on the abstractions and limitations imposed by cloud environments.
Bare metal provides power and control, but it comes with its own challenge: managing servers at scale. This is precisely where Bare Metal as a Service (BMaaS) steps in.
Bare Metal as a Service with metal-stack.io
metal-stack is an open-source platform that makes bare metal infrastructure as easy to consume as cloud resources. It provides a self-service model for physical servers, automating provisioning, networking, and lifecycle management. Essentially, it transforms racks of hardware into a cloud-like environment—while retaining the performance advantages of bare metal.
Key capabilities of metal-stack.io include:
- Automated Provisioning – Servers can be deployed with clean, reproducible operating system images, similar to how VMs are created in cloud environments.
- Integrated Networking – With BGP-based routing and compatibility with Kubernetes CNI plugins like Cilium or Calico, metal-stack ensures high-performance and secure networking. Load balancing can be handled with MetalLB.
- Multi-Tenant Support – Physical machines can be securely assigned to different teams or projects, enabling isolation and resource fairness.
- Kubernetes-Native Integration – Kubernetes clusters can be provisioned directly onto bare metal nodes via metal-ccm, Gardener, or the Cluster API Provider for Metal-Stack (CAPMS).
- Open Source Foundation – The entire stack is open source (MIT/AGPL), ensuring transparency, avoiding vendor lock-in, and allowing teams to adapt the system to their unique needs.
By using metal-stack.io, organizations don’t need to compromise between the raw speed of bare metal and the automation of cloud infrastructure—they can have both.
Building the Bare Metal Kubernetes Stack
Deploying Kubernetes on bare metal requires assembling several components into a complete ecosystem. With metal-stack at the foundation, additional layers ensure resilience, security, and operational visibility:
- Networking – Pair metal-stack’s BGP routing with a Kubernetes CNI like Cilium for low-latency, policy-driven communication.
- Storage – Tools like Rook (Ceph) or OpenEBS create distributed, high-speed storage pools that can survive node failures.
- Observability – Monitoring with Prometheus, and logging with Loki or ELK, provide the insights needed to manage both hardware and workloads effectively.
- Security – Without the isolation of virtualization, it becomes essential to enforce RBAC, Pod Security Standards, and strict network policies.
- Lifecycle Management – While metal-stack automates the server lifecycle, Kubernetes operators and GitOps tools (e.g., ArgoCD or Flux) help automate application deployment and ongoing operations.
This layered approach turns bare metal clusters into production-ready platforms capable of handling enterprise-grade workloads.
Real-World Use Cases
Bare metal Kubernetes shines in scenarios where hardware performance and low latency are non-negotiable. Some standout use cases include:
- AI/ML Training – Direct access to GPUs accelerates machine learning model training and inference workloads (NVIDIA on Bare Metal).
- Telecom & 5G Networks – Edge deployments and network functions demand ultra-low latency and predictable performance.
- Financial Services – High-frequency trading and other time-sensitive platforms benefit from microsecond-level predictability.
- Enterprise Databases – Systems like PostgreSQL or Cassandra achieve higher throughput and stability when running directly on bare metal.
In each of these cases, bare metal Kubernetes provides both the performance edge and the flexibility of modern orchestration.
Getting Started with metal-stack.io
For organizations interested in exploring this model, the path forward is straightforward:
- Explore the metal-stack.io documentation to understand the architecture and requirements.
- Start small with a handful of bare metal servers to build a test cluster.
- Use metal-stack’s Kubernetes integration to deploy a working cluster on these nodes.
- Benchmark workloads against equivalent cloud-based environments to validate performance gains.
- Scale gradually, adding automation and expanding infrastructure as the needs grow.
This incremental approach reduces risk and allows teams to build confidence before moving critical workloads.
Conclusion & Next Steps
Running Kubernetes on bare metal delivers unmatched performance, efficiency, and control—capabilities that virtualized and cloud-based environments cannot fully replicate. Thanks to open-source solutions like metal-stack.io, organizations no longer need to choose between raw power and operational simplicity. Bare Metal as a Service (BMaaS) extends the agility of the cloud to physical servers, enabling DevOps teams to manage Kubernetes clusters that are faster, more predictable, and fully under their control.
Ready to explore further?
- Contribute to metal-stack on GitHub
- Dive into the documentation
- Join the community and share your feedback
For high-performance computing, latency-sensitive applications, and hardware-intensive workloads, Kubernetes on bare metal is not just an alternative—it is often the best choice.
How to Deploy Lightweight Language Models on Embedded Linux with LiteLLM
This article was contributed by Vedrana Vidulin, Head of Responsible AI Unit at Intellias (LinkedIn).
As AI becomes central to smart devices, embedded systems, and edge computing, the ability to run language models locally — without relying on the cloud — is essential. Whether it’s for reducing latency, improving data privacy, or enabling offline functionality, local AI inference opens up new opportunities across industries. LiteLLM offers a practical solution for bringing large language models to resource-constrained devices, bridging the gap between powerful AI tools and the limitations of embedded hardware.
Deploying LiteLLM, an open source LLM gateway, on embedded Linux unlocks the ability to run lightweight AI models in resource-constrained environments. Acting as a flexible proxy server, LiteLLM provides a unified API interface that accepts OpenAI-style requests — allowing you to interact with local or remote models using a consistent developer-friendly format. This guide walks you through everything from installation to performance tuning, helping you build a reliable, lightweight AI system on embedded Linux distribution.
Setup checklist
Before you start, here’s what’s required:
- A device running a Linux-based operating system (Debian) with sufficient computational resources to handle LLM operations.
- Python 3.7 or higher installed on the device.
- Access to the internet for downloading necessary packages and models.
Step-by-Step Installation
Step 1: Install LiteLLM
First, we make sure the device is up to date and ready for installation. Then we install LiteLLM in a clean and safe environment.
Update the package lists to ensure access to the latest software versions:
| sudo apt-get update |
Check if pip (Python Package Installer) is installed:
| pip –version |
If not, install it using:
| sudo apt-get install python3-pip |
It is recommended to use a virtual environment. Check if venv is installed:
| dpkg -s python3-venv | grep “Status: install ok installed” |
If venv is intalled the output would be “Status: install ok installed”. If not installed:
| sudo apt install python3-venv -y |
Create and activate virtual environment:
| python3 -m venv litellm_envsource litellm_env/bin/activate |
Use pip to install LiteLLM along with its proxy server component:
| pip install ‘litellm[proxy]’ |
Use LiteLLM within this environment. To deactivate the virtual environment type deactivate.
Step 2: Configure LiteLLM
With LiteLLM installed, the next step is to define how it should operate. This is done through a configuration file, which specifies the language models to be used and the endpoints through which they’ll be served.
Navigate to a suitable directory and create a configuration file named config.yaml:
| mkdir ~/litellm_configcd ~/litellm_confignano config.yaml |
In config.yaml specify the models you intend to use. For example, to configure LiteLLM to interface with a model served by Ollama:
| model_list: – model_name: codegemma litellm_params: model: ollama/codegemma:2b api_base: http://localhost:11434 |
This configuration maps the model name codegemma to the codegemma:2b model served by Ollama at http://localhost:11434.
Step 3: Serve models with Ollama
To run your AI model locally, you’ll use a tool called Ollama. It’s designed specifically for hosting large language models (LLMs) directly on your device — without relying on cloud services.
To get started, install Ollama using the following command:
| curl -fsSL https://ollama.com/install.sh | sh |
This command downloads and runs the official installation script, which automatically starts the Ollama server.
Once installed, you’re ready to load the AI model you want to use. In this example, we’ll pull a compact model called codegemma:2b.
| ollama pull codegemma:2b |
After the model is downloaded, the Ollama server will begin listening for requests — ready to generate responses from your local setup.
Step 4: Launch the LiteLLM proxy server
With both the model and configuration ready, it’s time to start the LiteLLM proxy server — the component that makes your local AI model accessible to applications.
To launch the server, use the command below:
| litellm –config ~/litellm_config/config.yaml |
The proxy server will initialize and expose endpoints defined in your configuration, allowing applications to interact with the specified models through a consistent API.
Step 5: Test the deployment
Let’s confirm if everything works as expected. Write a simple Python script that sends a test request to the LiteLLM server and save it as test_script.py:
| import openai client = openai.OpenAI(api_key=“anything”, base_url=“http://localhost:4000“)response = client.chat.completions.create( model=“codegemma”, messages=[{“role”: “user”, “content”: “Write me a Python function to calculate the nth Fibonacci number.”}])print(response) |
Finally, run the script using this command:
| python3 ./test_script.py |
If the setup is correct, you’ll receive a response from the local model — confirming that LiteLLM is up and running.
Optimize LiteLLM performance on embedded devices
To ensure fast, reliable performance on embedded systems, it’s important to choose the right language model and adjust LiteLLM’s settings to match your device’s limitations.
Choosing the Right Language Model
Not every AI model is built for devices with limited resources — some are just too heavy. That’s why it’s crucial to go with compact, optimized models designed specifically for such environments:
- DistilBERT – a distilled version of BERT, retaining over 95% of BERT’s performance with 66 million parameters. It’s suitable for tasks like text classification, sentiment analysis, and named entity recognition.
- TinyBERT – with approximately 14.5 million parameters, TinyBERT is designed for mobile and edge devices, excelling in tasks such as question answering and sentiment classification.
- MobileBERT – optimized for on-device computations, MobileBERT has 25 million parameters and achieves nearly 99% of BERT’s accuracy. It’s ideal for mobile applications requiring real-time processing.
- TinyLlama – a compact model with approximately 1.1 billion parameters, TinyLlama balances capability and efficiency, making it suitable for real-time natural language processing in resource-constrained environments.
- MiniLM – a compact transformer model with approximately 33 million parameters, MiniLM is effective for tasks like semantic similarity and question answering, particularly in scenarios requiring rapid processing on limited hardware.
Selecting a model that fits your setup isn’t just about saving space — it’s about ensuring smooth performance, fast responses, and efficient use of your device’s limited resources.
Configure settings for better performance
A few small adjustments can go a long way when you’re working with limited hardware. By fine-tuning key LiteLLM settings, you can boost performance and keep things running smoothly.
Restrict the number of tokens
Shorter responses mean faster results. Limiting the maximum number of tokens in response can reduce memory and computational load. In LiteLLM, this can be achieved by setting the max_tokens parameter when making API calls. For example:
| import openai client = openai.OpenAI(api_key=“anything”, base_url=“http://localhost:4000“)response = client.chat.completions.create( model=“codegemma”, messages=[{“role”: “user”, “content”: “Write me a Python function to calculate the nth Fibonacci number.”}], max_tokens=500 # Limits the response to 500 tokens)print(response) |
Adjusting max_tokens helps keep replies concise and reduces the load on your device.
Managing simultaneous requests
If too many requests hit the server at once, even the best-optimized model can get bogged down. That’s why LiteLLM includes an option to limit how many queries it processes at the same time. For instance, you can restrict LiteLLM to handle up to 5 concurrent requests by setting max_parallel_requests as follows:
| litellm –config ~/litellm_config/config.yaml –num_requests 5 |
This setting helps distribute the load evenly and ensures your device stays stable — even during periods of high demand.
A Few More Smart Moves
Before going live with your setup, here are two additional best practices worth considering:
- Secure your setup – implement appropriate security measures, such as firewalls and authentication mechanisms, to protect the server from unauthorized access.
- Monitor performance – use LiteLLM’s logging capabilities to track usage, performance, and potential issues.
LiteLLM makes it possible to run language models locally, even on low-resource devices. By acting as a lightweight proxy with a unified API, it simplifies integration while reducing overhead. With the right setup and lightweight models, you can deploy responsive, efficient AI solutions on embedded systems — whether for a prototype or a production-ready solution.
Summary
Running LLMs on embedded devices doesn’t necessarily require heavy infrastructure or proprietary services. LiteLLM offers a streamlined, open-source solution for deploying language models with ease, flexibility, and performance — even on devices with limited resources. With the right model and configuration, you can power real-time AI features at the edge, supporting everything from smart assistants to secure local processing.
Join Our Community
We’re continuously exploring the future of tech, innovation, and digital transformation at Intellias — and we invite you to be part of the journey.
- Visit our Intellias Blog and dive deeper into industry insights, trends, and expert perspectives.
- This article was written by Vedrana Vidulin, Head of Responsible AI Unit at Intellias. Connect with Vedrana through her LinkedIn page.
Automating Compliance Management with UTMStack’s Open Source SIEM & XDR

Achieving and maintaining compliance with regulatory frameworks can be challenging for many organizations. Managing security controls manually often leads to excessive use of time and resources, leaving less available for strategic initiatives and business growth.
Standards such as CMMC, HIPAA, PCI DSS, SOC2 and GDPR demand ongoing monitoring, detailed documentation, and rigorous evidence collection. Solutions like UTMStack, an open source Security Information and Event Management (SIEM) and Extended Detection and Response (XDR) solution, streamlines this complex task by leveraging its built-in log centralization, correlation, and automated compliance evaluation capabilities. This article explores how UTMStack simplifies compliance management by automating assessments, continuous monitoring, and reporting.
Understanding Compliance Automation with UTMStack
UTMStack inherently centralizes logs from various organizational systems, placing it in an ideal position to dynamically assess compliance controls. By continuously processing real-time data, UTMStack automatically evaluates compliance with critical controls. For instance, encryption usage, implementation of two-factor authentication (2FA) and user activity auditing among many others can be evaluated automatically.
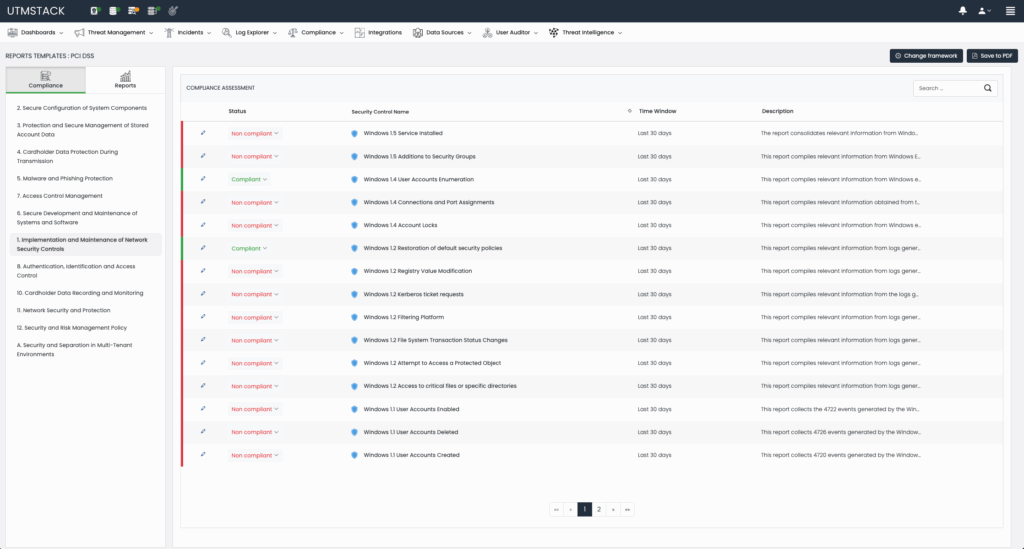
Figure 1: Automated evaluation of Compliance framework controls.
Example Compliance Control Evaluations:
- Encryption Enforcement: UTMStack continuously monitors logs to identify instances where encryption is mandatory (e.g., data in transit or at rest). It evaluates real-time compliance status by checking log events to confirm whether encryption protocols such as TLS are actively enforced and alerts administrators upon detection of potential non-compliance. The following event, for example would trigger an encryption control failure:
“message”: [{“The certificate received from the remote server was issued by an untrusted certificate authority. Because of this, none of the data contained in the certificate can be validated. The TLS connection request has failed. The attached data contains the server certificate”.}] - Two-Factor Authentication (2FA): By aggregating authentication logs, UTMStack detects whether 2FA policies are consistently enforced across the enterprise. Compliance is assessed in real-time, and automated alerts are generated if deviations occur, allowing immediate remediation. Taking Office365 as an example, the following log would confirm the use of 2FA in a given use authentication attempt:
’’authenticationDetails": [
{
"authenticationStepDateTime": "2025-04-29T08:15:45Z","authenticationMethod": "Microsoft Authenticator","authenticationMethodDetail": "Push Notification", "succeeded": true,"authenticationStepResultDetail": "MFA requirement satisfied"}’’ - User Activity Auditing: UTMStack processes comprehensive activity logs from applications and systems, enabling continuous auditing of user and devices actions. This includes monitoring privileged account usage, data access patterns, and identifying anomalous behavior indicative of compliance risks. This is a native function of UTMSatck and automatically checks the control if the required integrations are configured.
No-Code Compliance Automation Builder
One of UTMStack’s standout features is its intuitive, no-code compliance automation builder. Organizations can easily create custom compliance assessments and automated monitoring workflows tailored to their unique regulatory requirements without any programming experience. This flexibility empowers compliance teams to build bespoke compliance frameworks rapidly that update themselves and send reports on a schedule.
Figure 2: Compliance Framework Builder with drag and drop functionality.
Creating Custom Compliance Checks
UTMStack’s no-code interface allows users to:
- Define custom compliance control logic visually.
- Establish automated real-time monitoring of specific compliance conditions.
- Generate and schedule tailored compliance reports.
This approach significantly reduces the administrative overhead, enabling compliance teams to respond swiftly to evolving regulatory demands.
Unified Compliance Management and Integration
Beyond automation, UTMStack serves as a centralized compliance dashboard, where controls fulfilled externally can be manually declared compliant within the platform. This unified “pane of glass” ensures that all compliance assessments—automated and manual—are consolidated into one comprehensive view, greatly simplifying compliance audits.
Moreover, UTMStack offers robust API capabilities, facilitating easy integration with existing Governance, Risk, and Compliance (GRC) tools, allowing seamless data exchange and further enhancing compliance management.
Sample Use Case: CMMC Automation
For CMMC compliance, organizations must demonstrate rigorous data security, availability, processing integrity, confidentiality, and privacy practices. UTMStack automatically evaluates controls related to these areas by analyzing continuous log data, such as firewall configurations, user access patterns, and audit trails.
Automated reports clearly detail compliance status, including specific control numbers and levels, enabling organizations to proactively address potential issues, dramatically simplifying CMMC assessments and future audits.
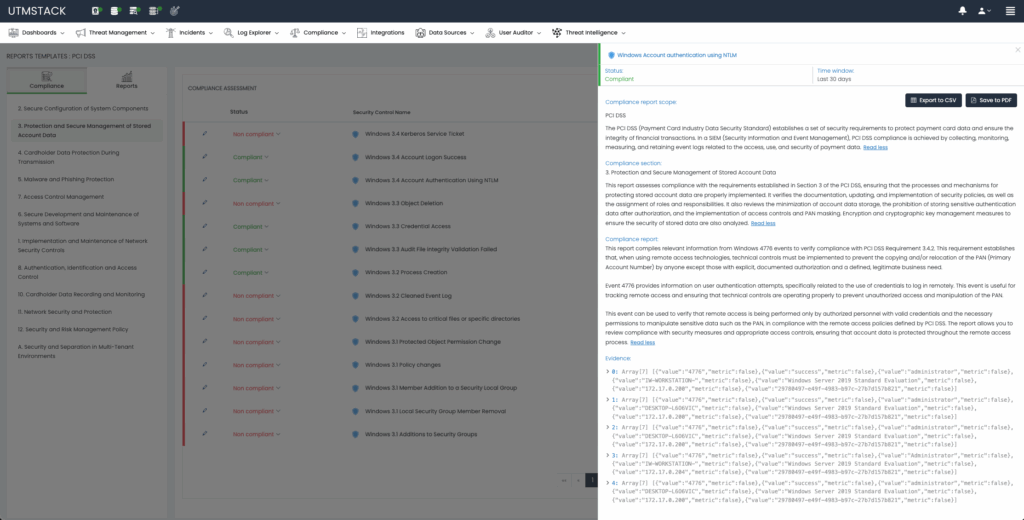
Figure 3: CMMC Compliance Control details
Compliance Control Evidence Remediation
When a framework control is identified as compliant, UTMStack automatically gathers the necessary evidence to demonstrate compliance. This evidence includes logs extracted from source systems and a dedicated, interactive dashboard for deeper exploration and analysis. Conversely, if the control evaluation identifies non-compliance, UTMStack employs an AI-driven technique known as Retrieval-Augmented Generation to provide remediation steps to security analysts and system engineers.
Compliance controls for each framework are not only evaluated but also provide dashboards for better understanding and navigation:
Figure 4: Compliance automation dashboards.
API-First Compliance Integration
UTMStack’s API-first approach enables compliance automation workflows to integrate effortlessly into existing IT ecosystems. Organizations leveraging various GRC platforms can easily synchronize compliance data, automate reporting, and centralize compliance evidence, thus minimizing manual data handling and significantly improving accuracy and efficiency.
Summary
Compliance management doesn’t have to be complicated or resource-draining. UTMStack’s open source SIEM and XDR solution simplifies and automates compliance with major standards such as CMMC, HIPAA, PCI DSS, SOC2, GDPR, and GLBA. By continuously monitoring logs, dynamically assessing compliance controls, and providing a user-friendly, no-code automation builder, UTMStack dramatically reduces complexity and enhances efficiency.
Organizations can easily customize and automate compliance workflows, maintain continuous monitoring, and integrate seamlessly with existing compliance tools, making UTMStack an invaluable resource for streamlined compliance management.
Join Our Community
We’re continuously improving UTMStack and welcome contributions from the cybersecurity and compliance community.
- GitHub Discussions: Explore our codebase, submit issues, or contribute enhancements.
- Discord Channel: Engage with other users, share ideas, and collaborate on improvements.
Your participation helps shape the future of compliance automation. Join us today!
A Simple Way to Install Talos Linux on Any Machine, with Any Provider

Talos Linux is a specialized operating system designed for running Kubernetes. First and foremost it handles full lifecycle management for Kubernetes control-plane components. On the other hand, Talos Linux focuses on security, minimizing the user’s ability to influence the system. A distinctive feature of this OS is the near-complete absence of executables, including the absence of a shell and the inability to log in via SSH. All configuration of Talos Linux is done through a Kubernetes-like API.
Talos Linux is provided as a set of pre-built images for various environments.
The standard installation method assumes you will take a prepared image for your specific cloud provider or hypervisor and create a virtual machine from it. Or go the bare metal route and load the Talos Linux image using ISO or PXE methods.
Unfortunately, this does not work when dealing with providers that offer a pre-configured server or virtual machine without letting you upload a custom image or even use an ISO for installation through KVM. In that case, your choices are limited to the distributions the cloud provider makes available.
Usually during the Talos Linux installation process, two questions need to be answered: (1) How to load and boot the Talos Linux image, and (2) How to prepare and apply the machine-config (the main configuration file for Talos Linux) to that booted image. Let’s talk about each of these steps.
Booting into Talos Linux
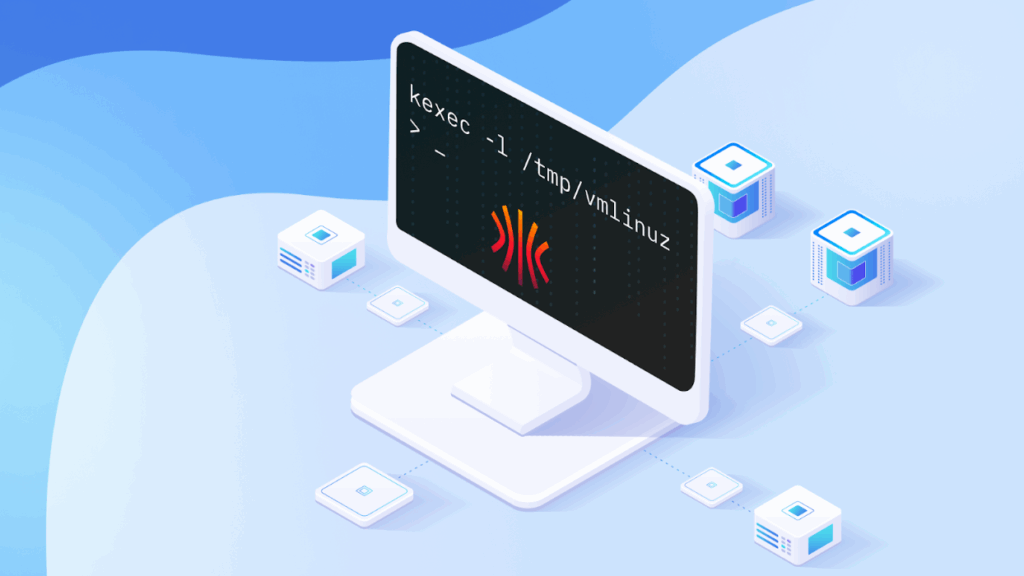
One of the most universal methods is to use a Linux kernel mechanism called kexec.
kexec is both a utility and a system call of the same name. It allows you to boot into a new kernel from the existing system without performing a physical reboot of the machine. This means you can download the required vmlinuz and initramfs for Talos Linux, and then, specify the needed kernel command line and immediately switch over to the new system. It is as if the kernel were loaded by the standard bootloader at startup, only in this case your existing Linux operating system acts as the bootloader.
Essentially, all you need is any Linux distribution. It could be a physical server running in rescue mode, or even a virtual machine with a pre-installed operating system. Let’s take a look at a case using Ubuntu on, but it can be literally any other Linux distribution.
Log in via SSH and install the kexec-tools package, it contains the kexec utility, which you’ll need later:
apt install kexec-tools -y
Next, you need to download the Talos Linux, that is the kernel and initramfs. They can be downloaded from the official repository:
wget -O /tmp/vmlinuz https://github.com/siderolabs/talos/releases/latest/download/vmlinuz-amd64
wget -O /tmp/initramfs.xz https://github.com/siderolabs/talos/releases/latest/download/initramfs-amd64.xz
If you have a physical server rather than a virtual one, you’ll need to build your own image with all the necessary firmware using Talos Factory service. Alternatively, you can use the pre-built images from the Cozystack project (a solution for building clouds we created at Ænix and transferred to CNCF Sandbox) – these images already include all required modules and firmware:
wget -O /tmp/vmlinuz https://github.com/cozystack/cozystack/releases/latest/download/kernel-amd64
wget -O /tmp/initramfs.xz https://github.com/cozystack/cozystack/releases/latest/download/initramfs-metal-amd64.xz
Now you need the network information that will be passed to Talos Linux at boot time. Below is a small script that gathers everything you need and sets environment variables:
IP=$(ip -o -4 route get 8.8.8.8 | awk -F"src " '{sub(" .*", "", $2); print $2}')
GATEWAY=$(ip -o -4 route get 8.8.8.8 | awk -F"via " '{sub(" .*", "", $2); print $2}')
ETH=$(ip -o -4 route get 8.8.8.8 | awk -F"dev " '{sub(" .*", "", $2); print $2}')
CIDR=$(ip -o -4 addr show "$ETH" | awk -F"inet $IP/" '{sub(" .*", "", $2); print $2; exit}')
NETMASK=$(echo "$CIDR" | awk '{p=$1;for(i=1;i<=4;i++){if(p>=8){o=255;p-=8}else{o=256-2^(8-p);p=0}printf(i<4?o".":o"\n")}}')
DEV=$(udevadm info -q property "/sys/class/net/$ETH" | awk -F= '$1~/ID_NET_NAME_ONBOARD/{print $2; exit} $1~/ID_NET_NAME_PATH/{v=$2} END{if(v) print v}')
You can pass these parameters via the kernel cmdline. Use ip= parameter to configure the network using the Kernel level IP configuration mechanism for this. This method lets the kernel automatically set up interfaces and assign IP addresses during boot, based on information passed through the kernel cmdline. It’s a built-in kernel feature enabled by the CONFIG_IP_PNP option. In Talos Linux, this feature is enabled by default. All you need to do is provide a properly formatted network settings in the kernel cmdline.
- You can find proper syntax for this option in the Talos Linux documentation.
- Also official Linux kernel documentation provides more detailed examples.
Set the CMDLINE variable with the ip option that contains the current system’s settings, and then print it out:
CMDLINE="init_on_alloc=1 slab_nomerge pti=on console=tty0 console=ttyS0 printk.devkmsg=on talos.platform=metal ip=${IP}::${GATEWAY}:${NETMASK}::${DEV}:::::"
echo $CMDLINE
The output should look something like:
init_on_alloc=1 slab_nomerge pti=on console=tty0 console=ttyS0 printk.devkmsg=on talos.platform=metal ip=10.0.0.131::10.0.0.1:255.255.255.0::eno2np0:::::
Verify that everything looks correct, then load our new kernel:
kexec -l /tmp/vmlinuz --initrd=/tmp/initramfs.xz --command-line="$CMDLINE"
kexec -e
The first command loads the Talos kernel into RAM, the second command switches the current system to this new kernel.
As a result, you’ll get a running instance of Talos Linux with networking configured. However it’s currently running entirely in RAM, so if the server reboots, the system will return to its original state (by loading the OS from the hard drive, e.g., Ubuntu).
Applying machine-config and installing Talos Linux on disk
To install Talos Linux persistently on the disk and replace the current OS, you need to apply a machine-config specifying the disk to install. To configure the machine, you can use either the official talosctl utility or the Talm, utility maintained by the Cozystack project (Talm works with vanilla Talos Linux as well).
First, let’s consider configuration using talosctl. Before applying the config, ensure it includes network settings for your node; otherwise, after reboot, the node won’t configure networking. During installation, the bootloader is written to disk and does not contain the ip option for kernel autoconfiguration.
Here’s an example of a config patch containing the necessary values:
# node1.yaml
machine:
  install:
    disk: /dev/sda
  network:
    hostname: node1
    nameservers:
    - 1.1.1.1
    - 8.8.8.8
    interfaces:
    - interface: eno2np0
      addresses:
      - 10.0.0.131/24
      routes:
      - network: 0.0.0.0/0
        gateway: 10.0.0.1
You can use it to generate a full machine-config:
talosctl gen secrets
talosctl gen config --with-secrets=secrets.yaml --config-patch-control-plane=@node1.yaml <cluster-name> <cluster-endpoint>
Review the resulting config and apply it to the node:
talosctl apply -f controlplane.yaml -e 10.0.0.131 -n 10.0.0.131 -i
Once you apply controlplane.yaml, the node will install Talos on the /dev/sda disk, overwriting the existing OS, and then reboot.
All you need now is to run the bootstrap command to initialize the etcd cluster:
talosctl --talosconfig=talosconfig bootstrap -e 10.0.0.131 -n 10.0.0.131
You can view the node’s status at any time using dashboard commnad:
talosctl --talosconfig=talosconfig dashboard -e 10.0.0.131 -n 10.0.0.131
As soon as all services reach the Ready state, retrieve the kubeconfig and you’ll be able to use your newly installed Kubernetes:
talosctl --talosconfig=talosconfig kubeconfig kubeconfig
export KUBECONFIG=${PWD}/kubeconfig
Use Talm for configuration management
When you have a lot of configs, you’ll want a convenient way to manage them. This is especially useful with bare-metal nodes, where each node may have different disks, interfaces and specific network settings. As a result, you might need to hold a patch for each node.
To solve this, we developed Talm — a configuration manager for Talos Linux that works similarly to Helm.
The concept is straightforward: you have a common config template with lookup functions, and when you generate a configuration for a specific node, Talm dynamically queries the Talos API and substitutes values into the final config.
Talm includes almost all of the features of talosctl, adding a few extras. It can generate configurations from Helm-like templates, and remember the node and endpoint parameters for each node in the resulting file, so you don’t have to specify these parameters every time you work with a node.
Let me show how to perform the same steps to install Talos Linux using Talm:
First, initialize a configuration for a new cluster:
mkdir talos
cd talos
talm init
Adjust values for your cluster in values.yaml:
endpoint: "https://10.0.0.131:6443"
podSubnets:
- 10.244.0.0/16
serviceSubnets:
- 10.96.0.0/16
advertisedSubnets:
- 10.0.0.0/24
Generate a config for your node:
talm template -t templates/controlplane.yaml -e 10.0.0.131 -n 10.0.0.131 > nodes/node1.yaml
The resulting output will look something like:
# talm: nodes=["10.0.0.131"], endpoints=["10.0.0.131"], templates=["templates/controlplane.yaml"]
# THIS FILE IS AUTOGENERATED. PREFER TEMPLATE EDITS OVER MANUAL ONES.
machine:
  type: controlplane
  kubelet:
    nodeIP:
      validSubnets:
        - 10.0.0.0/24
  network:
    hostname: node1
    # -- Discovered interfaces:
    # eno2np0:
    #   hardwareAddr:a0:36:bc:cb:eb:98
    #   busPath: 0000:05:00.0
    #   driver: igc
    #   vendor: Intel Corporation
    #   product: Ethernet Controller I225-LM)
    interfaces:
      - interface: eno2np0
        addresses:
          - 10.0.0.131/24
        routes:
          - network: 0.0.0.0/0
            gateway: 10.0.0.1
    nameservers:
      - 1.1.1.1
      - 8.8.8.8
  install:
    # -- Discovered disks:
    # /dev/sda:
    #    model: SAMSUNG MZQL21T9HCJR-00A07
    #    serial: S64GNG0X444695
    #    wwid: eui.36344730584446950025384700000001
    #    size: 1.9 TB
    disk: /dev/sda
cluster:
  controlPlane:
    endpoint: https://10.0.0.131:6443
  clusterName: talos
  network:
    serviceSubnets:
      - 10.96.0.0/16
  etcd:
    advertisedSubnets:
      - 10.0.0.0/24
All that remains is to apply it to your node:
talm apply -f nodes/node1.yaml -i
Talm automatically detects the node address and endpoint from the “modeline” (a conditional comment at the top of the file) and applies the config.
You can also run other commands in the same way without specifying node address and endpoint options. Here are a few examples:
View the node status using the built-in dashboard command:
talm dashboard -f nodes/node1.yaml
Bootstrap etcd cluster on node1:
talm bootstrap -f nodes/node1.yaml
Save the kubeconfig to your current directory:
talm kubeconfig kubeconfig -f nodes/node1.yaml
Unlike the official talosctl utility, the generated configs do not contain secrets, allowing them to be stored in git without additional encryption. The secrets are stored at the root of your project and only in these files: secrets.yaml, talosconfig, and kubeconfig.
Summary
That’s our complete scheme for installing Talos Linux in nearly any situation. Here’s a quick recap:
- Use kexec to run Talos Linux on any existing system.
- Make sure the new kernel has the correct network settings, by collecting them from the current system and passing via the ip parameter in the cmdline. This lets you connect to the newly booted system via the API.
- When the kernel is booted via kexec, Talos Linux runs entirely in RAM. To install Talos on disk, apply your configuration using either talosctl or Talm.
- When applying the config, don’t forget to specify network settings for your node, because on-disk bootloader configuration doesn’t automatically have them.
- Enjoy your newly installed and fully operational Talos Linux.
Additional materials:
- How we built a dynamic Kubernetes API Server for the API Aggregation Layer in Cozystack
- DIY: Create Your Own Cloud with Kubernetes
- Cozystack Becomes a CNCF Sandbox Project
- Journey to Stable Infrastructures with Talos Linux & Cozystack | Andrei Kvapil | SREday London 2024
- Talos Linux: You don’t need an operating system, you only need Kubernetes / Andrei Kvapil
- Comparing GitOps: Argo CD vs Flux CD, with Andrei Kvapil | KubeFM
- Cozystack on Talos Linux