In this article I will show you how to install and use the KDE flow chart tool Kivio.
Recently you might have read my article “Create flow charts with Dia,” which introduced you to the world of the Dia diagramming tool. For those readers that are appose to the GIMP-like interface of Dia and are looking for an interface more closely resembling that of Microsoft Visio, you’re in luck. Included with the KDE KOffice toolset is a flow chart/diagramming tool called Kivio that allows you to create impressive flow charts and has an interface that many users will find more user-friendly than that of Dia. But no matter your preference, both tools do an outstanding job of creating flow charts – they just approach the task a bit differently.
Installation
I will give a word of warning here. If you are currently using an alpha or beta version of Ubuntu 10.4 you will not find Kivio in any of your repositories. In order to use Kivio, be using a version <= 9.10 of Ubuntu (or a different distribution all together). That being said, let’s install Kivio on Ubuntu 9.10.
You can install Kivio from either a GUI tool or from command line. If you open up the Synaptic package management tool you can follow these simple steps:
- Open Synaptic.
- Search for “kivio” (no quotes).
- Select Kivio for installation.
- Click Apply to install.
- That’s it.
If, however, you prefer to install from command line, you can install Kivio with this simple command:
sudo apt-get install kivio
With either method, you will most likely have to install a few dependencies (the amount dictated by your current installation).
Once installed you will find Kivio located in Applications > Office (in both GNOME and KDE).
Using Kivio
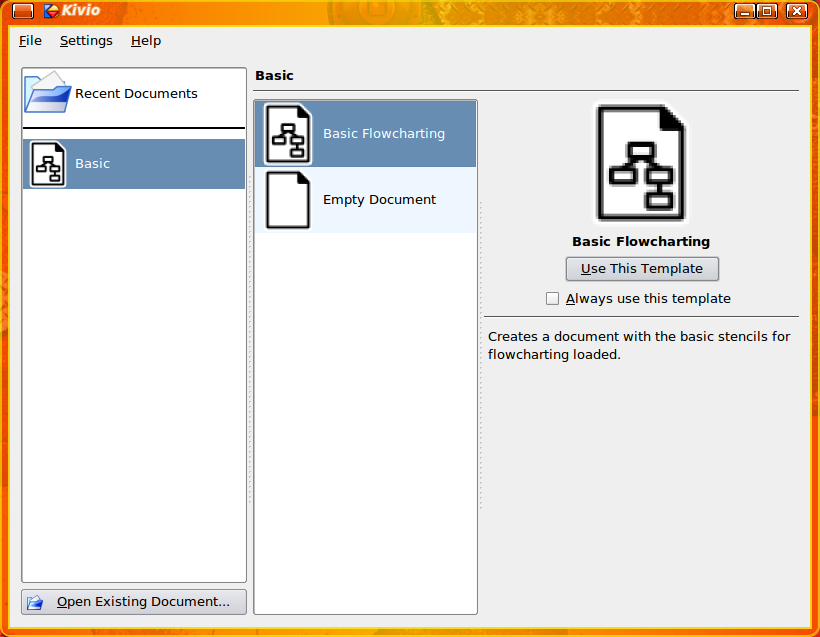
 When you first fire up Kivio (see Figure 1), you can choose from either creating a new document (either a basic flowchart or an empty document) or you can open any Recent document (created within Kivio). What you will want to start out with is a basic flowchart. To do this, click the Use This Template button in the far right pane. That will fire up Kivio ready to start creating flowcharts.
What I would like to do is to create a flow chart for a network diagram. Only problem is that, out of the box, Kivio doesn’t include stencils for network diagrams. So let’s first install a new stencil.
You can purchase professional-quality stencils from a company called theKompany. Or you can download the free stencil collection HERE. To install these new stencils, follow these directions:
- Open a terminal and change to the directory housing the newly downloaded stencils.
- Unpack the stencils with the command tar xvfz FILENAME.tar.gz
- Change into the newly created stencils directory.
- Move the contents of the stencils directory with the command sudo mv * /usr/share/apps/kivio/stencils/
- Restart Kivio
Now you will have plenty of stencils to do the work you need to do. Let’s create a network diagram.
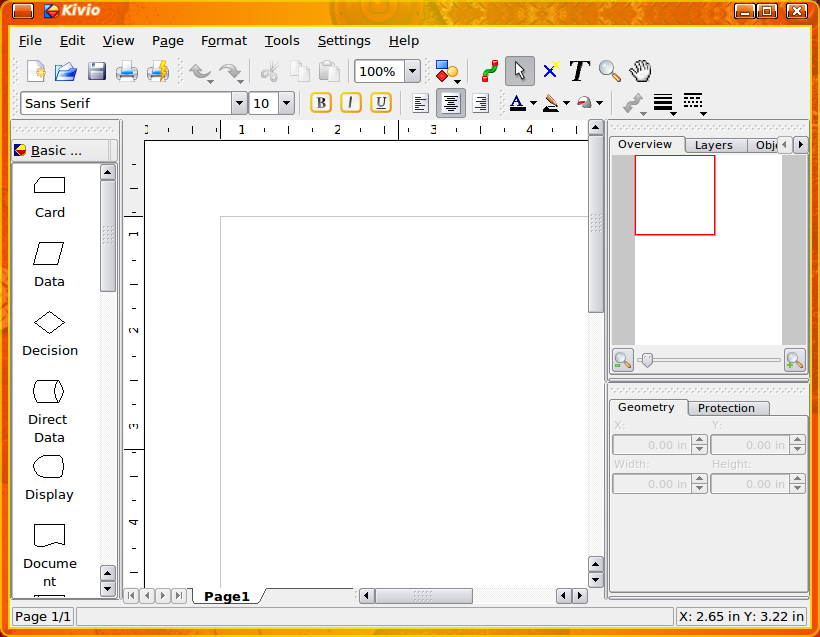
 To begin, open Kivio and then click the Use This Template button. When the Kivio Main Window opens (see Figure 2) the first thing you will want to do is click Tools > Add Stencil Set > Networking > Basic Network. When you do this, you will notice the stencils in the far left pane will change to represent basic networking hardware, connections, etc. Now you are ready to create a flowchart for a network.
NOTE: You might find other networking stencils work better for your task. Just check through the newly added stencils to find the right one.
Let’s start out by adding a router to our network. To do this scroll through the stencils until you find the Router stencil. Click on that stencil and then click in the main work pane (middle pane). Click and drag the cursor until the stencil is the right size for your chart. Don’t worry, you can always resize later. But what if you want to label that router? Simple. Click the Text tool (the T icon) and use that to add text for your router.
Let’s add a server to our chart. To do this you will follow the same steps as you did for adding the router, only you will select the appropriate server stencil from the left pane. Add associated text as well.
There are two ways to connect these two elements. You can connect them the standard Kivio way, which will connect them with either a straight line or a poly line, or you can connect them using a stencil from the Network collection. Most likely you will want to use a stencil for this connection, since this flow chart is about a network. For example’s sake, let’s illustrate both methods.
Standard Line Connection
 To connect two elements with a standard line follow these steps:
1. Click on Tools > Straight Connector.
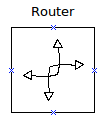
2. Select one of the connecting points on the first element (see figure 3) which are indicated by the “X.”
3. Click and drag your cursor to a connecting point in the second element.
4. The elements should now be connected.
What is nice about this method is that no matter where you drag those elements, they will remain connected.
Stencil Connector
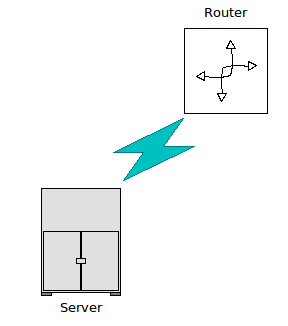
 Adding a stencil connector (from the Network collection) allows you to add a more traditional network flowchart connector. To add this you simply go through the process of adding yet another element (as you did above to add the router or server) and then size and place the connecting element where you need it (see Figure 4).
Got through this process until you have your entire network diagram created. You will find (in the stencil pack you added earlier) plenty of stencils that should help you through the creation of just about any type of network. When you are complete you can save as a standard Kivio document or you can export as:
- Uncompressed XML file.
- PNG image.
- JPG image.
- BMP image.
Unfortunately you can not export or save in Microsoft Visio format.
And that is the basics for creating impressive flow charts with Kivio. It’s as simple as it seems and will allow you to create professional looking flow charts and diagrams.


