
You can learn an amazing amount of information about your network connections with these three glorious Linux networking commands. iftop tracks network connections by process number, Nethogs quickly reveals what is hogging your bandwidth, and vnstat runs as a nice lightweight daemon to record your usage over time.
iftop
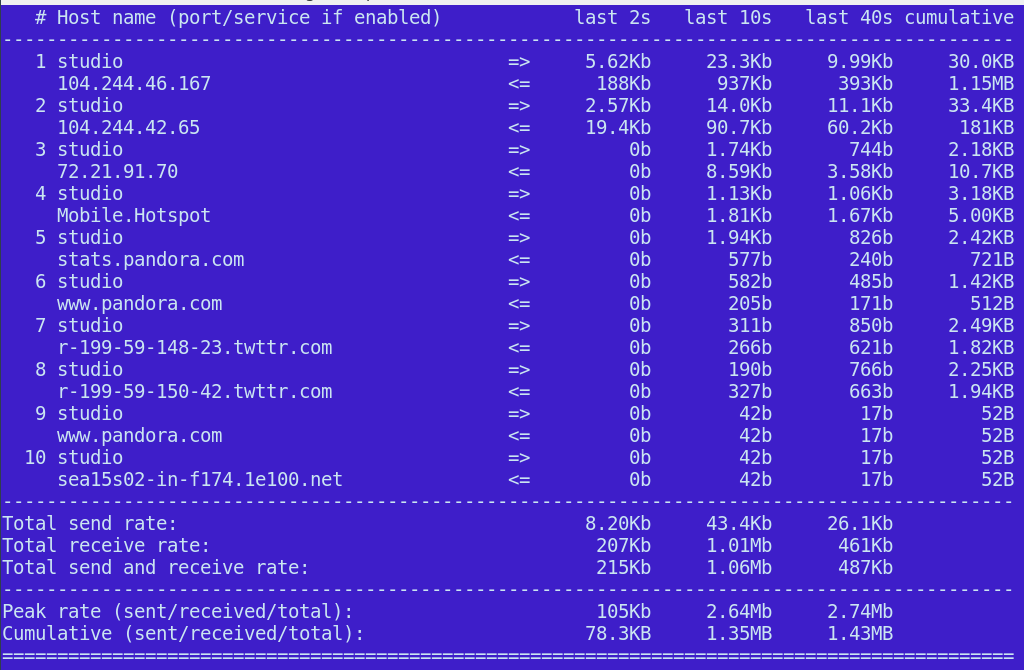
The excellent iftop listens to the network interface that you specify, and displays connections in a top-style interface.
This is a great little tool for quickly identifying hogs, measuring speed, and also to maintain a running total of your network traffic. It is rather surprising to see how much bandwidth we use, especially for us old people who remember the days of telephone land lines, modems, screaming kilobits of speed, and real live bauds. We abandoned bauds a long time ago in favor of bit rates. Baud measures signal changes, which sometimes were the same as bit rates, but mostly not.
If you have just one network interface, run iftop with no options. iftop requires root permissions:
$ sudo iftop
When you have more than one, specify the interface you want to monitor:
$ sudo iftop -i wlan0
Just like top, you can change the display options while it is running.
- h toggles the help screen.
- n toggles name resolution.
- s toggles source host display, and d toggles the destination hosts.
- s toggles port numbers.
- N toggles port resolution; to see all port numbers toggle resolution off.
- t toggles the text interface. The default display requires ncurses. I think the text display is more readable and better-organized (Figure 1).
- p pauses the display.
- q quits the program.
When you toggle the display options, iftop continues to measure all traffic. You can also select a single host to monitor. You need the host’s IP address and netmask. I was curious how much of a load Pandora put on my sad little meager bandwidth cap, so first I used dig to find their IP address:
$ dig A pandora.com
[...]
;; ANSWER SECTION:
pandora.com.            267     IN      A       208.85.40.20
pandora.com.            267     IN      A       208.85.40.50
What’s the netmask? ipcalc tells us:
$ ipcalc -b 208.85.40.20
Address:   208.85.40.20
Netmask:   255.255.255.0 = 24
Wildcard:  0.0.0.255
=>
Network:   208.85.40.0/24
Now feed the address and netmask to iftop:
$ sudo iftop -F 208.85.40.20/24 -i wlan0
Is that not seriously groovy? I was surprised to learn that Pandora is easy on my precious bits, using around 500Kb per hour. And, like most streaming services, Pandora’s traffic comes in spurts and relies on caching to smooth out the lumps and bumps.
You can do the same with IPv6 addresses, using the -G option. Consult the fine man page to learn the rest of iftop’s features, including customizing your default options with a personal configuration file, and applying custom filters (see PCAP-FILTER for a filter reference).
Nethogs
When you want to quickly learn who is sucking up your bandwidth, Nethogs is fast and easy. Run it as root and specify the interface to listen on. It displays the hoggy application and the process number, so that you may kill it if you so desire:
$ sudo nethogs wlan0

NetHogs version 0.8.1

PID USER   PROGRAM              DEV    SENT   RECEIVED
7690 carla /usr/lib/firefox     wlan0 12.494 556.580 KB/sec
5648 carla .../chromium-browser wlan0  0.052   0.038 KB/sec
TOTAL                                 12.546 556.618 KB/sec
Nethogs has few options: cycling between kb/s, kb, b, and mb, sorting by received or sent packets, and adjusting the delay between refreshes. See man nethogs, or run nethogs -h.
vnstat
vnstat is the easiest network data collector to use. It is lightweight and does not need root permissions. It runs as a daemon and records your network statistics over time. The vnstat command displays the accumulated data:
$ vnstat -i wlan0
Database updated: Tue Oct 17 08:36:38 2017

   wlan0 since 10/17/2017

          rx:  45.27 MiB      tx:  3.77 MiB      total:  49.04 MiB

   monthly
                     rx      |     tx      |    total    |   avg. rate
     ------------------------+-------------+-------------+---------------
       Oct '17     45.27 MiB |    3.77 MiB |   49.04 MiB |    0.28 kbit/s
     ------------------------+-------------+-------------+---------------
     estimated        85 MiB |       5 MiB |      90 MiB |

   daily
                     rx      |     tx      |    total    |   avg. rate
     ------------------------+-------------+-------------+---------------
         today     45.27 MiB |    3.77 MiB |   49.04 MiB |   12.96 kbit/s
     ------------------------+-------------+-------------+---------------
     estimated       125 MiB |       8 MiB |     133 MiB |
By default it displays all network interfaces. Use the -i option to select a single interface. Merge the data of multiple interfaces this way:
$ vnstat -i wlan0+eth0+eth1
You can filter the display in several ways:
- -h displays statistics by hours.
- -d displays statistics by days.
- -w and -m displays statistics by weeks and months.
- Watch live updates with the -l option.
This command deletes the database for wlan1 and stops watching it:
$ vnstat -i wlan1 --delete
This command creates an alias for a network interface. This example uses one of the weird interface names from Ubuntu 16.04:
$ vnstat -u -i enp0s25 --nick eth0
By default vnstat monitors eth0. You can change this in /etc/vnstat.conf, or create your own personal configuration file in your home directory. See man vnstat for a complete reference.
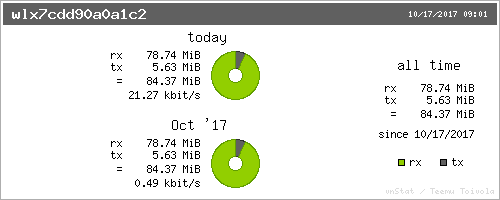
You can also install vnstati to create simple, colored graphs (Figure 2):
$ vnstati -s -i wlx7cdd90a0a1c2 -o vnstat.png
See man vnstati for complete options.
Learn more about Linux through the free “Introduction to Linux” course from The Linux Foundation and edX.


