Author: Ben Martin
GSmartControl presents your hard drive SMART (Self-Monitoring, Analysis, and Reporting Technology) health information in a graphical display. With GSmartControl you no longer have to fish around in /dev/disk/by-id to find the drive you’re interested in and then inspect the output of smartctl trying to figure out which SMART attributes have values that you should care about.
GSmartControl is not in the standard Fedora, openSUSE, or Ubuntu repositories. There are 1-click installs available on the openSUSE Build Service for both openSUSE 11 and Fedora 9. I built GSmartControl 0.8.0rc3 from source on a 64-bit Fedora 9 machine using the normal ./configure && make && sudo make install commands.
GSmartControl is written using the C++ API for GTK+2 (gtkmm24). To talk to your hard drives, GSmartControl uses the smartmontools command-line utility, and for parsing SMART information it uses the PCRE regular expression library.
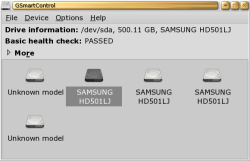
GSmartControl looks at all your drives and presents a window similar to that shown in the screenshot below. The two Unknown model icons shown in the screenshot correspond with a RAID device and a USB flash disk. If you do not wish to see these Unknown models you can specify that you want to show SMART-compatible devices only in the General section of the preferences.
In the Drives tab of the preferences, you can blacklist certain devices so that GSmartControl will not scan them at all, and set special parameters for smartctl for specific devices. For example, if you have an old hard disk on /dev/sda, you can supply special smartctl parameters for GSmartControl to use for just that device.
The device menu lets you manually add a device to those that GSmartControl has detected, rescan for devices, and load smartctl output as a new virtual device. This latter option might be useful if you want to compare older smartctl output against the current values for the drive. The device menu also lets you enable SMART for a drive and turn on automatic offline data collection.
The two main options in the device menu are also available in the context menu for a device — the View Details and Perform Tests menu options. Each of these options opens the same new window, but Perform Tests opens a tab to let you start a Short or Extended Self-test of the drive. Double-clicking on a drive icon in the main window also brings up the same window the View Details menu option does.
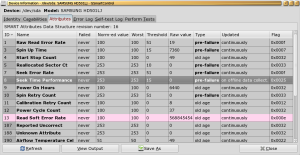
Using the smartctl tool from smartmontools directly from the terminal can be daunting for casual users. Moreover, once you work out which hard drive you are interested in and obtain the details with smartctl, you often have to look up what each attribute means and how to interpret the current values. Although GSmartControl presents these same attributes in a grid, it includes tooltips for many of the attributes, allowing you to work out what they are telling you without having to search the documentation. Also, when you should pay attention to a particular attribute, GSmartControl will highlight its row with a different background color. For example, in this report for a Samsung 500GB drive, notice that the Read Soft Error Rate row has a pink highlight to inform you that it has an abnormal value. In this case, the Raw value being reported is ridiculously high, and the other two Samsung drives of identical model in the same machine have similar Raw values for Read Soft Error Rate.
The Identity tab from the above screenshot lets you see the model, serial number, and firmware of the drive as well as whether SMART is enabled on the drive and the overall health assessment. The Capabilities tab lets you see which SMART features are supported by your drive and see additional information about these features, such as how long the Short and Extended self-test will take.
The Error Log and Self-test Log tabs let you see the errors and Extended self-test information. The Perform Tests tab lets you initiate a Short or Extended self-test on the drive. When you execute these tests you’ll see a progress meter in the tab, letting you see how far through the test is and what the estimated time of completion is. I found that for the Short self-test the estimated completion time jumped around a bit. When the test completion moved from 10 to 20% the estimated completion time was reset to the initial value of two minutes. You are free to view other tabs in the Device information window while the self-test is being performed.
Unfortunately, some of the data reported by SMART can have different meanings for different drives. I have found strange unrealistically high values reported for some attributes by some drives. These vendor differences make building a consistent user interface much more complicated.
GSmartControl makes investigating SMART information on a Linux machine simpler for casual users. Being able to see all the devices in the main window and search for one of them by manufacturer and model number is a much simpler task for casual users than digging around in /dev/disk/by-id as the root user. The row highlighting in the Device information window helps you notice the things that might be an issue. The attribute tooltips are a great help when GSmartControl has flagged an attribute that you are not normally interested in.
Categories:
- Tools & Utilities
- System Administration


