
Author: Shashank Sharma
Installing Graphviz is a breeze, especially if you are running a Debian-based distribution. Just run apt-get install graphviz. You can also download RPM or source files to set it up.
Graphviz comprises a collection of tools you can use to create graphics with lines or arrows between objects. Graphviz calls these undirected and directed graphics, respectively. One of these tools is dot, which accepts input in the C-like dot language. Dot is highly customizable, allowing you to control line colors, arrow heads, node shapes, and other items in your graphic.
Let’s use Graphviz to print out a simple “Hello world!” The easiest way to do this is to use a text editor and write a dot-script:
graph hello
{
       Node1 [label="Hello, World!"]
}
The first word, graph, tells dot that the following lines contain a description of the graphic to be drawn. A graphic can have as many nodes as you like, each with a separate label. A label is used to write the text you want to appear in your node. Save this file as hello.dot. The command dot hello.dot -Tpng >hello.png generates the graphic. The -T switch tells dot the file format for the output. In this case, we tell dot to generate the output as .png and name it hello.png.
You can also create a directed graphic from the command line without using a text editor to create the dot file:
echo "digraph Hello {Hello->World!}" | dot -Tpng >hello.png
digraph tells dot to create a directed graphic. The above command creates two nodes with values “hello” and “world.” If you want to create an undirectional graphic, simply remove the letters “di” from digraph.
A-grade graphics
I wouldn’t give an A-grade to the graphic we have made so far. For an A, a graphic must have colors and be a bit more complex. Graphviz can get you there.
Let’s begin by drawing a four-member family hierarchy:
digraph family
{
	ElderSon [label="Elder Son"]
	YoungerSon [label="Younger Son"]

	PizzaHut [label="Pizza Hut"]
	McDonalds [label="McDonald's"]

  	Food -> PizzaHut
       	Food -> McDonalds
       	Father -> PizzaHut
       	Mom -> McDonalds
       	ElderSon -> McDonalds
	YoungerSon -> McDonalds
	Father -> Mom -> ElderSon -> YoungerSon

}
For dot to create our graphics, we don’t need to explicitly define our nodes. Writing the node relations is enough. This graphic tells us two things: 1) the chain of command at home and their eating preferences, and 2) three people in a four family house prefer McDonald’s over Pizza Hut.
When describing node relations, dot does not allow us to use blank spaces or apostrophes unless you describe the nodes first, as we have done above.
But this still still doesn’t get an A because it lacks color. Let’s try this instead:
digraph family1
{
       	Father [shape=Msquare, color=blue]
       	Mother [shape=box, style=filled, color=pink, height=0.7]
       	ElderSon [label="Elder Son", style=filled, color=green, width=1.5]
       	YoungerSon [label="Younger Son", shape=egg, color=Turquoise]

	PizzaHut [label="Pizza Hut"]
	McDonalds [label="McDonald's"]

	Food -> PizzaHut
       	Food -> McDonalds
       	YoungerSon -> McDonalds
       	Father -> PizzaHut
       	Mother -> McDonalds
       	ElderSon -> McDonalds

	edge [color = red]; /* denotes the family hierarchy */
       	Father -> Mother -> ElderSon -> YoungerSon
}
Here, we describe the attributes of all the nodes of the graphic before writing node relations. In addition to colors and shapes, you can also control a node’s width and height. edge refers to the line connecting nodes.
We use a separate color to mark the members of the family. The edge attribute above does not apply to all node-relations. It is valid only for relations written after it in the dot script.
As you can see, dot itself rearranges the elements of our graphic to maintain clarity.
Even better graphics
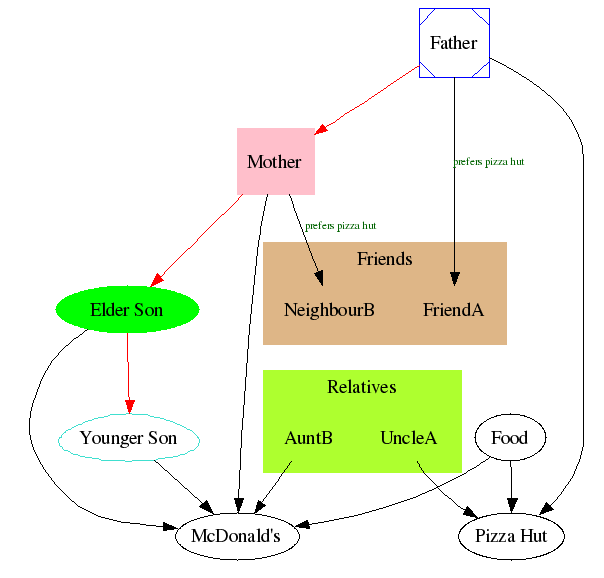
| Click to enlarge |
Wait, there’s more! Let’s enter the details of some relatives and friends and see how we can make them stand out.
digraph family2
{
       	Father [shape=Msquare, color=blue]
       	Mother [shape=box, style=filled, color=pink, height=0.7]
      	ElderSon [label="Elder Son", style=filled, color=green, width=1.5]
       	YoungerSon [label="Younger Son", shape=egg, color=Turquoise]

	PizzaHut [label="Pizza Hut"]
	McDonalds [label="McDonald's"]

        subgraph cluster_relatives /*to describe entire group as single entity*/
        {
               	style = filled; /* defines the entire group */
                color = greenyellow
               	label = "Relatives"

               	UncleA [shape=plaintext]
               	AuntB [shape=plaintext]
       	}

       	Food -> PizzaHut
       	Food -> McDonalds
       	YoungerSon -> McDonalds
      	Father -> PizzaHut
       	Mother -> McDonalds
       	ElderSon -> McDonalds

       	UncleA -> PizzaHut
       	AuntB -> McDonalds

       	subgraph cluster_friends
       	{
               	style = filled; /* defines the entire group */
               	color = burlywood
               	label = "Friends"

               	FriendA [shape=plaintext]
               	NeighbourB [shape=plaintext]
       	}

       	Father -> FriendA [label="prefers pizza hut", fontcolor=darkgreen, fontsize=8]
       	Mother -> NeighbourB [label="prefers pizza hut", fontcolor=darkgreen, fontsize=8]

       	edge [color = red]; /* denotes the family hierarchy */
       	Father -> Mother -> ElderSon -> YoungerSon
}
The subgraph cluster elements are the new additions in this graphic. cluster means that the attributes apply to all elements of the subgraphic. Each node can still have its own unique attributes. Also, note the placement of the subgraphic clusters. You must always define a subgraphic cluster before describing relations of any of its elements.
Another new thing we see in this graphic is edge labels. See how “prefers pizza hut” appear next to the lines connecting Father-to-FriendA and Mother-to-NeighbourB. There are two ways to describe edge properties. You can write the properties in the same line as the relation, as we have done above, or you can describe a new edge.
edge [label="prefers pizza hut", fontcolor = darkgreen, fontsize=8]
Father -> FriendA
Mother -> NeighbourB
Read the fine dot guide (in PDF) if you have your eye on an A+ grade. Although Graphviz comes with a GUI, dotty, I find it far more efficient to use the command line to create my graphics.
Shashank Sharma is studying for a degree in computer science. He specializes in writing about free and open source software for new users.


