
Author: Mark Alexander Bain
About three years ago we had a look at how Gambas speeds database development. Now that Gambas 2.0 is being prepared for release, it’s time to see what the new version can do now. One cool feature is its ability to create a chart.
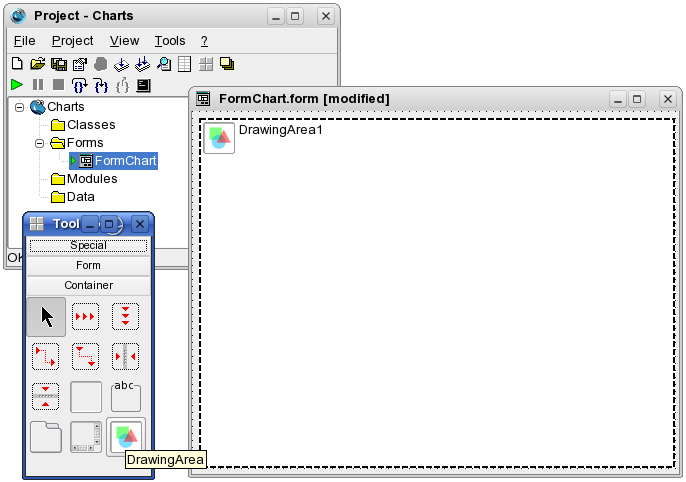
Begin by downloading an up-to-date version of Gambas. Follow the the installation instructions, and start Gambas by typing gambas2 on the command line. Create a new form and insert a DrawingArea object; it’s one of the new objects for Gambas 2.0, and you can find it in the Container section of the Gambas toolbox.
Click here to see the new Gambas development GUI.
You have to set some of the properties of the DrawingArea object; right-click on the object and select Properties, or press the F4 key. Set Cached to True; if you don’t, the object will remain blank when you create your chart. You may also want to set the background of the chart to an appropriate color. The Background section in the Properties form lets you select a color on either the System tab (which gives you access to a set of colors defined by Gambas) or the Free tab (which enables you to create your own custom color).
Now you’re ready to create a chart. Double-click on your new form to access the code editor and create your first subroutine. Gambas will automatically create the Form_Open subroutine for you:
PUBLIC SUB Form_Open()
draw_chart()
END

SUB draw_chart()
END
You’ll need to start with some code to initialize the DrawingArea object:
DrawingArea1.Clear
draw.Begin(DrawingArea1)
And once you’ve sent all of your instructions to the object you’ll need to end your drawing session:
draw.End
So let’s look at a complete subroutine that will draw X and Y axes for a chart:
SUB draw_chart()
'Define the variables that we'll need
DIM origin_x AS Integer
DIM origin_y AS Integer
DIM max_x AS Integer
DIM max_y AS Integer
DIM x_string AS String
DIM y_string AS String

'Initialize the DrawingArea object
DrawingArea1.Clear
draw.Begin(DrawingArea1)

'Set the text that we're going to use for the axis titles
x_string = "Value"
y_string = "Date"

'Define the origin for the chart
origin_x = Len(x_string) * 10
origin_y = DrawingArea1.ClientHeight - 30

'Define the length or each axis
max_x = DrawingArea1.Width
max_y = DrawingArea1.Height * -1

'Draw each axis
draw.Line(origin_x, origin_y, max_x, origin_y)
draw.Line(origin_x, origin_y, origin_x, max_y)

'Finish with the DrawingArea object
draw.End
END
If you now run your project you’ll see a horizontal and a vertical line drawn on the screen. Add code to add a title to each axis before the draw.End statement):
draw.Text(x_string, 0, origin_y + max_y * 0.90)
draw.Text(y_string, max_x * 0.90, origin_y + 10)
The data that we’re going to display will be extracted from a financial information database. One suitable data source is Yahoo! Finance. We can use its data to populate a MySQL database with historical data on Novell’s stock price, for example:
/*Start of file*/
drop database if exists gambas_data;
/*Create the database*/
create database if not exists gambas_data;
/*Create the data structure*/
create table if not exists gambas_data.company_details (
id int auto_increment,
name varchar(50),
code varchar(10),
primary key (id)
);
create table if not exists gambas_data.company_history (
id int auto_increment,
company_id int,
value float,
date date,
primary key (id)
);
/*Create user accounts*/
GRANT select,insert,delete,update ON gambas_data.*
TO bainm@localhost IDENTIFIED BY 'mypassword';
/*Load default data*/
insert into gambas_data.company_details (name, code) values ('Novell', 'NOVL');
insert into gambas_data.company_history (company_id, date, value) values (1,'07/10/01',7.65);
insert into gambas_data.company_history (company_id, date, value) values (1,'07/10/02',7.72);
insert into gambas_data.company_history (company_id, date, value) values (1,'07/10/03',7.57);
insert into gambas_data.company_history (company_id, date, value) values (1,'07/10/04',7.67);
insert into gambas_data.company_history (company_id, date, value) values (1,'07/10/05',7.66);
insert into gambas_data.company_history (company_id, date, value) values (1,'07/10/08',7.79);
insert into gambas_data.company_history (company_id, date, value) values (1,'07/10/09',7.93);
insert into gambas_data.company_history (company_id, date, value) values (1,'07/10/10',8.06);
insert into gambas_data.company_history (company_id, date, value) values (1,'07/10/11',7.86);
insert into gambas_data.company_history (company_id, date, value) values (1,'07/10/12',7.89);
insert into gambas_data.company_history (company_id, date, value) values (1,'07/10/15',7.88);
insert into gambas_data.company_history (company_id, date, value) values (1,'07/10/16',7.86);
insert into gambas_data.company_history (company_id, date, value) values (1,'07/10/17',7.85);
insert into gambas_data.company_history (company_id, date, value) values (1,'07/10/18',7.82);
insert into gambas_data.company_history (company_id, date, value) values (1,'07/10/19',7.6);
insert into gambas_data.company_history (company_id, date, value) values (1,'07/10/22',7.65);
insert into gambas_data.company_history (company_id, date, value) values (1,'07/10/23',7.62);
insert into gambas_data.company_history (company_id, date, value) values (1,'07/10/24',7.53);
insert into gambas_data.company_history (company_id, date, value) values (1,'07/10/25',7.51);
insert into gambas_data.company_history (company_id, date, value) values (1,'07/10/26',7.5);
/*End of file*/
Before you can use the data you need to add gb.db as a component to your application — click on Project -> Properties -> Components — and connect to the database:
PRIVATE conn AS NEW Connection
PRIVATE FUNCTION make_connection() AS Boolean
WITH conn
.Type = "mysql"
.Host = "localhost"
.Login = "bainm"
.Password = "mypassword"
.Name = "gambas_data"
END WITH
TRY conn.Open
IF ERROR THEN
Message("Cannot Open Database. Error = " & Error.Text)
RETURN FALSE
END IF
RETURN TRUE
END
Now you need to change the Form_Open subroutine to make use of the new connection:
PUBLIC SUB Form_Open()
IF make_connection() = TRUE THEN
 draw_chart()
END IF
END
Here we’ve amended the subroutine so that the application will create the chart only if a connection can first be made to the database. The application will return a message box to tell users that an error has occurred if the connection can’t be made.
Once everything is working correctly, you can extract information using a SQL statement that you send to the database:
DIM sql AS String
DIM res AS Result

sql = " select date,value from company_history"
res = conn.Exec(sql)
You can make use of the Result in your program:
FOR EACH res
    'process your results here.
 NEXT
We want to use the results to draw a chart, but we first have to work out the divisions for each axis. The x-axis divisions will depend on the number of items that you display; the y-axis divisions depend on the maximum value you extract from the database:
sql = "select max(value) as max_val from company_history"
res = conn.Exec(sql)
max_val = res!max_val
y_interval = 0.90 * origin_y / max_val

sql = " select date,value from company_history"
res = conn.Exec(sql)
x_interval = Int(0.85 * max_x / res.Count)
For readability purposes we’re using only 90% of the height of the y-axis, and 85% of the width of the x-axis. Now you can create a bar chart:
FOR EACH res
   x_pos = x_pos + x_interval
   y_pos = origin_y - res!value * y_interval
   draw.LineWidth = 0.90 * x_interval
   draw.ForeColor = color.red
   draw.Line(origin_x + x_pos, origin_y, origin_x + x_pos, y_pos)
NEXT
LineWidth and ForeColor enable you to define how wide and what color a line should be. The graph should now look like the accompanying figure.
We still need to add a scale to each axis. The y-axis is straightforward enough:
draw.ForeColor = color.black
draw.Text(Round(max_val, -2), 0, origin_y - max_val * y_interval)
Don’t add so much information that you overwrite the labels you’re adding, particularly on the x-axis. You can print every nth label; in this example we print every 4th label:
x_pos = 0
y_miss = 0
FOR EACH res
    x_pos = x_pos + x_interval
    y_miss = y_miss + 1
    SELECT CASE y_miss
     CASE 1
      draw.ForeColor = color.black
      draw.Text(res!date, origin_x + x_pos, origin_y)
     CASE 4
      y_miss = 0
    END SELECT
NEXT
The end result is an attractive bar chart:

Gambas can create a line chart as easily as a bar chart. The only difference is that instead of drawing a line from the x-axis to the data point, you need to draw a line from the last coordinate to the current one:
draw.LineWidth = 1
draw.ForeColor = color.black
y_last = origin_y
x_pos = origin_x
FOR EACH res
  y_pos = origin_y - res!value * y_interval
  x_pos = x_pos + x_interval
  IF (x_pos - x_interval) > origin_x THEN
   draw.Line(x_pos - x_interval, y_last, x_pos, y_pos)
  END IF
  y_last = y_pos
NEXT
You could do even more; for example, you could:
- add a combo box to allow chart creators to select different data to be displayed
- add radio buttons to change between line and bar charts
- add a title
- use different colors to show data for more than one data set
Using multiple datasets
The next logical step is to consider multiple data sets — for instance, to display the stock prices of more than one company, say comparing Novell with Microsoft. The fist task is to modify the draw_chart subroutine so that it can accept an array of company symbols:
SUB draw_chart(company_symbols AS String[])
Next we need to amend Form_Load to send the correct data to draw_chart:
PUBLIC SUB Form_Open()
IF make_connection() = TRUE THEN
draw_chart(Array("NOVL", "MSFT"))
END IF
END
We need to update the SQL we’re sending to the database to find the maximum stock value for all of the companies that we’re interested in, in order to calculate the unit size for the Y-axis:
sql = "select max(value) as max_val from company_history where" &
" company_id in (select id from company_details where " &
" code in ( '" & company_symbols.Join("','") & "'))"
If you’re unsure about the SQL, use the Print method to output the SQL statement to the Gambas console window: PRINT (sql). When you run the application, you’ll get output like:
select max(value) as max_val from company_history
where company_id in (select id from company_details where code in ( 'NOVL','MSFT'))
You can then copy this and test it directly on your database to make sure that you’re getting the results you’re expecting.
Now remove (or comment out) the code for creating the bar chart, and enclose the line chart code in a FOR EACH loop in order to repeat the line drawing operation for each company:
FOR EACH symbol IN company_symbols
'All of our code for displaying the line chart for the relevant company
NEXT
And change the SQL for obtaining the company data:
sql = "select date,value from company_history where" &
" company_id in (select id from company_details where " &
" code = '" & symbol & "')"
If you run your application now then you’ll see a couple of lines, one for each company; however, there’s nothing to tell you which is which. You can add some color coding with a little SELECT CASE statement that will progressively change the color of the line each time that the application goes through the loop:
SELECT CASE chart_color
CASE color.black
chart_color = color.red
CASE color.red
chart_color = color.green
CASE color.green
chart_color = color.yellow
CASE ELSE
chart_color = color.black
END SELECT

draw.ForeColor = chart_color
You will, of course, need to place that code within the FOR EACH loop just before you draw the line for the company. To finish things off, you can print the symbol for the company in the appropriate color:
IF x_pos = origin_x THEN
draw.Text(symbol, 0, y_pos)
END IF
This IF statement ensures that the symbol is only output once at the start of each loop. The code itself needs to be placed just after the point that the new x and y positions have been calculated. The end result is a simple chart comparing the stock prices of the selected companies:

However you like your data displayed, you can quickly and easily add a chart to your Gambas 2.0 application.
I’ve combined the code for both the simple and more advanced charts into a single Gambas 2.0 project that’s available from my site.
Categories:
- Graphics & Multimedia
- Databases


