
Nowadays, embedded devices are cheap, and there are many options with really good specifications. Five years ago, for example, it was unimaginable to find a quad-core board for less than $30. But, although the embedded hardware market continues growing, from the software perspective, several challenges still remain.
In Internet of Things (IoT) environments, where devices interact with each other, connectivity is a requirement that exists to serve to a major purpose: data transfer. In some cases, this data contains certain instructions that aim to invoke remote functions in peer devices, or to provide information coming from sensors, services, and metrics within others. Because the data usually comes from different sources, it will likely come in different formats, so collecting this information requires special handling. A common approach is through the implementation of a unified logging layer; remember that logging is no longer restricted to data in a file, but instead to a stream of data.
When this data is collected, it’s very useful to store it in simple databases or a third-party services. If we aim to perform real-time queries, it would be great to insert these records into an Elasticsearch instance or similar solution. Because we are dealing with restricted environments, not all tools available are suitable to help with this task.
This article introduces a specialized tool for embedded Linux (and general IoT environments) that is built to solve the common problems associated with data collection, unification, and delivery: Fluent Bit.
Fluent Bit
Fluent Bit is an open source data collection tool originally developed for embedded Linux. It aims to solve all problems associated with data, from collection to distribution. It’s built in C and provides the following features:
-
Small core
-
Input/Output plugins
-
Event driven (async I/O network operations)
-
Internal data serialization with MsgPack
-
Built-in metrics
-
SSL/TLS support
Fluent Bit can deal with data collection in different modes, and it can listen over the network (locally or remote), collecting predefined metrics from the running system or simply being used as a library by any program that desires to flush data to databases or third-party services.
For Fluent Bit, every source of data is handled through an input plugin, and targets for delivery are handled by the output plugins. The following table describe the options available for collection and delivery:
|
Name |
Type |
Description |
|
cpu |
input |
collect metrics of CPU usage, in global mode and per core. |
|
mem |
input |
calculate memory status: total vs. available. |
|
kmsg |
input |
read log messages directly from the Kernel Log Buffer. |
|
xbee |
input |
receive messages from a connected XBee device. |
|
serial |
input |
get messages from the serial interface. |
|
stdin |
input |
read messages from the standard input. |
|
mqtt |
input |
listen for MQTT messages over TCP (it behaves as an MQTT server). |
|
es |
output |
flush records into an Elasticsearch server. |
|
fluentd |
output |
flush records to a Fluentd data collector/aggregator instance. |
|
td |
output |
flush records to Treasure Data cloud service (Big Data). |
|
stdout |
output |
flush records to the standard output (debugging purposes). |
Getting Started
For demonstration purposes, I will show a very basic, hands-on example of how to collect some CPU metrics from a Linux embedded device (e.g., Raspberry Pi or a generic Linux host) and insert these records into an Elasticsearch service. Finally, I will show some visualization using Kibana.
Install Fluent Bit
I will assume that you have a Raspberry Pi device running Raspbian; otherwise, a normal Linux host with Debian or Ubuntu is fine. Before you install the packages for your distribution, make sure to install the APT key to your system:
$ wget -qO - http://apt.fluentbit.io/fluentbit.key | sudo apt-key add -
Now, depending of your specific distribution, add the correct repository entry to your packages lists.
Raspberry Pi/Raspbian 8 (Jessie):
$ sudo su -c "echo deb http://apt.fluentbit.io/raspbian jessie main >> /etc/apt/sources.list"
Debian 8 (Jessie):
$ sudo su -c "echo deb http://apt.fluentbit.io/debian jessie main >> /etc/apt/sources.list"
Ubuntu 15.10 (Wily Werewolf):
$ sudo su -c "echo deb http://apt.fluentbit.io/ubuntu wily main >> /etc/apt/sources.list"
Finally, please update your local repository and install Fluent Bit:
$ sudo apt-get update
$ sudo apt-get install fluentbit
Install Elasticsearch and Kibana
The following steps give you some hints on how to install the Elasticsearch and Kibana components, Note that the steps mentioned here are just a reference, and I encourage you double-check the links posted. Let’s start with Elasticsearch:
-
Get the latest version from https://www.elastic.co/downloads/elasticsearch.
-
Follow the install instructions for the package chosen.
Once installed, make sure the following curl test command gets some results as expected:
$ curl -X GET http://localhost:9200/
{
  "name" : "Shiver Man",
  "cluster_name" : "elasticsearch",
  "version" : {
    "number" : "2.1.1",
    "build_hash" : "40e2c53a6b6c2972b3d13846e450e66f4375bd71",
    "build_timestamp" : "2015-12-15T13:05:55Z",
    "build_snapshot" : false,
    "lucene_version" : "5.3.1"
  },
  "tagline" : "You Know, for Search"
}
At this point, Elasticsearch is up and running, so we can proceed to install Kibana (data visualization tool):
-
Get the latest version from https://www.elastic.co/downloads/kibana.
-
After unpacking the tarball downloaded, in a separate terminal, run the service as specified in the above link.
If the Kibana service is running, you can access the dashboard through the address http://127.0.0.1:5601, you should get content similar to this:
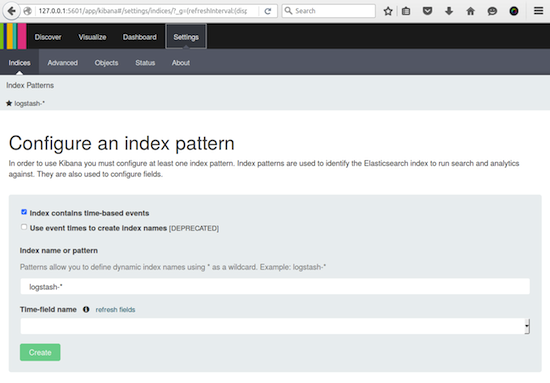 In the following section, I will show an example of how to collect some CPU metrics with Fluent Bit and start inserting records into Elasticsearch.
Fluent Bit/CPU Metrics
Now that all our components are in place, we can start getting metrics from the board or host where Fluent Bit has been installed. As mentioned previously, Fluent Bit needs to know which input and output plugins it should use. These can be specified from the command line, for example:
$ fluent-bit -i INPUT -o OUTPUT
For this use case, we will gather CPU usage metrics using the cpu input plugin and flush the data out to an Elasticsearch instance through the es plugin. In addition to its name, it also requires some extra parameters: hostname (or IP), TCP port, index, and type:
$ fluent-bit -i cpu -o es://HOSTNAME:TCP_PORT/INDEX/TYPE
Ideally, you will be running Fluent Bit from your Raspberry Pi. Make sure to use the right hostname or IP address to reach the Elasticsearch server in your network; otherwise, you can use the loopback address 127.0.0.1 if all components are in the same machine.
Assuming that our Elasticsearch server is located on the TCP address 192.168.1.15, we will start inserting CPU metrics with the following command:
$ fluent-bit -i cpu -o es://192.168.1.15:9200/fluentbit/cpu -V
The -V argument prints verbose messages. Leave that terminal running as the tool will collect metrics every second and flush them to the Elasticsearch server every five seconds.
Visualization with Kibana
While Fluent Bit inserts records into Elasticsearch, we will prepare Kibana to visualize the information. Execute the following commands from the host where Elasticsearch and Kibana running:
$ wget http://fluentbit.io/kibana/fluentbit.mapping.json
$ wget http://fluentbit.io/kibana/fluentbit.cpu.json
Now, to create the default mapping for Fluent Bit and it CPU data, do:
$ curl -XPUThttp://localhost:9200/fluentbit -d @fluentbit.mapping.json
Again, open your Kibana dashboard through the address http://127.0.0.1:5601, go to Settings from the top menu and prepare to Configure an index pattern as shown below: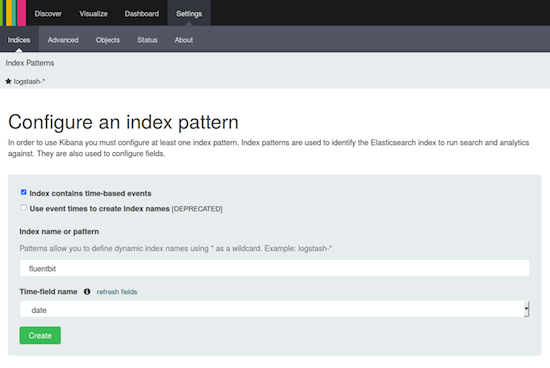 Note that Index contains time-based events must be checked, the index name is fluentbit, and the time-field name is auto-filled with date. Then, click on the Create button.
Visualization Object
The next and final step is to load the predefined Visualization object. Go to Settings and click the Objects option, then click on the Import button and choose the fluentbit.cpu.json file recently downloaded.
Now navigate to the Dashboard top menu, click on the + button, and choose the new Fluent Bit – CPU visualization object. Once added, it will start showing the CPU metrics as shown: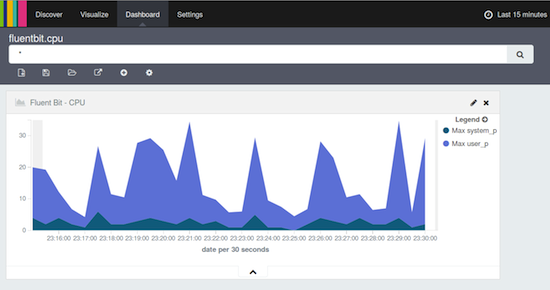
The above graphic displays how much CPU the system has spent on Kernel and User space, respectively.
More about Fluent Bit
In this article, I have demonstrated just a small fraction of the capacity of Fluent Bit. If you are writing some custom C programs for embedded Linux, you can use it as an agnostic logging library, and it will take care of data packaging and routing. If you care about security, TLS can be enabled on all networking plugins without effort.
Feel free to check the source code in our github.com/fluent/fluent-bit repository, where you will find more resources for packaging, examples, unit test cases, and recipes for Yocto Project. You can also learn more in the official documentation.
Thousands of users in a daily basis collect billions of records with Fluentd, and now Treasure Data is taking this experience to the world of embedded Linux and IoT with FluentBit.
Community Announcement![]()
Fluent Bit is part of the Fluentd project ecosystem, and we will be participating at the Scale14x event. Join us at our session on Saturday, Jan. 23 or just come to say hi at our Fluent booth. If you are an active user of these tools, ping us on @fluentbit, as we will have free stickers and t-shirts!
 Eduardo Silva is a principal Open Source developer at Treasure Data Inc. It currently leads the efforts to make logging ecosystem more friendly between Embedded and Cloud Services. He also directs the Monkey Project organization which is behind the Open Source projects Monkey HTTP Server and Duda I/O.


