
Author: Mayank Sharma
You can find several applications that assist Web developers in creating and debugging projects. Dr. Tarique Sani, CTO of SANIsoft and co-author of Professional PHP 4 Programming, cites the DOM Inspector, Venkman JavaScript Debugger, LiveHTTPHeaders, and some tools of the Web Developer toolbar. “Before Firebug we had to make do with this mishmash of tools,” Sani says. “Firebug makes life much simpler by giving all the required tools in one easy-to-use interface.”
Once you download the Firebug extension, Firefox will automatically install it. To activate it, click on its icon in the right corner of the Firefox status bar. Once activated, Firebug can be used to analyze every Web page you visit, but this behavior is customizable.
If you have multiple tabs open on your browser, Firebug will invoke a separate session for each tab. This means you can edit multiple Web pages with Firebug in the same Web browser. By default, clicking on the Firebug icon will bring up the Firebug console in a small panel at the bottom of the page. If you have a big monitor, you can also open Firebug in a separate window.
Easy to navigate code and hack CSS
Firebug has a simple tabbed layout that shows different components and characteristics of a page, such as HTML, CSS, JavaScript, DOM, and network activity.
Firebug presents code in a tree view. If you are looking for a particular element in the code, use the search bar that highlights results in the code as you type. Once you’ve selected an element in the code, Firebug will show you the CSS styles that apply to it in particular and the styles that have been borrowed from the body. You can disable any style characteristic with a single click, and the page will be automatically updated. The Layout tab helps you position elements, visually guiding you with rulers and guidelines.
Firebug also gets you the value of a CSS property in a snap. Move the mouse over HTML color tags to get a patch showing the color, or move over an image link to preview the image with its dimensions.
The arrow keys will help you cycle between all possible CSS properties for a particular element, which is useful if you are new to CSS. Firebug also has a list of standard CSS keywords that autocomplete to help you insert elements as you type.
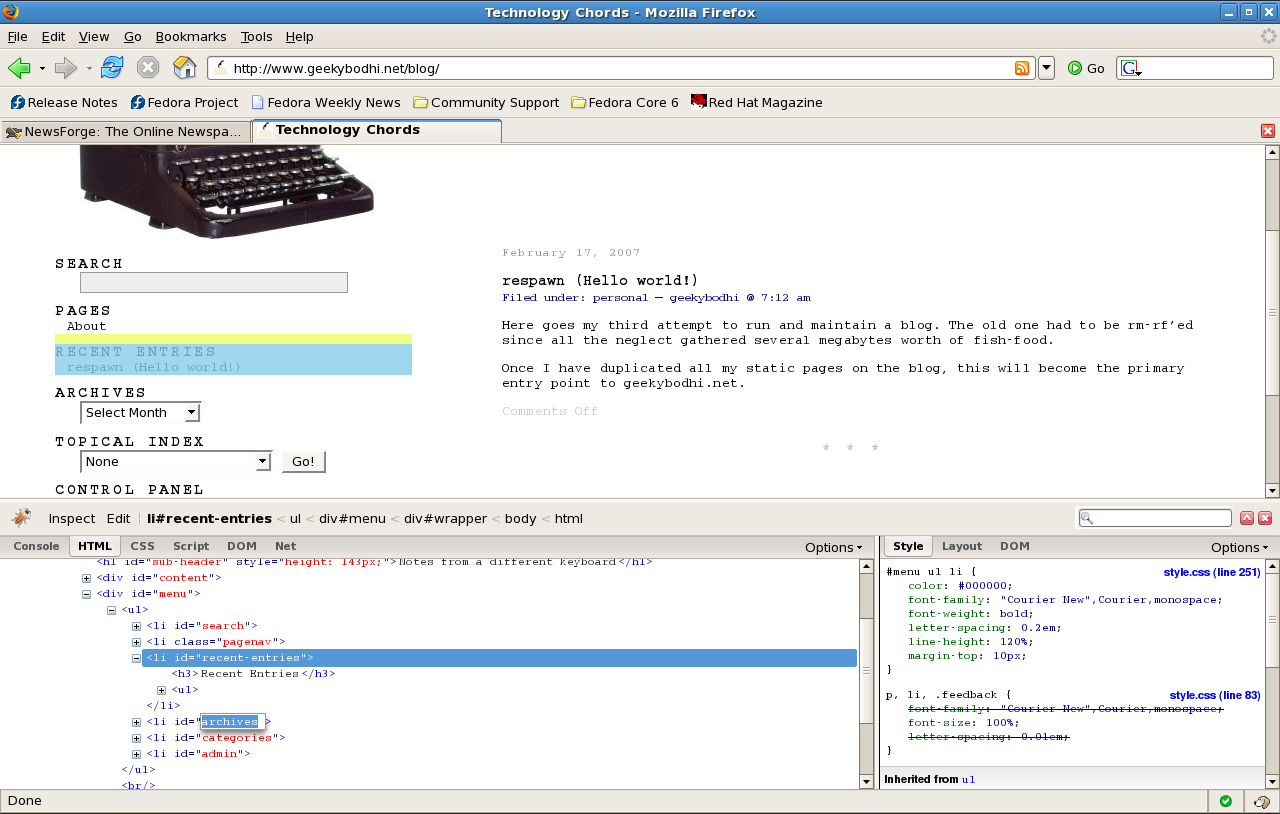
| Click to enlarge |
If you run a blog but don’t dabble in HTML or CSS every day, customizing a theme for your pages can be daunting. With Firebug, just load the default theme, click the Inspect button, and move your mouse over the page. Firebug will automatically jump to the HTML code that generates the section of the page the cursor is over. In the code, depending on what type of element you point to, its border, margin, and padding are all highlighted on the page. For example, as shown in the figure, when I move the mouse over the recent entries list item (<li id=”recent-entries”>), Firebug highlights the part of the page that this piece of HTML controls. In the style panel, on the right, Firebug also displays the CSS style that applies to the list item.
Inspect and debug invisible AJAX traffic
Apart from being a handy visual reference to editing CSS, Firebug is also capable of working on complex Web pages that employ AJAX. The XMLHttpRequest (XHR) object is an important part of AJAX applications like Gmail. It’s used to fetch data from the Web server to update the page. If the “Show XMLHttpRequests” option is enabled, the Console tab shows every XHR request, which can be expanded to reveal header information along with the response received from the server.
There’s also the Net tab, which gives a real-time view of the file being loaded in the page, be it HTML, CSS, JavaScript, Flash, or images. This is also a nice place to check and optimize the time it takes to load a page, since you can preview the elements being requested along with their size and the sequence in which they are loaded.
Firebug also includes a JavaScript profiler that gives detailed reports on every function. It can be toggled manually or from the JavaScript by marking a function for auto-profiling. It keeps track of when a function was called and what parameters were passed to it.
Firebug allows you to set break points to pause JavaScript execution on any line. You can set break points indiscriminately, by clicking on a particular line, or set conditional break points that pause execution only if certain conditions are true. You can then step forward line by line to analyze how the state of the program changes in real time.
If you want to test a function, just paste it in the command line. Firebug can also take a segment of code and crunch it together in one line, which can help people create bookmarklets.
Conclusion
Firebug can benefit both professional and occasional Web developers. Its biggest advantage is the fact that almost everything in Firebug is a hyperlink. For example, anywhere you see a function, such as in the Profiler, you can click on it to go to its place in the source code, or click on an HTML element to see its style.
Firebug is popular with professional Web developers, many of whom have been using it since its early beta days. Although Firebug’s design is intuitive, a little documentation that shows where everything is and what a particular button does can go a long way with non-professional, hobbyist Web developers.
Category:
- Web Development


