Author: James F. Koopmann
Over time, organizations replicate, migrate, or add complexity within database systems, often times losing control of the quality of their data. When applications begin to fail because of invalid, corrupted, or out-of-date data, the free, GPL-licensed Talend Open Profiler can give data analysts, database administrators (DBA), and business users the ability to research data structures and improve data quality. Through the use of Open Profiler, users can be alerted to hidden inconsistencies and incompatibilities between data sources and target applications. Through data analysis, business users and technical analysts can communicate both data structure and content needs.
Open Profiler offers functions for both technical and business users. It can quickly build statistics that reflects the usability of the information within a database table. As it finds corrupt or inconsistent data, it can scrub bad information from database structures. Additionally, Open Profiler simplifies the repetitive nature of statistical analysis while reducing labor costs and errors.
Getting familiar with Open Profiler
I found it easy to use Open Profiler to find the information needed to perform an analysis of columns. For only a few items did I find myself looking at documentation, and unfortunately was unable to find specifics on how certain aspects fit together. For instance, a metadata repository is supposed to keep a history of profiles, but nowhere did I find how this works.
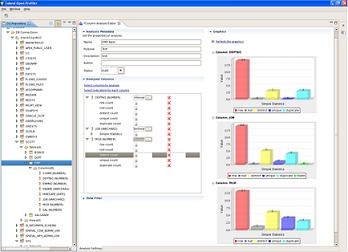
Data profiling with Open Profiler is easy and is accomplished within a few simple steps. Talend provides executables for Windows, Solaris, Mac OS X, Linux, and AIX. Since I was using Linux I invoked TalendOpenProfiler-linux-gtk-x86 from the command prompt. When the application loads it displays a three-column panel. The left column shows a simple tree structure that allows you to explore and select past data profiling runs and drill down into database connections. The middle work panel is where you build, through selection of databases and objects, the analysis work for a data profiling run. The right help panel provides wizards for defining database connections and analysis runs.
To get started, the first thing you need to do is create a connection to a database by traversing the tree structure in the left panel from Metadata -> DB Connections. Right-click on DB Connections and click on “Create a new connection” to bring up a connection definition screen. Here you can enter the standard connection information for your database. For Oracle, for instance, you must enter in a login, password, hostname, port, and system ID (SID). Once you enter the DB Connection information, Open Profiler allows you to begin drilling down the tree structure, depending on your privileged access to the database. You can traverse through owners, tables, columns, attributes, and views for the specified database connection.
Once you’ve made a database connection you can being analyzing data in tables, which is the main purpose of this tool. As you traverse the tree structure you find the table you want to analyze, expand the tables columns, then highlight the columns to include for analysis. Right-click on them to bring up the option to analyze, then the Create New Analysis screen. Here you define the type of statistics to run on your selected columns by selecting indicators for each column, which will enable you to choose the type of statistics to use (Simple, Text, Summary, or Advanced). You can then run the analysis. For assistance in these steps, Talend provides the Open Profiler Getting Started Guide, which walks you through these steps and gives you an understanding of the options involved. I wish this manual went a bit more in depth, but it will get you started quickly.
I tested Talend Open Profiler on a CentOS 5 system configured with Java version 1.6.0_06, Perl v5.8.8, and an Oracle 11g database. The download and installation process was quick and easy; from download to GUI took about 10 minutes.
In my testing, the refresh rate could have been a bit better. I noticed some table, view, and column counts that did not seem to be updated until I traversed out and then back into the tree structure. And I’d like to see Talend add support for database connections besides Oracle and MySQL.
Data analysts, DBAs, and business professionals constantly investigate the validity of data. Usually the investigation requires not only a specialized skill set but also a highly paid technical professional or expensive tool set. Talend Open Profiler effectively brings the data closer to business users through a common interface with analysts and DBAs.
Categories:
- Reviews
- Tools & Utilities
- Databases


