Author: Ben Martin
Squid Graph is a Perl script that takes your Squid proxy server access.log file and generates a Web page showing you statistics about your proxy accesses and transfers, including the number of cache hits and the percentage of requests that were served by the cache alone. With Squid Graph you can see how well tweaks to your Squid configuration are working.
There are many ways to keep an eye on how well a Squid cache is performing, such as setting up Squid to offer Simple Network Management Protocol (SNMP) and using the Multi Router Traffic Grapher (MRTG) or Cacti to monitor Squid through SNMP. Using Squid Graph as described in this article has the advantage of being quick and easy to set up — you don’t have to know about SNMP or install any other servers. The downside to this is that some of the things you might be interested in investigating will require some command-line interaction instead of using nice Web forms.
You’ll need Perl and perl-GD installed to use Squid Graph. Installation of Squid Graph is optional; if you like you can copy its directory into /usr/local, or simply invoke it with the command ./squid-graph.
Squid Graph requires two things to run: the contents of your Squid access.log file and a directory name where you want a Web page detailing graphical information from log to be written. If you do not have an access.log file, edit your squid.conf file as shown below to have one created and updated.
# vi /etc/squid/squid.conf
...
access_log /var/log/squid/access.log squid
...
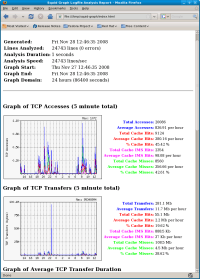
The below command will show statistics of your Squid server for the last 24 hours. Loading the index.html file from /tmp/squid-graph should show an analysis similar to the screenshot below.
$ mkdir -p /tmp/squid-graph $ ./squid-graph --output-dir=/tmp/squid-graphLooking at the statistics on the right of the screenshot, you can see that on a per-request basis the Squid cache is working reasonably well, servicing about 45% of the requests from the cache. The statistics for TCP transfers show that only about 20% of the traffic can be served from the cache, so perhaps the configuration should be changed to allow caching of larger files. The blue spike in total transfers at slightly after 22:00 hours on the TCP transfers graph hints that there might be some files in that time frame that could not be served from the cache. These files either haven't been downloaded before (thus are not possible to serve from cache) or were not cached by Squid. To find out which of these possibilities is correct you must investigate your access.log.
The above use of Squid Graph generates graphs for both TCP and UDP traffic. UDP traffic is used only when another Web cache is contacting your Squid server. You'll probably always want to specify
--tcp-onlyto squid-graph to remove the redundant UDP graphs.Graphs generated by the
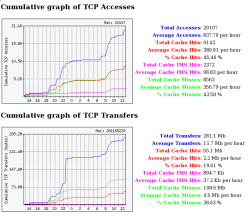
--cumulativeoption show the growing cumulative statistics over the time period, as shown below. I find the cumulative graphs easier to read than the spiky graphs shown in the screenshot above because the lines do not intersect as much and can be discerned more easily. For example, you can clearly see the blue line for Total Transfers spike at about 22:30 while the red line for Cache Hits remains stagnant.By default, Squid Graph shows you graphs for the last 24 hours. You can use the
--startand--endoptions to nominate a different time window. You have to pass them time values as the number of seconds since the Unix epoch (the start of 1970 UTC). This is a little messy, but the GNU date command can help you use more human-readable times. You can tell the date command to print a time other than the current system time using the-doption, and you can control the format that date uses to print the time using a +FORMAT option at the end of the line. The%soption tells date to show the number of seconds since the Unix epoch.$ date -d "2006-11-20" Mon Nov 20 00:00:00 EST 2006 $ date -d "2006-11-20" +%s 1163944800The invocation of squid-graph shown below will display statistics about 20 November 2006, assuming that access.log.2006 contains information from that time period.
$ ./squid-graph --cumulative --start=$(date -d "2006-11-20" +%s) --output-dir=/tmp/squid-graphUnfortunately you cannot specify both
--startand--endat the same time, so you cannot investigate a time period other than 24 hours.You can install and run Squid Graph in a matter of minutes. While there are more sophisticated tools available, it is hard to beat Squid Graph's simplicity of setup for a quick idea of how your Squid server is performing.
Categories:
- Tools & Utilities
- System Administration


