Author: Shashank Sharma
One of the first things I do upon installing a Linux distribution is put the Network Monitor applet on my GNOME panel. Watching the blue lights twinkle on and off makes me aware of network traffic. But if you want more details about what’s happening on your network, such as which application is hogging bandwidth or what each network interface is up to, you can turn to specialty tools like NetHogs and IPTraf. While NetHogs is a unique tool altogether, IPTraf can be used on a server as well as by a home user.
NetHogs
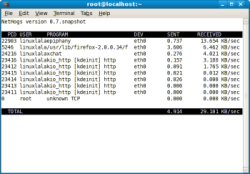
Unlike most bandwidth monitoring tools, which display network usage per IP address or per protocol, NetHogs monitors the network and presents bandwidth usage per application. Thus you can see how much bandwidth the RSS aggregator, browser, software updater, and even IRC and IM clients are using.
NetHogs is available through the software repositories for most distributions, or you can download the compressed tarball and install from source. When it’s installed, open a terminal, switch to the root user, and type nethogs. You should see each application name and its PID along with how much data it has sent and received, similar the output of the top command. The information is updated in real time so you don’t have to relaunch nethogs every time you launch a new application.
By default the refresh rate is 1 second, but you can change it anything you like with the -d command option. Also by default, the transfer is shown in KBps (kilobytes per second) but this too can be changed. While nethogs is running, press the m key to cycle through the available options for displaying the data transfer. The options are KBps, Bps, and MBps.
IPTraf
While NetHogs is a simple tool with a single functionality, there are many monitoring tools, graphical and command-line, with exhaustive list of features. If you want to contrast its simplicity with a tool that can offer you stats on your network usage, per each network interface and is easy to use, consider IPTraf.
IPTraf is a ncurses-based utility with a feature list so extensive, it’s nearly impossible to list all it does. Its About page lists the features and other useful information about it.
Like NetHogs, IPTraf is available through the software repositories of many distributions, and can be installed using yum or apt-get or via the source tarball. Also like NetHogs, IPTraf requires super-user privileges to observe your network.
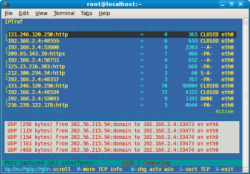
When you run IPTraf without any command options, you’ll be greeted with a menu-driven interface. You can navigate through the interface using the arrow keys to move up and down, and the Enter key to select an item from the menu. The menu entries are all self-explanatory; if you wish to view the IP traffic, select IP traffic monitor, then select your interface card from the list if you want to view the traffic for a single interface.
You can configure IPTraf from its Configure menu. If all the configurable options seem confusing, refer to the online IPTraf manual for a quick course on what each of these options means. Some of the options are Reverse DNS Lookup, which causes IPTraf to find out the name of the hosts with the IP addresses in the packets; enabling logging; and turn on the promiscious mode, which ensures that all traffic is captured. To change a option, scroll down to it using the down arrow key and press Enter. For instance, you can enable logging this way, and see the logging setting change from Off to On under the Current Settings heading on the right. After that, when you select IP traffic monitor and an interface, you will be asked to specify a file where the log will be stored. By default, logs are stored in the /var/log/iptraf directory. Each entry in the log file consists of (in this order):
Time stamp: month, day, time, year
Protocol: TCP, UDP, etc.
Interface: eth0, eth1, localhost, etc.
Packet size in bytes
Addresses: The for and from keywords denote whether the address is a destination or a source address. It can be either IP or MAC address.
When you run the IP traffic monitor, among the other details, IPTraf also informs you of the flag status for each TCP packet it intercepts. These flags can reveal details such as which side initiated the connection, and when the connection is closed or reset.
In addition to serving as a simple IP traffic monitor, you can also use IPTraf to view a statistical breakdown of your network traffic sorted by packet size or according to the TCP/UDP port. This gives you a fair idea of the network traffic to and from your machine.
Conclusion
While many tools can inform you of the data transfer for each of your network interfaces, as well as break it down per protocol, they are not all easy to use. Because IPTraf is, it remains a popular tool even three years after its most recent version was released. As for NetHogs, its strength is one that other tools in this genre have chosen to ignore: By informing users of bandwidth usage per application, it provides a crucial missing piece in the network monitoring puzzle.
Categories:
- System Administration
- Networking


