
Author: Joe Barr
Jean-Luc dropped me a note after seeing the GKrellM review a week or two ago and invited me to take a look at his Modular Object Oriented Dynamic SpreadSheet (Moodss) project. I’ve had the chance to do that over the past couple of days. Here is what I’ve found.
While GKrellM provides some serious monitoring capability, in my opinion it is a tool aimed more at ordinary desktop users than it is for serious system administration. Not so with Moodss. The itch that Jean-Luc was scratching in 1997, when he first wrote moodss, and the one that still drives him to add new features to it, is the need that professional sysadmin types have to monitor their network boxes. I see his project as more of an industrial strength tool than GKrellM. No slight intended, by the way. I love GKrellM and Jean-Luc told me that he is working on an interface for gkrellmd.
I downloaded the Moodss tarball from the website, decompressed it, and started it up. It’s that easy. The main window is deceptively simple. Great power lurks just below the surface of that mild exterior. How much power? Let’s take a look. After clicking on File->Modules->Load, and then selecting “ps” from a list of 28 built-in modules, the popup menu you see below (that’s the main window beneath it) appears.
From the Load Modules window you can scroll through the built-in modules. If, like me, you’re not a sysadmin, you may need to click on help to get more particulars on any one of the
choices. For example, after selecting “ps” you’re given the choices for -files, -f, -remote, -r, -u and -users. Not having a clue as to what those arguments do, I clicked on Help. Up popped a help window with a complete explanation for each option.
The check box for -files determines whether or not the first of the two windows the ps monitor displays includes a column showing the number of open files per process. By default it does not. The -r option allows you to do remote monitoring of another machine by specifying user@host, and the -u option allows you to enter a list of user names. The -remote and -users entry boxes are the long forms of those same two options. Only the processes owned by the users specified will be displayed. After setting the options the way you want them, or simply ignoring them all, clicking load creates the two spreadsheet views.
In addition to module specific help in File->Modules, there is a wealth of information about Moodss behind the Help item in the menu bar at the top of the window. How much information? More than 13,000 words. That may be more than you want to read in a window. If so, you can view the same information in HTML format online.
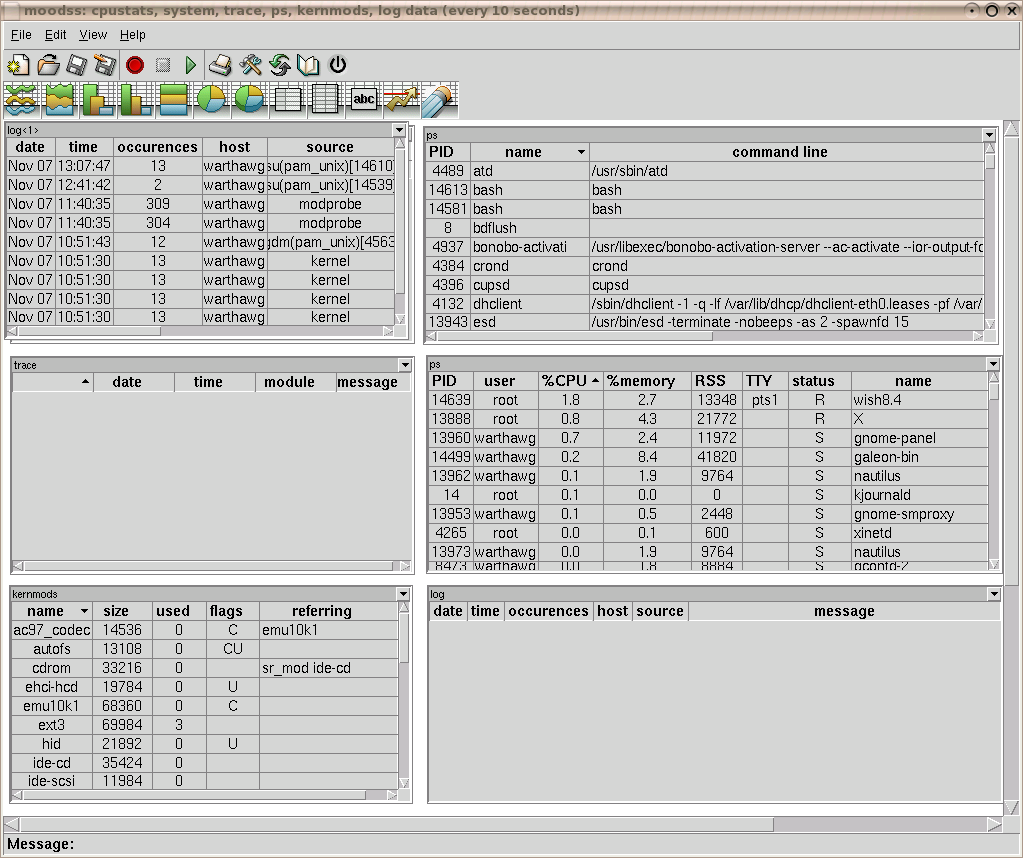
I played with Moodss for a little while and started to get the hang of things. I added several other monitors, arranging them as I wanted to see them on the palette. I tweaked and explored a bit with them all running. Then I noticed that Moodss has changed to a 60 second refresh cycle as I had added the additional monitors. That was too slow for me. I found that View->Poll Time let me select as few as 10 seconds between refreshes. Then I took advantage of another Moodss feature and saved the configuration. I can now start Moodss and load that “dashboard” file from the GUI. My example “dashboard” is shown below. You can do the same thing from a command line by entering “moodss -f dashboard-filename”.
Another neat feature of Moodss is the ability to drag-and-drop cells from the spreadsheet views of the various monitors you have running onto different viewers. Viewers are graphic displays like bar charts, pie charts, line charts, and so on.
As I mentioned earlier, I’m not a system admin by any stretch of the imagination. But I can see how useful it would be to be able to save different Moodss configuration files for different machines on the network in order to almost instantly learn what was happening (or not happening) on specific boxes.
There is a screenshot on the moodss homepage showing a “dashboard” with various monitors set up to watch an Apache web server. It shows several different types of viewers being put to good use.
Worried about your database? You can monitor it with moodss. According to the Moodss/MySQL page, there are 8 monitors that come with Moodss for dealing with MySQL. If your database is fine and doesn’t need monitoring, you can take advantage of its presence by using it to store Moodss monitoring data over time.
If you don’t find the monitor you need with the latest release of Moodss, don’t despair. You can check out the PyMoodss project. IBM runs Moodss on mainframes running Linux and has extended some of the monitors in order to keep up with the hard drives in use when you are running a 100 instances of Linux.
Jean-Luc isn’t finished with Moodss yet. He told by email that a number of major new features were planned. Specifically he mentioned a new viewer to display formulas containing data from multiple cells/monitors, updates for the 2.6 version of the Linux kernel, icons which change color according to user-defined thresholds, and java modules.
Moodss is already included in the SuSE Pro distribution and Debian. Jean-Luc says he is working with the Fedora project and may have an RPM ready for the new Fedora core very shortly. Binaries, RPMs, and source are all available on the website. If you need to watch over boxes, you might want to take a serious look at Moodss to help you do just that.


