
Author: Dmitri Popov
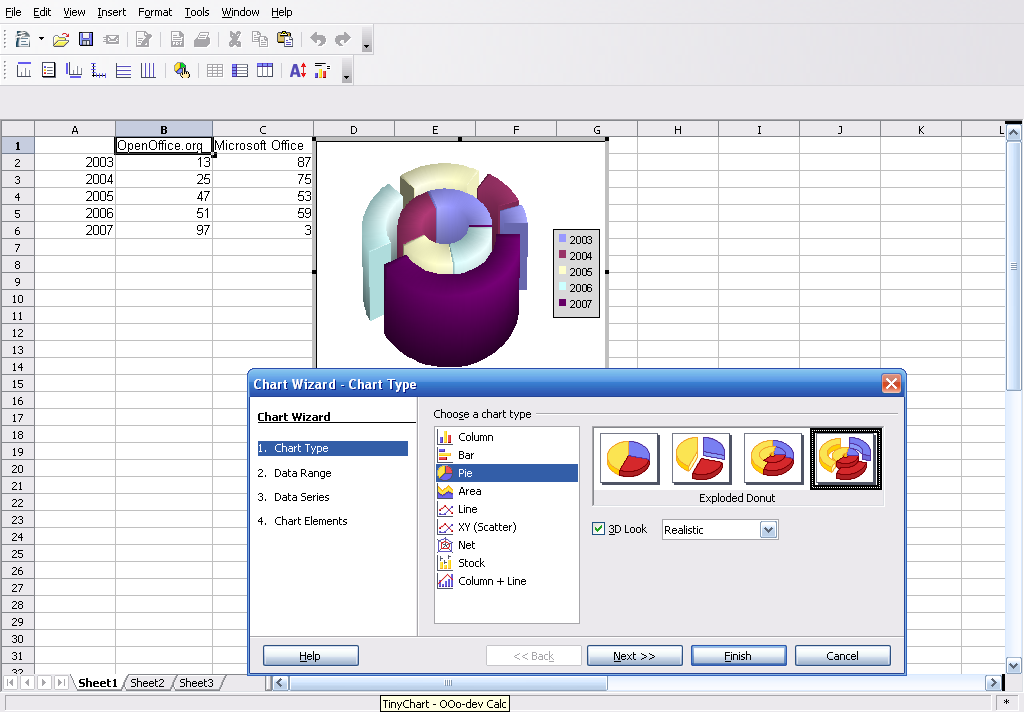
The first major improvement is the addition of a live chart preview, which allows you to view the current chart while tweaking it in the chart wizard. As you edit the chart’s properties, the preview reflects these changes in real time (See Figure 1).
The chart wizard has been redesigned from ground up. It now offers a more streamlined and logical interface that makes the process of creating a chart less cumbersome. There are also a few new chart types — most notably, Donut and Exploded Donut. When creating a chart you can choose between two 3-D look types: Simple (produces a rough chart) and Realistic (creates a more smooth-looking chart).
You can now add regression curves to any existing chart instead of creating a separate chart as in the current version. To add regression curves, open the Object Properties dialog window under the Statistics tab (See Figure 2).
The new chart module allows you to specify what the developers call “flexible data ranges,” meaning you can easily pick data for your chart from any part of the spreadsheet using the Data Series tab in the Data Ranges dialog window (See Figure 3).
If you wish to take the new chart module for a spin, you can download the latest developer build of the entire OpenOffice.org 2.x suite. It won’t interfere with your current OpenOffice.org installation as long as you install it to a different directory. It goes without saying that this alpha quality software is not suited for production use.
While the new chart module shows a lot of promise, the graphics engine still needs a serious update. You can add all the features in the world, but they won’t make much of an impact if the final result looks like it was done in the mid-’90s.
The new chart module is expected to appear in OpenOffice.org 2.6 — but unfortunately, a release schedule for OpenOffice.org 2.6 is nowhere to be found.
Dmitri Popov is a freelance writer whose articles have appeared in Russian, British, German, and Danish computer magazines.


