Author: Ben Martin
Profiling an application lets you see what functions are taking up most of the CPU time so you can concentrate your optimization efforts on making the those pieces of code run faster. With sysprof, you can profile all the applications that are running on your machine, including a multithreaded or multiprocessed application or a complex server application that has multiple parts. sysprof collects information about how much time is spent in each library and function as the applications execute.
sysprof provides both a kernel module and a GTK+ graphical interface to allow you to perform your profiling. You can find packages of sysprof for Ubuntu, openSUSE 10.3, and Fedora. To get the most out of sysprof you should also install the debug information for all the applications you wish to profile. Without the debug information you will see only the name of a shared library in the profile information and not be able to tell what functions are taking up the lion’s share of time spent in that library. Sysprof offers great flexibility by letting you install these debuginfo packages temporarily on a deployed system, then start profiling it to find out what makes the system slow.
Once the packages are installed, getting up and running is a two-step process. First, insert the kernel module with modprobe sysprof-module, then fire up the graphical interface by running sysprof and click the Start button in the toolbar. From that point on sysprof will monitor and profile everything that your machine does.
After you start sysprof capturing profile information, run the applications that you are interested in profiling and interact with them in the normal manner. After you have performed the tasks that you wish to profile, click the profile button in the toolbar. This will stop sysprof from monitoring your system and allow you to investigate the profile data that sysprof captured. You can also save and load profile data you have just captured. Profile information is saved in XML format, and I didn’t see any reference to symbols which would have to be resolved at load time, so the XML file should be able to be saved on one machine and analysed on another.
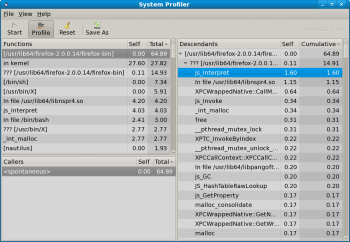
The rest of the functionality of sysprof is about analysing the captured profile. The sysprof window is divided into three main sections: Functions, Callers, and Descendants lists. The Functions list is your starting point. By default you will see a list of the executed functions, starting with the one that took the largest total time to execute. Items in the Functions list include executable processes, shared libraries, and the kernel itself.
Clicking on a function will show it in the Descendants list on the right side of the window. If you click a process in the Functions list then the Callers list at the bottom left will show <spontaneous>. If you click on a function, say f, in the Functions or Descendants list, then every function that calls the f function will be shown in the Callers list.
I managed to get a kernel Oops after executing rmmod sysprof_module, so you might like to avoid using sysprof on a production setup. Although the Oops was reported to all consoles, the system could still be used and rebooted in an orderly manner. In subsequent testing of module removal and reinsertion I didn’t get another Oops, but I did manage to get the system into a state where I could no longer use sysprof without first rebooting.
Sysprof could benefit from some simple enhancements. It would be nice if sysprof’s user interface included back and forward buttons to allow you to explore around the profile and backtrack at will. Also, being able to perform a profile capture from the command line would enable easier profiling on servers that might not have the required X Window libraries installed to allow you to execute the graphical client remotely. A console client would also make automated captures an easier task. Unfortunately, sysprof is only compatible with the i386 and x86-64 architectures; it might prove useful on the ARM platform too.
Because sysprof is packaged for many distributions already and does not require you to recompile your applications, you can use it to look for performance bottlenecks quickly.
Category:
- System Administration


