
Author: Rob Reilly
Translating data from the physical world onto your Web page requires several steps:
- Use a microcontroller (such as our Netmedia BX-24) to generate a time reference number, read a potentiometer, and record a light level from a photocell.
- Send these data values from the BX-24 to a Linux/Apache server via the serial port.
- Grab the captured data (on the Linux/Apache box) with a shell script and put it into a text file.
- Use a few lines of PHP code to read the text file and stick the three values on a Web page for display with a browser.
While you could use a loop in PHP to create a table of values on the Web page, most people visualize numerical trends better if the data appears in a graph. With PHPlot, an external PHP class, the Linux/Apache server can build charts on the fly. The code runs under PHP 3.0 or 4.0.
Changes to the BX-24 code
Before we create a graph, we need to change some of the code in the previous BX-24 article.
Delete the OutputString = "Start Log " & chr(10) & chr(13) line and its comment. While it was nice to have a Start Log at the top of the data file, it causes all kinds of headaches when the PHP code tries to read in strings of numeric values.
Next, move the Call putQueueStr(OutputVar, OutputString) line down below the OutputString = cstr(timecounter) & chr(44) & cstr(ADCvar13)... line. Use it as shown above, because an errant string seemed to have worked its way into end of the original Call putQueueStr line. This change prevents the Call putQueueStr line from hanging when it no longer can find the first OutputString line. We want to immediately start sending the timecounter, potentiometer, and light level readings to the serial line, without a Start Log string at the top of the file.
The initial timecounter variable should be changed to 1 instead of 0. Real world counting starts with 1.
After making the changes, don’t forget to recompile and run the micro code, with the BX-24 powered up and connected to the programming port (MS-DOS machine running the BasicX compiler). Having the output serial line connected to the Linux/Apache/PHP machine also facilitates watching the data values.
Revise the Linux loop
In the previous BX-24 story, the shell script while loop used for capturing text from the serial port worked pretty well. All it needs is a new file name. It’s also best to start a new file each time the capture executed, so you don’t get big gaps in the data. An rm command at the front takes care of that task. Here’s the new while loop, run as a regular user from the command line:
rm /home/rreilly/roblog3.txt; while true; do read LINE > /home/rreilly/roblog3.txt ; done
To capture a new data set, press Ctrl-C to get out of the while loop and restart. Powering down the microcontroller will also start a new data set. If you just restart the microcontroller, remember that the new data will be appended to the capture file, if the while loop (on the Linux server) has not also been restarted. Occasionally, appended data would cause my PHP code to croak while trying to interpret oddball characters.
Create the graph using PHPlot
The only tough part about writing PHPlot code to plot data from a text file is getting all the array indexes right and converting strings to arrays. Also, the strings have newline characters embedded at the ends and need trimming before they become array elements.
I placed this PHPlot code, which I named fileread.php, in /www, the main Web directory for my Linux/Apache/PHP installation.
<?php

//Include the code

include "phplot.php";
//Define the object
$plot = new PHPlot();
$which_legend = array("potentiometer", "light level");
$FileName = "/home/rreilly/roblog3.txt";
$FilePointer = fopen($FileName, "r");
$filedata = file($FileName);
$linenum = 0;
do {
$row[$linenum] = explode(",",rtrim($filedata[$linenum],"n"));
$linenum = $linenum+1;
}
while ($linenum
//while ($linenum
//while ($line[1] != "10:37"); //uncomment line 15 and this line to plot up to a certain time
fclose($FilePointer);
$plot->SetDataValues($row);
// generate the graph with the microprocessor data
$plot->SetTitle("Microcontroller Data");
$plot->SetXLabel("Time Reference Number");
$plot->SetYLabel("10-bit Analog Readings");
$plot->SetLegendPixels(70,10,0);
$plot->SetHorizTickIncrement(5);
$plot->SetLegend($which_legend);
$plot->SetFileFormat('jpg');
$plot->SetPlotType('linepoints');
$plot->DrawGraph();
?>
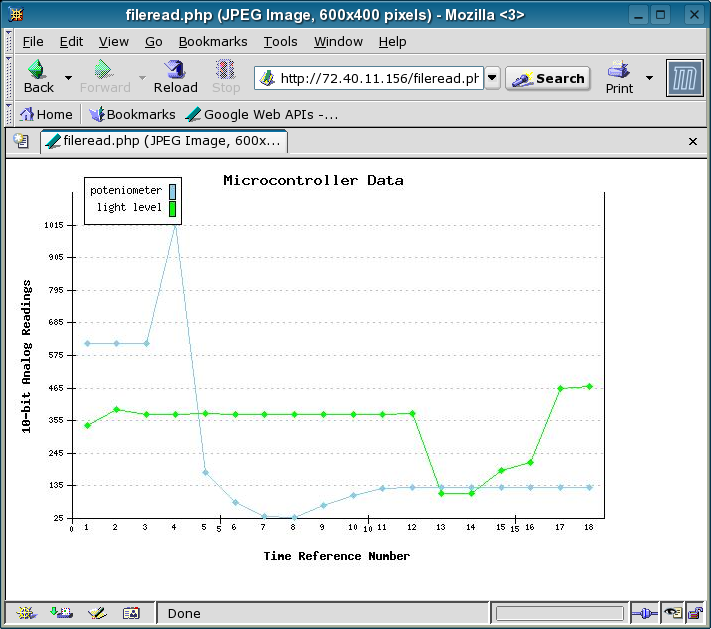
| Figurel 1 – Click to enlarge | |
| Figure 2 – Click to enlarge |
I used the JPEG output format for the graph instead of the PNG default because Internet Explorer on my iPAQ won’t display PNG natively. JPEG sacrifices some quality, but can be viewed pretty universally across browsers. JPEG was quite readable using the Mozilla browser on my HP Athlon 64 SUSE Linux 10.0 laptop.
I also chose linepoints for the $plot->SetPlotType( ) line, because it makes multiple data streams easy to see on the graph (figure 1) . You can experiment with bars, lines, area, points, and pie types. Figure 2 shows a bar graph of the same data set.
The figures show a small data set where I started up the microcontroller and then turned the potentiometer knob. You’ll also note a small drop in light level as I moved my hand near the photocell.
My test setup captures only two analog values. It is an easy matter to expand the number of data channels up to 16 (perhaps eight analog and eight digital). You’d simply add code to read more I/O pins, along with the sensor and voltage divider components. The additional data streams would be automatically added as new chart lines.
Enhancements
If you were feeling creative, you could enhance this basic data acquisition system.
- You could remove the time reference from the BasicX code and replace it with a time stamp generated with the
dateprogram, in the shellwhileloop. - Using
cronand a shell script, you could perform data capture over a set interval. - You could add start/stop times as input boxes (implemented via forms and PHP) on the Web page.
- Since PHPlot has a huge number of display options, you could create sophisticated Web-based charts.
Combine the real-world data capturing qualities of the BX-24 microcontroller with Linux and you have a highly customizable package for many data acquisition applications. Why not see if some cool, automatically generated Web charts would give your next real-world project that finishing touch?
Rob Reilly is a consultant, trend spotter, and writer. He can advise you on your data acquisition projects, along with portable computing and presentation technology integration.


