
Author: Walter Goh
The library supports the standard array of pie, bar, line, area, and other charts. What makes it stand apart from similar Java open source offerings is its support for more complex charts, including Gantt, polar, and financial charts such as candlesticks.
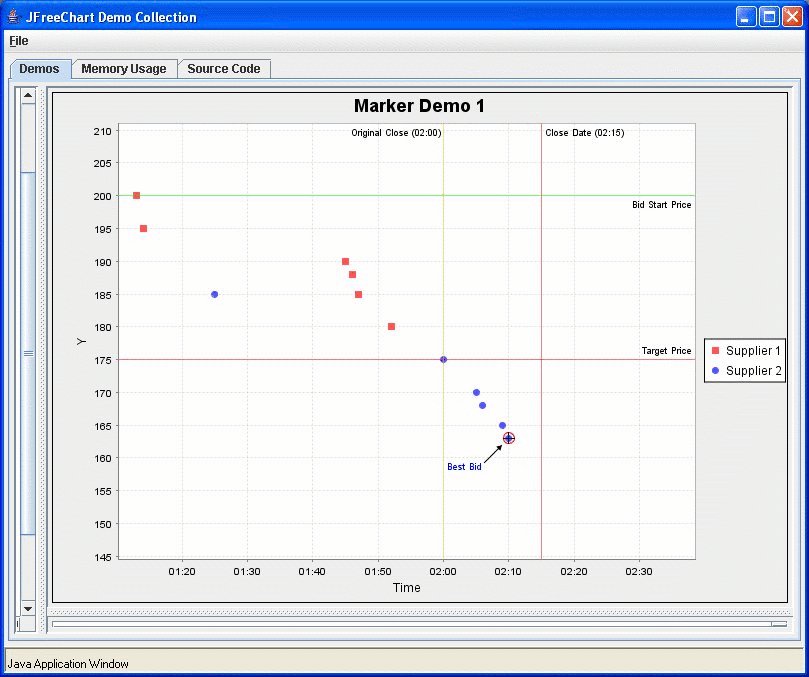
JFreeChart even boasts advanced features such as cross-hairs and annotations. Annotations are pointers or shapes that bring attention to a particular point in a chart. Figure 1 shows an annotation with the words “Best Bid” and a corresponding arrow and circle highlighting a point in the chart.
Crosshairs really add to the interactive and dynamic nature of your charts. In figure 2 you can see an intersection of two perpendicular lines at a red dot. What may not be apparent is that this intersection can be anywhere on the map where you place your mouse pointer. The software is even smart enough to “snap” only to points on the chart, and not anywhere in between.
|
Figure 1. Annotation – click to enlarge |
Another plus is the number of output formats supported by JFreeChart. It can handle Portable Document Format (PDF), JPEG, Portable Network Graphics (PNG), and Scalable Vector Graphics (SVG). You can find a catalog of supported chart types at the JFreeChart samples page, and more comprehensive examples featuring animation and crosshairs are provided in the demo application when you download the library.
Documentation
Unlike most open source projects that provide free documentation, the project’s documentation comes in two versions. The free documentation consists of a JFreeChart Installation Guide, which provides basic installation instructions and tells how to run the demo application bundled with the library, and a free API guide generated by JavaDoc.
|
Figure 2. Crosshairs – click to enlarge |
The JFreeChart Developer Guide is non-free and will set you back $40. The Developer Guide is more than 500 pages long and provides quality documentation for the library and full source code for the demo application.
If you’re already a seasoned programmer with experience in charting packages, you might not need to fork out any money for the Developer Guide. However, if you’re just starting out, getting a copy of it may save you time and headaches.
Support for server-side output
The library supports output from Java Server Faces (JSF), Java Server Pages (JSP), and Servlets. There are two ways to go about doing this. The first option is to make use of the JFreeChart library directly and write the code in your JSP or Servlets to generate the charts. The second option would be to make use of custom JSP tags or JSF components which already wrap the JFreeChart library.
I’d recommend using the first option if you need to generate complex charts that require fine control over the chart generation parameters. In most cases, however, I’d recommend the second option. Not only is it easier and faster, but there are already other open source projects doing it — for instance, CeWolf project for JSP tags, and the JSF Chart Creator for JSF.
JFreeChart has no commercial support available, but you can solve most problems by visiting the project’s forums. According to JFreeChart’s author, the current user base for JFreeChart is around 40,000 to 50,000 developers, and many projects have been using this library for years, so it’s quite likely that most of the problems you may encounter have already been dealt with. As a last resort, you can turn to the source code. It certainly has come in handy for me, many times over. One hint: take a look at the JUnit test cases if you are unsure about some of the run-time behavior of the classes.
Performance
My experience using JFreeChart required display of end-of-day financial stock data, so performance was not a problem for me. JFreeChart’s performance tends to be subjective, and many performance problems encountered by developers, such as anti-aliasing, actually have their roots elsewhere. Some performance issues result from a bug in Java or in misuse of the JFreeChart API.
It seems like the main performance problems relate to real-time or animated charts. There are discussions in the forums related to issues when using large data sets. I’ve spent a considerable amount of time wading through the forums about the issues and I’d suggest that the JFreeChart project add another forum addressing performance alone.
Conclusion
JFreeChart is a rich Java charting library. Before you try it, evaluate your needs, look at the demo applications that come with the library, and spend some time visiting the JFreeChart forums to get a feel for the community. Once you’ve had a chance to evaluate the library, I think you’ll find it to be suitable for most projects.
| Purpose | Java class library for generating charts |
| Authors | David Gilbert and Thomas Morgner |
| License | GNU Lesser General Public License (LGPL) |
| Price (retail) | Free. Additional documentation available for $40. |
| Product Web site | JFree.org |
Category:
- Open Source


