Author: Justin Palk
Google Maps opened up a whole new world of mapping on the Web, making it easy for companies and individuals to put their data on a map. But if you want more control over how your maps look, or have data that doesn’t really work well with Google Maps, there are other options, including serving your own data with Geoserver.
Geoserver implements the Open Geospatial Consortium’s Web Feature Server and Web Coverage Server specifications, with an integrated Web Map Server. The current stable version is 1.6.5, although the developers recently released 1.7.0-RC2. Written in Java, it’s available for Linux and Unix variants and for Windows, and it requires a Java Runtime Environment, such as Sun JRE 6, to run.
Geoserver can be installed into servlet containers such as Tomcat or Jetty, but the developers also provide standalone binary packages. Installing Geoserver from the binary package on Ubuntu is as simple as typing sudo unzip geoserver-1.6.4-bin.zip-d /usr/local/.
Before you can run Geoserver, you’ll need to define $GEOSERVER_HOME in your shell. If you’re running bash, you can do this by appending export GEOSERVER_HOME=/usr/local/geoserver to the end of your .bashrc or .bash_profile, as appropriate.
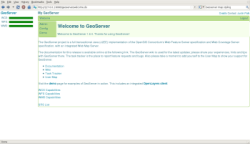
To start Geoserver, type $GEOSERVER_HOME/bin/startup.sh. Once the startup process is finished, which can take a minute, open up a Web browser and point it to http://127.0.0.1:8080/geoserver to access the server’s configuration and demo pages.
Clicking the Admin link will bring up some status information about the server, while clicking Config will let you log in to the control panel. A box in the upper left of the page, with Apply, Save, and Load buttons, is present in most Geoserver config pages. Once you’ve made a change to part of the server’s configuration, you need to click Apply before the changes will be reflected in the server. Clicking Save will write the changes to disk, while Load will reload your configuration from disk, undoing applied but unsaved changes.
Preparing your data
Once you have Geoserver installed and running, you need some data to work with. Geoserver can pull data from another Web Feature Server or a PostgreSQL database with the PostGIS extensions, but to get things up and running quickly, you can use locally stored shapefiles. A good source for freely available GIS data is the US Census Bureau, with its TIGER/Line shapefiles. These files contain geometries for features including roads, railroads, bodies of water, and state and county lines. For this exercise, we’ll display and style road data for Frederick County, Md. If you want to take a closer look at the data before continuing, you’ll need to use a program such as Qgis.
Uncompress the shapefile using the command unzip fe_2007_24021_edges.zip -d $GEOSERVER_HOME/data_dir/data/shapefiles/, and then go to the Geoserver control panel. Log in, then click on Data. To begin, you need to create a Namespace, which can hold multiple related datasets. Click on Namespace, then New. Since we’re working with data describing Frederick County, give the Namespace the prefix FrCo. Click on New, then fill in the URI for the Namespace — most likely the name of the domain where the data is being served — with the Namespace prefix appended. For this example, just use the loopback address http://127.0.0.1/FrCo. Finally, click Submit.
Once you have a Namespace for your data, you need to add a DataStore: in this case, the TIGER shapefile. Go back to the data configuration page and click on DataStores. Once again, click New, enter a name, such as FrederickCountyLines, in the Feature Data Set ID box, and select Shapefile from the dropdown menu provided. Make sure the Enabled box is checked so that the server will make the data available online, set the Namespace to FrCo if it isn’t set already, and enter file:data/shapefile/fe_2007_24021_edges.shp in the url box. Beneath that, select create spatial index -> true and click Submit.
Geoserver will immediately send you over to the FeatureType Configuration page, where you give Geoserver more details about the data you just pointed it at. Since the shapefile’s filename isn’t particularly descriptive, give the feature an alias: FrederickCountyLines. Since you haven’t yet created a Style for this feature, which would tell Geoserver how you want this it displayed, select the line style from the dropdown menu for now.
Next, you need to tell Geoserver about the geometric model, or spatial reference system, this data is based on. The SRS describes the coordinate system, model of the Earth’s shape, and projection that map data uses. The European Petroleum Survey Group has a catalog of SRSs, which can be referred to by their EPSG number. In this case, the SRS for the TIGER data you’re working with is in the EPSG catalog as number 4269, so put that in the SRS box and click on Lookup SRS.
Geoserver can automatically derive the bounding box for your data, so click the Generate button to do that, and then scroll down to the bottom and click Submit.
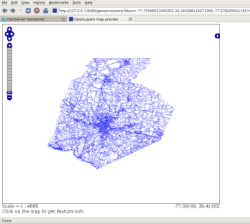
Apply your changes, then to see what you’ve got, go back to the welcome screen, click the Demo link, then Map Preview. FrCo:FrederickCountyLines should be near the top of the list of available FeatureTypes. Click on it, and Geoserver will bring up an OpenLayers map using the data you just imported.
What you’ve got is just sort of a blob of undifferentiated lines without any meaning, unless you happen to know the area you’re displaying. That’s because the shapefile contains data for several different features, including roads, railroads, and rivers, and the line style you picked a moment ago just tells Geoserver to draw everything as simple lines. To fix that, you need to create a style for the map.
Map styling
Geoserver uses the Open Geospatial Consortium’s Styled Layer Descriptor to control the look of the maps it serves up. SLDs are XML documents that contain rules governing how features are drawn. Here’s a simple SLD:
<?xml version="1.0" encoding="ISO-8859-1"?>
<StyledLayerDescriptor version="1.0.0"
		xsi:schemaLocation="http://www.opengis.net/sld StyledLayerDescriptor.xsd"
		xmlns="http://www.opengis.net/sld"
		xmlns:ogc="http://www.opengis.net/ogc"
		xmlns:xlink="http://www.w3.org/1999/xlink"
		xmlns:xsi="http://www.w3.org/2001/XMLSchema-instance">

	<NamedLayer>
		<Name>Frederick County</Name>
		<UserStyle>
			<Title>Frederick County Road Map Style</Title>
			<Abstract>A style for a road map of Frederick County</Abstract>
			<FeatureTypeStyle>

				<Rule>
					<Name>Highways</Name>

					<ogc:Filter>
						<ogc:PropertyIsEqualTo>
							<ogc:PropertyName>MTFCC</ogc:PropertyName>
							<ogc:Literal>S1100</ogc:Literal>
						</ogc:PropertyIsEqualTo>
					</ogc:Filter>

					<!-- black outline -->
					<LineSymbolizer>
						<Stroke>
							<CssParameter name="stroke">#000000</CssParameter>
							<CssParameter name="stroke-width">5</CssParameter>
						</Stroke>
					</LineSymbolizer>
					<!-- red centerline -->
					<LineSymbolizer>
						<Stroke>
							<CssParameter name="stroke">#FF0000</CssParameter>
							<CssParameter name="stroke-width">3</CssParameter>
						</Stroke>
					</LineSymbolizer>
				</Rule>

		  </FeatureTypeStyle>
		</UserStyle>
	</NamedLayer>
</StyledLayerDescriptor>
This file contains a single rule for drawing highways as a red line with a black outline. It consists of two parts: a filter and a pair of LineSymbolizers.
Filters allow you to specify what classes of data in a FeatureType you want a rule to apply to. In this case, you’re looking for highways, or as the Census classifies them, primary roads. In the shapefile, those features are classified with a MAF/Tiger Feature Class Code, or MTFCC, of S1100. Note that the property names in the filters are case-sensitive.
The LineSymbolizers tell Geoserver what the lines should look like. When you’re putting together your symbolizers, think of it as if you’re painting a picture — the thing you want to be on top should be the last thing you put down. In this case, to get a red line with a black outline, first draw a 5-pixel black line, then put a 3-pixel red line on top of it.
SLD also has PolygonSymbolizers, for drawing polygons and other area geometries; PointSymbolizers, for point data; TextSymbolizers, for formatting label text; and RasterSymbolizers, for use in displaying raster data, such as satellite photos or digital elevation models. You can download the full SLD specification.
Copy your SLD and save it wherever you like. Go back to the Geoserver data configuration page and click Style, then New. You’ll get a dialog box where you can enter the new style’s name. Enter FrederickCountyRoads, then click Submit. Geoserver will give you a text box where you can enter your new style. Either copy and paste the style above into the box, or, if you made a local copy, upload it using the controls beneath the text box, then click Submit. By default Geoserver will validate your SLD against the SLD schema for you, and if there are any errors, it will produce a page showing where they are in the SLD so you can fix them.
Return to the FeatureTypes configuration for FrCo:FrederickCountyLines, change the SLD from lines to FrederickCountyRoads, click Submit, then hit the Apply button so the server will register the change in the SLD. When you return to the map viewer, the mass of thin lines should be gone, and you should see only the highways — I-70 running east to west, and I-270 running roughly from the center of the map down to the southeast. Now you’ve gone to the other extreme, and are displaying a bare-bones amount of data, but you can start to see how Geoserver lets you take control of your map.
This is a more complicated SLD that displays different types of roads, each with its own style:
<?xml version="1.0" encoding="ISO-8859-1"?>
<StyledLayerDescriptor version="1.0.0"
		xsi:schemaLocation="http://www.opengis.net/sld StyledLayerDescriptor.xsd"
		xmlns="http://www.opengis.net/sld"
		xmlns:ogc="http://www.opengis.net/ogc"
		xmlns:xlink="http://www.w3.org/1999/xlink"
		xmlns:xsi="http://www.w3.org/2001/XMLSchema-instance">

	<NamedLayer>
		<Name>Frederick County</Name>
		<UserStyle>
			<Title>Frederick County Road Map Style</Title>
			<Abstract>A style for a road map of Frederick County</Abstract>
			<FeatureTypeStyle>

				<Rule>
					<Name>Secondary Roads Low and Med Res</Name>

					<ogc:Filter>
						<ogc:PropertyIsEqualTo>
							<ogc:PropertyName>MTFCC</ogc:PropertyName>
							<ogc:Literal>S1200</ogc:Literal>
						</ogc:PropertyIsEqualTo>
					</ogc:Filter>

					<MinScaleDenominator>15000</MinScaleDenominator>
					<!-- 2 px. black line -->
					<LineSymbolizer>
						<Stroke>
							<CssParameter name="stroke">#000000</CssParameter>
							<CssParameter name="stroke-width">2</CssParameter>
						</Stroke>
					</LineSymbolizer>

				</Rule>

				<Rule>
					<Name>Secondary Roads high res</Name>
					<ogc:Filter>
						<ogc:PropertyIsEqualTo>
							<ogc:PropertyName>MTFCC</ogc:PropertyName>
							<ogc:Literal>S1200</ogc:Literal>
						</ogc:PropertyIsEqualTo>
					</ogc:Filter>

					<MaxScaleDenominator>14999</MaxScaleDenominator>

					<!-- black boundary -->
					<LineSymbolizer>
						<Stroke>
							<CssParameter name="stroke">#000000</CssParameter>
							<CssParameter name="stroke-width">5</CssParameter>
						</Stroke>
					</LineSymbolizer>
					<!-- white stripe -->
					<LineSymbolizer>
						<Stroke>
							<CssParameter name="stroke">#FFFFFF</CssParameter>
							<CssParameter name="stroke-width">3</CssParameter>
						</Stroke>
					</LineSymbolizer>

				</Rule>

				<Rule>
					<Name>Highways</Name>

					<ogc:Filter>
						<ogc:PropertyIsEqualTo>
							<ogc:PropertyName>MTFCC</ogc:PropertyName>
							<ogc:Literal>S1100</ogc:Literal>
						</ogc:PropertyIsEqualTo>
					</ogc:Filter>

					<!-- black outline -->
					<LineSymbolizer>
						<Stroke>
							<CssParameter name="stroke">#000000</CssParameter>
							<CssParameter name="stroke-width">5</CssParameter>
						</Stroke>
					</LineSymbolizer>
					<!-- red centerline -->
					<LineSymbolizer>
						<Stroke>
							<CssParameter name="stroke">#FF0000</CssParameter>
							<CssParameter name="stroke-width">3</CssParameter>
						</Stroke>
					</LineSymbolizer>
				</Rule>

		    </FeatureTypeStyle>
		</UserStyle>
	</NamedLayer>
</StyledLayerDescriptor>
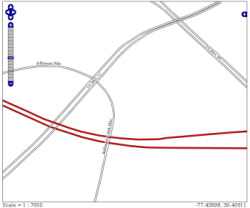
This SLD has rules for highways and secondary roads. If you look closely, you’ll notice that there are two rules for the secondary roads, each for different levels of map resolution. Go back and edit the FrederickCountyRoads SLD to contain this file, rather than the highways-only file you used first, apply the changes, and look at the map viewer. Now you can see the highways and the secondary roads, and, as you zoom in, you’ll see that the way the secondary roads are rendered will change.
The responsible tags are MinScaleDenominator and MaxScaleDenominator. Where filters will control what data a rule applies to, these two tags control at what map scales they apply. They allow you to control the level of detail displayed on your map, so that people viewing it aren’t overwhelmed by masses of spaghetti when they’re zoomed out. As you zoom in on a map and the level of detail increases, the demoninator of the map scale decreases. MinScaleDenominator sets the highest zoom level that a rule will apply to, while MaxScaleDenominator sets its lower bounds. In this case, you’ve set one rule for displaying secondary roads when the map scale denominator is 15,000 or higher, for maps displaying a large area, and another rule for when the map scale denominator is 14,999 or lower, for maps that are zoomed in on a smaller area.
Labels
The next thing you need to do is put labels on your roads. To avoid cluttering up the map, add the following code to the rules for displaying secondary roads at high resolution, just above the first LineSymbolizer:
		<TextSymbolizer>
						<Label>
							<ogc:PropertyName>FULLNAME</ogc:PropertyName>
					 	</Label>

						<Font>
							<CssParameter name="font-family">Times New Roman</CssParameter>
							<CssParameter name="font-style">Normal</CssParameter>
							<CssParameter name="font-size">10</CssParameter>
						</Font>

						<LabelPlacement>
						  <LinePlacement>
						    <PerpendicularOffset>10</PerpendicularOffset>
						 </LinePlacement>
						</LabelPlacement>

						<Halo>
							<Radius>
								<ogc:Literal>2</ogc:Literal>
							</Radius>
							<Fill>
								<CssParameter name="fill">#FFFFFF</CssParameter>
								<CssParameter name="fill-opacity">0.85</CssParameter>
							</Fill>
						</Halo>

						<Fill>
							<CssParameter name="fill">#000000</CssParameter>
						</Fill>
						<VendorOption name="group">yes</VendorOption>
					</TextSymbolizer>
The TextSymbolizers share some features with the LineSymbolizers, but also have some new features. The Label tag defines what field in the shapefile Geoserver should look to for feature names. The LabelPlacement tag and its children specify that labels should be placed perpendicular to the line they’re attached to, and offset by 10 pixels. The Halo tag specifies a 2-pixel white halo around the labels, to improve their visibility over nearby features. Finally, the VendorOption tag sets a Geoserver-specific rule to only display any particular label once, even if multiple features — such as road segments — share the same label. Submit and apply the changes, and go back to the map viewer and zoom in on some roads to see the result.
GetFeatureInfo templates
One more thing Geosever allows you to do is to take control of how data about your FeatureTypes is presented in response to queries. The map viewer is set up so that when you click on a feature, such as a road, it executes a WFS GetFeatureInfo request to retrieve information about the feature you clicked on. Geoserver’s default response to that query is to send a table containing all of the data fields associated with that feature, which the map viewer then displays. You can use Freemarker templates to override the default response. Freemarker allows you to read feature data, and supports simple loops and if-then-else statements, among other features.
This is a simple Freemarker template for the FeatureType you’ve configured that will display a road’s name, its MTFCC, and whether it is a divided road
<#list features as feature>
  <#if feature.MTFCC.value = "S1200" || feature.MTFCC.value = "S1100">
    <p><b>Road name:</b> ${feature.FULLNAME.value}</p>
    <p><b>MAF/TIGER Feature Class Code:</b> ${feature.MTFCC.value}</p>
    <#if feature.DIVROAD.value = "Y">
      <p>This is a divided road.</p>
    </#if>
  </#if>
</#list>
To use this template, copy it into a file and save it as $GEOSERVER_HOME/data_dir/featureTypes/FrederickCountyLines_fe_2007_24021_edges/content.ftl. In this case, you do not need to apply the change, as Geoserver will automatically use the new template the next time you query a feature in this FeatureType.
When it receives a query, Geoserver will run the feature (or set of features, in the case of an intersection, overpass, or the like) through this template as a list that the <#list> directive will iterate through. Individual feature instances contain the data for the feature you queried, which you can access through the dot notation seen above, or more generally, feature.FieldName.value. As with the style filters, references to the data fields in the FeatureTypes are case-sensitive, so feature.FULLNAME is different from feature.fullname.
With this template in place, if you click on a road in the map viewer, you’ll get just the information you specified, formatted as you desired, rather than the full table of data.
Conclusion
This is only a bare introduction to what Geoserver can do to help you present your data. Geoserver’s documentation has more details on map styling and the intricacies of label placement, and other features not touched on here, including how to serve raster data, such as satellite images, serving your data for download as well as display, and caching FeatureTypes for better performance.
Category:
- Internet & WWW


