Author: Dmitri Popov
Tools like phpMyEdit allow you to create a quick-and-dirty front end to a database, but what if you need to publish a spreadsheet or BibTeX file on your Web site and give your visitors the ability to dynamically sort, filter, group, and visualize the published data? For that, you can turn to SIMILE Exhibit, an impressive data publishing framework that uses plain old HTML, CSS, and a bit of JavaScript to create Web pages with support for sorting, filtering, and data visualization. Exhibit requires neither database nor server-side coding wizardry, and you can master the tool in no time, even if you don’t have any programming experience.
SIMILE Exhibit stores data in the JSON format, so you must convert your data source into a JSON data file before you let Exhibit work on it. The format is pretty straightforward; you can figure out its inner workings by just looking at it. Here, for example, is an entry from a Nobel Prize Winners data file:
  {
      "items" : [
          {   type :                  "Nobelist",
              label :                 "Robert A. Mundell",
              discipline :            "Economics",
              shared :                "no",
              "last-name" :           "Mundell",
              "nobel-year" :          "1999",
              relationship :          "alumni",
              "relationship-detail" : "MIT Ph.D. 1956",
              imageURL : "http://nobelprize.org/nobel_prizes/economics/laureates/1999/mundell_thumb.jpg"
          }
      ]
  }
This sample doesn’t really need any further explanation, but if you want to gain a better understanding of the basic principles of Exhibit’s database format, look at the Understanding Exhibit Database wiki page.
Although you can use a text editor to create a data file from scratch, it’s not the best way to go if you need to convert a spreadsheet or a BibTeX file. Fortunately, the SIMILE project offers the useful Babel conversion tool, which does all the donkey work for you.
To see how easy it is to work with SIMILE Exhibit, let’s take a sample BibTeX file and publish it on the Web. Download the BibTeX file, and point your browser to the Babel converter. Select BibTeX in the From Format section and Exhibit JSON from the To Format section. In the Convert Files section, select the BibTeX file, and press the Upload and Preview button. This opens a new preview window in which you can see the converted data. Press the Copy Raw Data button and copy the data. Create a new text file, paste the copied data into it, and save it with the .js extension (e.g. bib.js). Next, create a new HTML file (e.g. bib.html) and insert the following code into it:
  <html>
      <head>
          <title>BibTeX Bibliography</title>

          <link href="bib.js" type="application/json" rel="exhibit/data" />
          <script src="http://static.simile.mit.edu/exhibit/api/exhibit-api.js"
              type="text/javascript"></script>

          <style>
              body {
                  margin: 1in;
              }
          </style>
      </head>
      <body>
      <h1>BibTeX Bibliography</h1>
      <table width="100%">
          <tr valign="top">
              <td>
                  <div id="exhibit-control-panel"></div>
                  <div id="exhibit-view-panel"></div>
              </td>
              <td width="25%">
                  <div id="exhibit-browse-panel"></div>
              </td>
          </tr>
      </table>
      </body>
  </html>
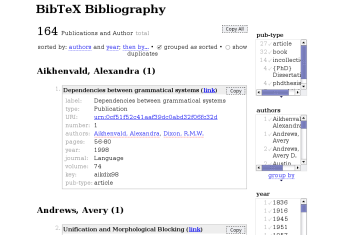
Save the file, open it in Firefox, and you should see the bibliography data.
All the publishing magic is done by two code blocks in the HTML file. The first code block points to the bib.js data file and calls the exhibit-api.js script, which does all the heavy lifting:
  <link href="bib.js" type="application/json" rel="exhibit/data" />
  <script src="http://static.simile.mit.edu/exhibit/api/exhibit-api.js"
 type="text/javascript"></script>
The code inside the table delimiters displays the actual data and controls the way it is presented and managed:
  <div id="exhibit-control-panel"></div>
  <div id="exhibit-view-panel"></div>
  <div id="exhibit-browse-panel"></div>
Once you’ve published the bibliography, you can add sorting and filtering options that allow you to view and analyze the data by specifying so-called facets (which are basically filters). Look at the bib.js data file; each item has a set of fields such as pub-type, author, and year. You can create facets based on these fields by modifying the <div id=”exhibit-browse-panel”> element in the bib.html file as follows:
<div id="exhibit-browse-panel" ex:facets=".pub-type, .author, .year"></div>
Reload the file, and you should see three boxes with the specified facets. You can filter the displayed data by clicking on the desired facets. For example, if you want to see a list of all articles, simply click on the article facet in the pub-type box. Better yet, you can select multiple facets from different boxes, so you can, for example, view all the articles written by a certain author in a given year.
By default, the published bibliography is sorted by the label field, but you can easily specify a custom sorting order inside the <div id=”exhibit-view-panel”> element. For example, if you want to sort the bibliography by author and year, the sorting code will look something like this:
  <div id="exhibit-view-panel">
     <div ex:role="exhibit-view"
     ex:viewClass="Exhibit.TileView"
     ex:showAll="true"
     ex:orders=".author, .year"
     ex:possibleOrders=".label, .type, .publisher">
     </div>
  </div>
Note the ex:possibleOrder option, which you can use to specify additional sorting options.
Besides different sorting and filtering options, SIMILE Exhibit also provides an impressive way to visualize published data as a time line. This component is based on another SIMILE project called SIMILE Timeline that allows you to map data on an interactive time line widget. Publishing your bibliography database as a time line requires two things. First, you have to modify the link to the exhibit-api.js script by specifying the time line view as follows:
  <script src="http://static.simile.mit.edu/exhibit/api/exhibit-api.js?views=timeline"
  type="text/javascript"></script>
Next, you have to specify the required time line options inside the <div id=”exhibit-view-panel”> element:
  <div id="exhibit-view-panel">
     <div ex:role="exhibit-view"
     ex:viewClass="Exhibit.TimelineView"
     ex:start=".year"
     ex:marker=".pub-type">
     </div>
  </div>
In this case, the time line maps bibliography entries based on their type. Each entry is displayed as a blue dot with an accompanying title, and when you click on it, you can see the entry’s detailed info in a pop-up window.
Final word
This article barely scratches the surface of SIMILE Exhibit’s capabilities. To get the most out of this nifty tool, visit the project’s wiki, which, among other things, provides a few interesting examples, such as using Exhibit to pull data from Google Spreadsheets as well as map the published data with Google Maps. There is also a detailed description of how to use SIMILE Exhibit offline (e.g. on your local machine or CDs and DVDs).
Category:
- Internet & WWW


