Author: Nathan Willis
Ever wondered what takes your Linux box so long to boot up? You can see for certain with the Bootchart package. Bootchart logs the entire startup process and produces a clean, graphical representation of its results suitable for everything from troubleshooting to good old-fashioned bragging rights.
Bootchart is a common utility, so check your distribution’s package management system first to see if it is available. If not, the Bootchart download page provides links to the official packages for Debian, Ubuntu, Gentoo, SUSE, and Mandriva. You can also download source code in an RPM or tarball from bootchart.org. The package contains installation and uninstallation scripts and compilation instructions.
The tool consists of two pieces: the logging daemon bootchartd and a command-line utility that converts the log file into human-readable output chart. If you compiled the package from source, you will need to append the argument init=/sbin/bootchartd to your kernel command line in /boot/grub/menu.1st in order to make the kernel start the logging daemon in place of the normal /sbin/init initialization script. The logging daemon in turn calls /sbin/init itself, so no other part of the boot process requires alteration.
Once running, bootchartd logs the start times and process states of every other running process, as well as CPU load, disk activity, and other statistics. As soon as it detects the KDE Display Manager or GNOME Display Manager greeter, it stops logging and bundles the result in /var/log. The Bootchart documentation says that the log is named /var/log/bootchart.tgz, but on Ubuntu the log is saved as a time-stamped file inside the directory /var/log/bootchart/ — check your distro’s documentation if neither location matches what you see.
Worth a thousand words
The utility that renders bootchartd’s log file into a snazzy graphical chart is called bootchart. It is a shell script that uses — believe it or not — Java. Distro-provided packages may run bootchart automatically, saving you the trouble of remembering to do so, but you can also run the script manually on your log file. Finally, the Bootchart site has an online Web renderer that can generate a chart from your log file, in your choice of file formats.
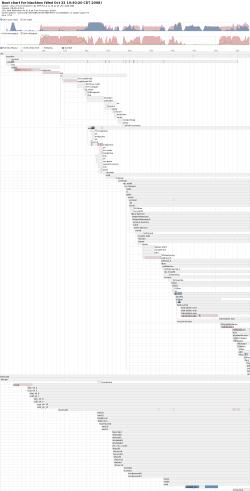
The resulting visualization is a Gantt chart, showing time on the horizontal axis, and the various processes stacked vertically. They are sorted to show dependency, and color-coded to indicate CPU utilization and disk usage.
This chart is from my Ubuntu 8.04 machine, which takes just under a minute to boot completely. If I were not satisfied with that, I could look for unusual points in the chart. From seconds 43 to 51, for example, I see unusually high CPU load. Looking through the processes on the Gantt chart, this appears to be the cx25840_fw module, for the Hauppauge video capture card used by the MythTV back end running on this machine. I’ll have to check and see if I need that module, considering the time it consumes, and check the other system logs to figure out if it is struggling to load because of some misconfiguration.
Similarly, I can see that CUPS and Tor are consuming lots of time. Since this particular machine is used only by me, I could reclaim some time by starting up one or both of those at login, rather than at boot time. Unlike MythTV’s back end, I only need them when I am logged in and working.
It’s best not to start messing with the startup process unless you know what you are doing, but let’s be real: fouling up your Linux box then figuring out how to fix it again is a longstanding tradition. And admit it — weren’t you just a little bit jealous when Arjan van de Ven and Auke Kok demonstrated a tweaked Asus Eee PC booting to a working desktop in less than five seconds? Installing Bootchart and studying your own system’s startup is the first step toward such optimization and the bragging rights that follow.
Categories:
- Tools & Utilities
- System Administration


