
Author: Brian Jones
result of switching my desktop from Fedora to SUSE 9.1, but KSysguard has apparently been around since the KDE2 days.
This app has absolutely nothing to do with guarding anything. KSysguard lets you manage processes and monitor resources on
local or remote systems. According to the documentation, it can be built
on Solaris, BSD, and Linux.
KSysguard is actually two applications; a GUI front end, where you can configure
sets of worksheets to represent different machines or different monitoring
scenarios, and a backend daemon which essentially feeds data to the front end.
The back end daemon can be started at boot time or invoked manually from the
front end, even if the daemon is on a remote host.
The GUI front end, by default (on SUSE 9.1, anyway), starts up with two sample
worksheets configured for you, browseable with a tabbed interface. On
the left is a tree view of the different hosts you’re connected to, and
expanding those trees gives you a view of what sensors are available for
them. Figure 1 gives you a view of the KSysguard workspace. Note the tabbed
interface on the right, where I have several worksheets configured, while the
tree view on the left shows a good number of sensors I have access to on my
local machine.
Going beyond defaults
Surprisingly, I found connecting to remote hosts and creating new
worksheets in the workspace to be very easy. There are various methods of
connecting to a remote host; the interface even lets you issue a “custom
command” to connect with. What I found easiest in my environment was to use
SSH (with SSH keys, by the way). The command I issued to talk to a test box
named opus, for example, was ssh opus ksysguard. Once the command is run,
a tree for opus appears in the left pane, and I can browse the available
sensors on opus.
To put these sensors to use, I need to create a worksheet. This couldn’t
be easier. Simply click the New icon to invoke a dialog
asking for a name for the worksheet, the number of rows and columns to
create, and the update interval. Fill this out, click OK, and you’re presented
with an empty worksheet, with empty table cells waiting to be used. Now, browse
the tree view for a sensor you want to use, and click and drag it into
whichever cell you want that sensor to appear in. If the sensor you’re using
doesn’t have “Table” in its name, you’ll be asked how you want it to look. The
choices are “Signal Plotter,” “Multimeter” (which is just a digital number
representing the value returned by the sensor), “Bar Graph,” and “SensorLogger.”
I haven’t found a use for these last two, but feedback from more experienced users is welcome, and
hereby solicited. The colors used and the ranges measured by each sensor are customizable.
| Click to enlarge |
In the first figure you probably noticed that there are three measurements being taken
in the “Physical Memory” cell. This is a result of dragging three separate
sensors into a single cell. This is probably not useful for many sensors,
especially if the value ranges vary greatly, which can make the output a little
hard to read. Experiment with this and you’ll find some useful combinations
that’ll save you some real estate on each worksheet.
For many of the sensors, and on most hosts, it should be simple enough to
create a 3×6 worksheet and drag 18 different sensors into the cells, pick
“Signal Plotter” as the view type, and you’re on your way! However, there are a
couple of sensors that should probably have their own worksheets. For example, on machines
that have a lot of users or a lot of processes, you’ll probably want to use the
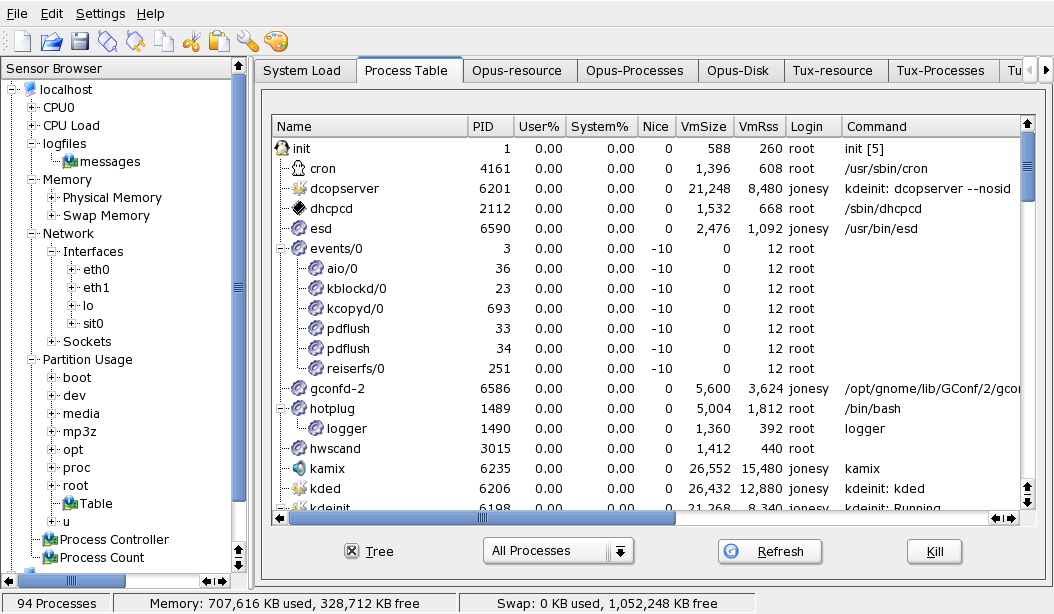
“Process Controller” sensor in its own worksheet. This very useful sensor is
essentially a GUI version of the top command. You can sort by any field
(finding resource hogs has never been easier), see a tree view of the
processes, and even filter the list to view only your processes, system
processes, or user processes. Since you can’t use your space bar to update the
view (a la top) there’s a refresh button, and there’s also a “kill” button.
If you’re running KSysguard as a normal user, of course, you can only kill
processes you own. The figure below shows the process control worksheet for my local
machine in “tree” mode.
| Click to enlarge |
Room for improvement
While I’ve started using KSysguard on a regular basis, and I recommend it to
others, there’s room for improvement. For one thing, this being a KDE
application, it would make sense to integrate it with KPopUp and
allow for alerts to be issued at certain threshholds, since it’s not
possible to view every sensor cell for every machine in a single worksheet.
Alternatively, maybe the developers could build a “Summary” worksheet so that these alerts
could simply be listed there, in a logview-type format. Also, it would be
useful to be able to configure color changes based on thresholds in the
signal plotter views. For example, I’d like my System Load signal plotter
sensors to turn orange if the load creeps beyond, say, 6, and red if it goes
over 10.
There are minor annoyances in the application, but they’re mostly
annoying only when you’re first getting started using it. For example, if you
drag two sensors to a cell, then discover that was not a stellar move on
your part, you can’t simply drag one sensor away from the cell — you have to
remove the sensor from the cell completely and start over. I understand why
this is the way it is, but it would be good if there were a friendly way of
reconfiguring a cell without starting over.
None of the abovementioned issues have kept me from
using KSysguard. What’s there works;
I’d just like more power. What kind of admin would I be if I wouldn’t? In the
end, I think that as the program develops and evolves, it will become an
extremely powerful tool. I highly recommend you check it out!


