Author: Shashank Sharma
My dad has been pestering me for some time to find him an open source tool that he could use to follow the market trends. He’s been thinking about investing a little something in the market, but not without due diligence. Grism, written in Ruby, is the tool my dad now uses to easily follow the changing market trends. It allows you to create watchlists and portfolios and offers charts to help you gauge the performance of particular stocks.
At the heart of Grism lies the YahooFinance Ruby module, which enables Grism to draw stock quotes from Yahoo! Finance. Grism has an extensive dependency list that includes Ruby, GTK+ 2.8, ruby-gtk2, and ruby-libglade2. Once you’ve installed these, download the latest tarball and run the command: tar zxvf grism-0.9.0.tar.gz. Browse into the newly created grism-0.9.0 directory and run the setup.rb script: ruby setup.rb.
You can then launch Grism from the terminal with the command grism, or, depending on your distribution, access it from Applications -> Office menu.
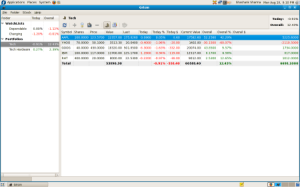
When you launch Grism, you’ll see empty Watchlists and Portfolios on the left-hand sidebar. You can create as many watchlists as you want, and each watchlist can have any number of entries. You can create a new watchlist by clicking File -> New Watchlist.
After providing a name and brief description for your watchlist, you can begin to populate it with stock or mutual fund symbols. To create a new entry, click Stock -> Add Item. In the Watch List Entry dialog-box, type in the stock symbol and then specify the price of the stock. If you click the Use current market price check-box, Grism will draw the latest quote from Yahoo! Finance and use that for the entry. Unfortunately, this is where I find Grism slightly lacking, since it doesn’t inform users of stock symbols. So, to create an entry for Google or Yahoo! or Apple Inc., you have to go to the Yahoo! Finance Web site and look up the stock symbols before you can create new entries in your watchlist.
If you wish to monitor the progress of Apple’s stock, type AAPL in the Symbol field and click OK. When the market’s open, you’ll be able to see the change, previous close, and other details for this stock. If you want more details, such as the MarketCap and Dividend, click the magnifying glass icon to switch to the extended view.
Creating new portfolios is just as easy. Click New -> Portfolios and specify a name in the Portfolio Properties dialog-box. As with watchlists, Grism allows for multiple portfolios, and you can have any number of entries in each. To create a new entry, click Stock -> Add Item. After typing in the symbol for the stock, you’d have to specify whether you wish to buy or sell, so click on the appropriate radio button. Next, specify the number of shares you wish to trade. Click the “use current market price” check-box if you wish to buy or sell your shares at the market price, or type in the amount of your choice in the Price field. You can also enter the Transaction Cost in the Add to Portfolio dialog box.
When the markets are open, click Folder -> Refresh to get the latest quotes. Grism will show the change in the stock price for the current day, and the overall change from the time you created the new entry.
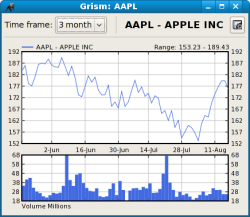
To check the performance of your stock, click Stock -> Chart. By default, Grism draws the chart for a one-year time period, but you can select a time period anywhere from a week to 10 years by clicking the drop-down list. Grism draws only two items on the charts, the stock price and its volume. To export the chart, click the icon on the top right of the window. Unfortunately, Grism exports the charts only to a PNG image, but it allows you to specify the dimension for the image.
You can move entries from one portfolio or watchlist to another. Once you’ve selected an entry in your watchlist or portfolio, click Stock -> Move to, and select where you wish to move it from the list. Grism also keeps a record of all your transactions, so you can click the Portfolio History icon for details of what shares you’ve bought and sold, at what prices and on what dates. Grism records all data in the ~/.grism directory.
As of now, Grism can only draw quotes from Yahoo! Finance, and there’s no easy way to change this, since, according to developer Nicholas Rahn, “the yahoofinance module is ‘hardwired’ into the Grism code.”
Conclusion
Grism is a great tool to familiarize yourself with the market before you take the plunge, and also to keep track of your actual investments, but it does have some minor quirks. These include its inability to suggest symbol names for stocks, and the fact that when you click Stock -> Refresh, Grism doesn’t draw the latest quotes for all your portfolios and watchlists, but just the one that you have selected. Also, the quotes Grism draws from Yahoo! Finance are delayed 15-20 minutes. Despite these issues, I find Grism a useful tool for anyone interested in financial markets.
Categories:
- Reviews
- Desktop Software


