Author: Ben Martin
Umit is a user-friendly graphical interface to Nmap that lets you perform network port scanning. The utility’s most useful features are its stored scan profiles and the ability to search and compare saved network scans. A profile lets you configure how a network scan is performed, change the source information for the scan, and explicitly nominate hosts to include or exclude from the scan, as well as various more advanced options.
Umit is packaged for Ubuntu Intrepid but not for Hardy, and not for Fedora or openSUSE. I built version 0.9.5 of Umit from source on a 64-bit Fedora 9 machine on which version 4.53 of Nmap was installed.
Umit is written in Python and uses the GTK+ toolkit for its graphical interface, so you need Python, GTK+, and the GTK+ Python bindings to be installed as well as Nmap. You also need to install the PySQLite2 Python bindings to SQLite. Installing Psyco, a specialized Python compiler that can speed program execution, is optional, but I recommend it. All are easily installed; for Debian/Ubuntu systems the Umit site recommends using the command apt-get install nmap python2.4 python2.4-gtk2 python2.4-pysqlite2 python2.4-psyco. A Fedora 9 machine will likely have most of the dependencies already installed, perhaps requiring only python-sqlite2 and python-psyco to be installed: yum install pygtk2 python-sqlite2 nmap python-psyco.
Once the dependencies are installed, getting Umit itself onto the system follows the normal setup.py invocation process:
$ tar xjvf /.../umit-0.9.5.tar.bz2
$ cd umit*
$ sudo python setup.py install
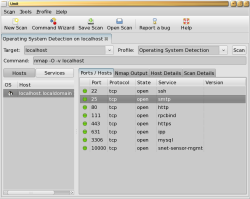
To start testing Umit, execute umit, type in localhost in the Target field, and press the Scan button. You should see a window similar to the one in the screenshot below. Just below the toolbar is a tabbed interface showing what profile was used to scan what host (the Target). In this case, we used the default Operating System Detection profile and explicitly nominated localhost as the Target to scan.
If you want to run another scan, press the New Scan button or use the Control-T hotkey to create a new tab first. When you create a new tab, the Target field has focus automatically, allowing you to start a new scan without having to use the mouse. Once you type in the target, pressing Enter takes you to the Profile selection, where the up and down keys allow you to pick your profile. Pressing Enter again starts the scan. You can also use the mouse to select your profile, but it is nice to see an application that lets you use the keyboard only. One abnormality I found here was that when you first start Umit the New Scan button has focus rather than the Target field, but Target does have focus when you hit Control-T to get a new tab.
You can view the results of a scan either by host or service. Because I scanned localhost in the above test, it makes the most sense to view the results by host. If you are scanning an entire network, you might like to view by service by clicking the Services button in the middle left side of the window. Clicking the Services button changes the listview on the left side of the window to show a list of services; when you select each service, the Ports/Hosts list on the right side of the window shows you which hosts on the network have that service available.
The Nmap Output tab in the middle of the screen lets you see the output that Nmap would have presented on the console. The Host Details tab lets you see information that includes how many ports were scanned for the host, and how many ports were closed, filtered, and open. If you perform an operating system detection scan you will also find the operating system information displayed in this tab. The Scan Details tab lets you see the Nmap command used for the scan and what Nmap version was used. You can see when the scan was started, when it finished, how many hosts were scanned, how many of those were up and running, and totals for the number of open ports for the entire scan.
When you save a scan, Umit saves the Host Details and Scan Details information, along with the list of hosts and ports that were found during the scan. The Scan menu shows a list of recently saved Scans, allowing you to quickly jump back into your recent scans.
The Profile menu includes several options for the profile that is selected in the current Scan tab — namely New Profile with Selected, Edit Selected Profile, and Delete Selected Profile. Being able to build new profiles from existing ones is an extremely useful option; it allows you to tweak the existing port scanning profiles to include customizations.
The Tools menu contains Command Wizard, Compare Results, and Search Scan Results menu items. The Command Wizard is also available from the Toolbar. I couldn’t see a huge difference between the Command Wizard and selecting New Profile from the Profile menu. The first page of the Command Wizard allows you to select either novice or expert mode. The main differences between them is that novice mode has some options omitted, and expert mode presents all the options as tabs in a single dialog window, whereas novice mode presents the same tabs in succession, and you must click Back and Forward to progress through each page.
In Expert mode, the Profile tab of the Command Wizard allows you to set the name and other descriptive data for the Profile. The Scan tab lets you configure how the scan is performed and what sort of timing and retries are used. The Ping tab lets you set how and whether Nmap uses ping during the scan. The Target tab lets you exclude hosts or networks or explicitly set hosts using an external file. Normally Umit will ask you for the hosts or networks to scan when you are about to perform a network scan using a profile; being able to exclude a few hosts explicitly as part of the profile might be handy so that the profile itself blocks attempts to scan, say, a firewall machine that might get angry if you accidentally scanned it. The Other tab contains some options that don’t neatly fit into other tabs, such as whether you want your IP packets fragmented, or to explicitly nominate a time to live for packets. The Advanced tab contains timeouts and the number of certain jobs that you will allow to execute in parallel.
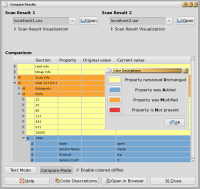
The Compare Results option from the Tools menu allows you to see the differences between two scans in a tree view. The color-coded rows let you see what has been added, modified, or removed between two saved scan result sets. In the results below, I started the MySQL daemon between the first and second scan of localhost.
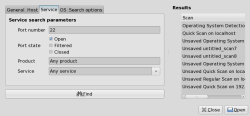
The Search Scan Results option in the Tools menu lets you scan all your current Scan tabs for results based on the profile, host or network name; IP or MAC address; port number and whether that port is open, filtered, or closed; and the operating system running on the machine. You can also search saved scan results. A search for SSH daemons is shown below.
The ability to save and show the differences between two port scans in a color-coded interface lets you see at a glance whether anything has changed in your network port filtering. Being able to search saved network scans on fairly broad query parameters is also a convenient feature. The ability to quickly create new profiles based on others and save and load network scans makes Umit a nice tool for both initiating network scans and for later analysis.
Categories:
- System Administration
- Networking


