
Author: JT Smith
To get started with kSar, head to the SourceForge.net download page. The most recent release, 4.0, came out on February 5, but the kSar site still shows kSar v3.
Since kSar is a Java application, you’ll need to have Java installed — preferably Sun Java. To run kSar, all you need to do is run java -jar kSar-4.0.0.jar.
After kSar starts up, you can start graphing sar results. If you have sar running on your local machine, you can do a quick test with kSar by going to its File menu and selecting Run local command. The default is sar -A, but any valid sar command should work just fine. For instance, if you’d like to see your system performance in almost real time, you could choose sar -A 1 120 to display all available system data with an update every second for 120 seconds; the first number after sar’s other arguments is the interval — in this case one second — and the second number is the number of times sar should update before exiting.
Another way to go is to view past data. On Ubuntu and Debian systems, sar stores its data in /var/log/sysstat with the data for individual days stored in the format saXX, where XX is the day of the month. For example, if you want to see system data from the 15th, you could tell kSar to parse the file for the 15th:
sar -A -f /var/log/sysstat/sa15
The -f option tells sar to read from a specified file. You can run that as a local command, or if you like you can save sar data as a text file that can be read by kSar. To do this, you’ll need to export one variable first:
export LC_ALL=C
Then, run sar -A -f /var/log/sysstat/sa15 > sardata.txt
To load the data in kSar, go to File -> Load from text file… and select the sardata.txt file.
|
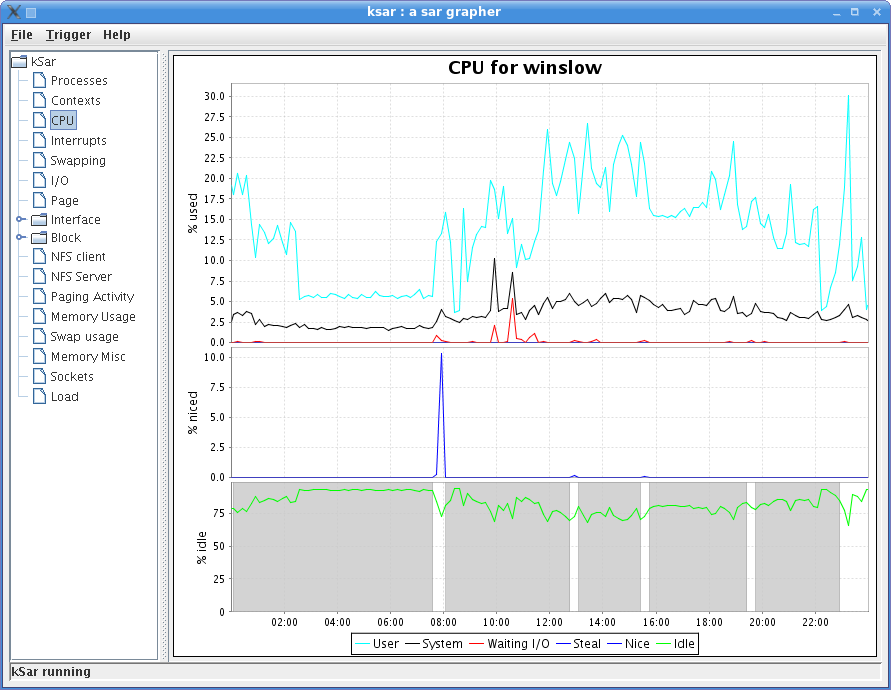
kSar displaying CPU usage – click to view |
What if one day’s data is not enough? No problem — you can append data to the text file to get kSar to present multiple days:
sar -A -f /var/log/sysstat/sa16 >> sardata.txt
Graphing remote hosts
kSar would be pretty useless if it could only produce graphs of sar data from the host it’s running on, but that’s not the case. You can use kSar to connect to remote systems via SSH and run sar to generate data.
To connect to a remote host, go to File -> Launch SSH command… and kSar will prompt you for the username and host, then password, and then for the sar command you want to run. kSar doesn’t pick up on SSH keys, so you’ll need to enter a password to log in using SSH with kSar, even when you have it configured to use a key to log in to the remote host normally.
Narrow the range
Running sar -A will generate a report from 00:00:01 to the current time. If you want to narrow this down a bit, you can go to File -> Select time range… and then select the range of data that you want to focus on. You can select the time range in five-minute increments. For instance, you might want to view the data from 00:15:01 to 01:35:01. This can be useful if you want to drill down on a range of a couple of hours.
|
kSar select time range – click to view |
It’s also useful if you’re trying to generate a report that only focuses on a short time period. For example, let’s say that you’re producing an after-incident report for a hosting customer who had server downtime, and want to demonstrate the system load at the time the server failed. kSar will let you drill down to a specific time window (assuming, of course, that you were collecting data at that time) and then generate a PDF report.
Save your reports
To generate a report as a PDF file, just go to File -> Export to PDF…, provide the filename you’d like to use for the finished report, and select the graphs you’d like to include in the report. If you just want system load data, for instance, you can unselect all of the rest of the data and simply focus on that.
You can change the way the report looks by right-clicking on the graph and selecting Properties from the context menu. Here you can change the title, font, colors, and other properties of the data display.
Sometimes a report is too much. If you only want to keep a single graph, you can save it as a PNG file. Just right-click on the graph and select Save As from the context menu, choose a name for the saved file, and click Save.
Finally, in version 4.0 kSar includes a feature to check for new versions. Just go to Help -> Check for update and kSar will check in to see if any new versions have been released.


