
Author: Anže Vidmar
Zabbix is a server-agent type of monitoring software, meaning you have a Zabbix server where all gathered data is collected, and a Zabbix agent running on each host. Note that you can have more than one Zabbix server installed, but you cannot consolidate data from multiple servers in one single central server. All Zabbix data, including configuration and performance data, is stored in a relational database — MySQL, PostgreSQL, or Oracle — on the server. Zabbix server can run on all Unix/Linux distributions, and Zabbix agents are available for Linux, Unix (AIX, HP-UX, Mac OS X, Solaris, FreeBSD), Netware, Windows, and network devices running SNMP v1, v2, and v3.
Zabbix is easy to install and configure. You can download source code from the Zabbix site, or install the software from a binary package if you’re using Debian, Ubuntu, Fedora, Gentoo, or FreeBSD. To successfully install the Zabbix server you need to run Apache (with PHP extensions) and a supported database server. Installation is relatively easy as long as you have all the requirements met and you follow the step-by-step documentation. If you plan to run the Zabbix server on a Linux Debian server, I recommend reading this manual. Running Zabbix server starts by default 15 processes, using a total of 34MB of RAM and around 1.5% of processor power.
Installing Zabbix agent on a host is easy and takes only a few minutes. You can compile and install the agent yourself, you can install it from a distribution repository, or you can download precompiled binaries for your distribution. The Zabbix agent starts six processes by default and uses around 3MB of RAM and 0.1% of processor power. Network traffic for communicating with server is minimal — a matter of bytes, not kilobytes.
Features
Zabbix provides distributed monitoring in real time with centralized Web administration. It allows you to see any host’s “health” on your network from a single point of entry. Performance monitors includes everything from host memory, processor, and swap space usage to free disk on all mounted partitions, running processes, disk read/write operations, and more. Zabbix lets you avoid connecting to each host in order to see its health.
You can see your network’s health status at any time from any machine on the network by opening a Web browser and pointing it to http://yourserver/zabbix/ to invoke the administration console. You’ll need to type in your ID and password in order to access the data.
SNMP graphs present a specific monitored component on the host. Zabbix gives you two choices for viewing a graph: for each host component (e.g. processor load, memory usage, disk usage, and so on) separately, or one showing multiple host components from multiple hosts together. This is useful when you want to monitor only the mission-critical components on specific hosts — for example, disk capacity on file and FTP servers. Setting up such a graph is easy — just go to Configuration -> Graphs and select the “New Graph” option. After naming it, you will have a new option to edit the graph. In Edit menu you have an “Add item” button where you can configure parameter, type, function, and coordinates of the new item. By clicking the Save button, your new graph will show up and you can start monitoring the selected components.
| Click to enlarge |
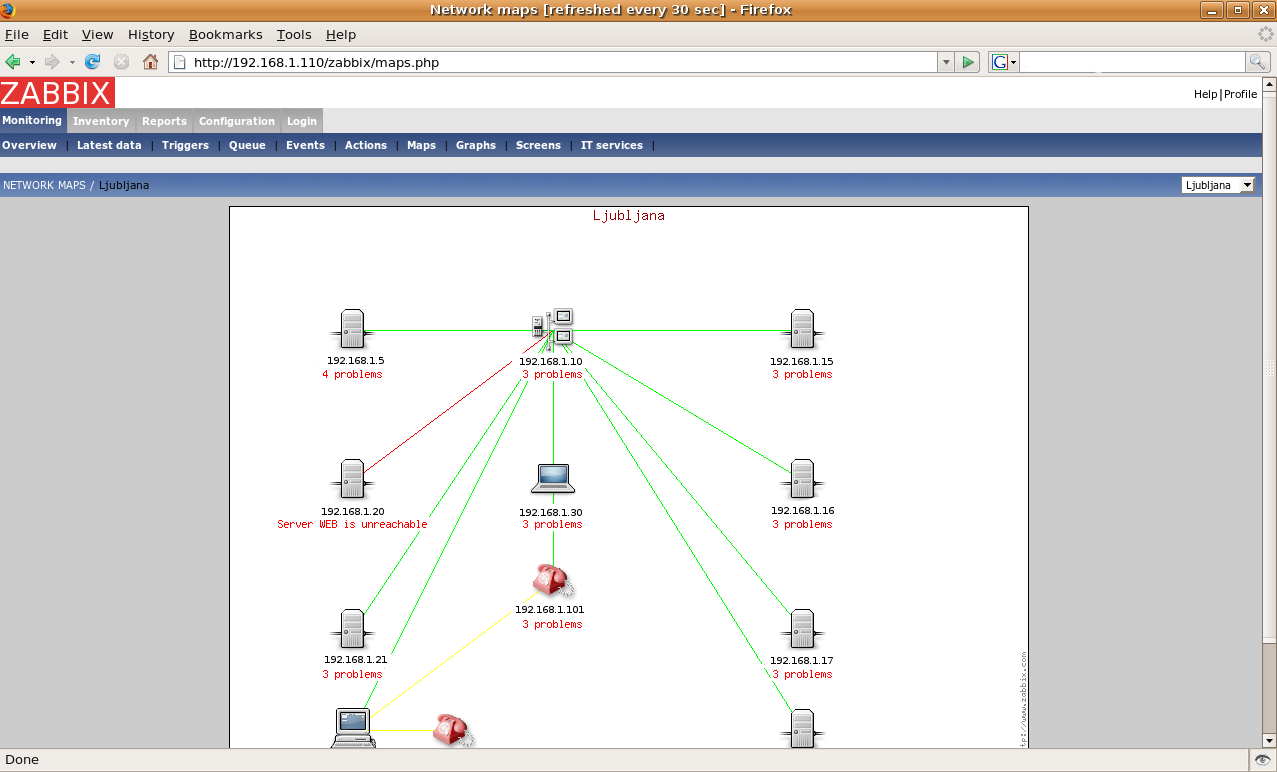
Zabbix can draw network graphs and mark host errors on them. You only need to specify the hosts’ IP addresses and where in the graph (coordinates) you want a specific host to appear, and Zabbix will do the rest for you. You can define how hosts are linked together in the graphs and choose a specific color for each link to indicate whether a host is up or down. When the graph is completed and filled with all your hosts and network devices, below every element in the graph you can see the number of potential problems on that host/device, and review the problems by clicking on its icon.
The software not only offers great monitoring — it also provides great alerting capabilities. Note that you can set a threshold for variables as well. When a specific event happens on a host, Zabbix can alert an administrator via email or external messaging devices such as SMS messages. Every alarm and alert is logged, so if you miss an email or SMS message, you can find the history of alerts in the Zabbix monitoring log in the administration console.
There are quite a few report types available in Zabbix. “Status of Zabbix” shows you if the server if running, how many hosts are monitored, and the number of triggers, items, alarms, and alerts. “Availability report” shows you general statistics (in text and graphs) of a specific host. For example, for the selected host it shows you the percentage of availability of each host component, specific network service (HTTP, FTP, SMTP) status, etc. “Most busy triggers top 100” presents the triggers that has a largest activity on the hosts. For example, changing state of services, running out of disk space, lack of physical memory, etc. If you have a server that is rebooted on a daily basis, you’re going to see all the services running on that server on that list for sure.
Zabbix provides configuration auditing for all types of configuration changes — the changes made to Zabbix configuration and the changes made to hosts and devices. When a user changes something, it is immediately logged in the Audit log, which can be viewed under the Configuration -> Audit menu in the administration console. This is useful when you’re among several administrators using Zabbix and you want to track all new activities that occurred since you last logged in. Auditing information includes the ID of the user that logged into the Zabbix administration console, the resource that was modified, what action was made, and some additional details regarding the specific event, such as what new host was added or how is host A linked to host B.
Support for Zabbix comes two ways: Free support that is available through online documentation, Zabbix forums, IRC support channel, or mailing lists, and commercial support that is available in four different levels — Bronze, Silver, Gold, and Platinum — which differ in the number of incidents, type of support (Web, phone, or email), and response times offered. Zabbix also provides partners for local support in many countries.
Conclusion
Implementing Zabbix may take quite some time, especially if you have a large number of hosts. Configuring the Zabbix server exactly as you want it takes even longer. But once Zabbix is set up and the agents are in place, monitoring your network becomes a lot easier. Zabbix frees you from spending time discovering network and resource problems on your hosts and network.
Anže Vidmar is Linux/Unix and Windows system engineer,network administrator, and trainer.


