Home Blog Page 269

Future of the Firm

The “future of the firm” is a big deal. As jobs become more automated, and people more often work in teams, with work increasingly done on a contingent and contract basis, you have to ask: “What does a firm really do?” Yes, successful businesses are increasingly digital and technologically astute. But how do they attract and manage people in a world where two billion people work part-time? How do they develop their workforce when automation is advancing at light speed? And how do they attract customers and full-time employees when competition is high and trust is at an all-time low?

When thinking about the big-picture items affecting the future of the firm, we identified several topics that we discuss in detail in this report:

Trust, responsibility, credibility, honesty, and transparency.

Customers and employees now look for, and hold accountable, firms whose values reflect their own personal beliefs. We’re also seeing a “trust shakeout,” where brands that were formerly trusted lose trust, and new companies build their positions based on ethical behavior. And companies are facing entirely new “trust risks” in social media, hacking, and the design of artificial intelligence (AI) and machine learning (ML) algorithms.

The search for meaning.

Employees don’t just want money and security; they want satisfaction and meaning. They want to do something worthwhile with their lives.

New leadership models and generational change.

Firms of the 20th century were based on hierarchical command and control models. Those models no longer work. In successful firms, leaders rely on their influence and trustworthiness, not their position.

Read more at O’Reilly

How to Install OpenLDAP on Ubuntu Server 18.04

The Lightweight Directory Access Protocol (LDAP) allows for the querying and modification of an X.500-based directory service. In other words, LDAP is used over a Local Area Network (LAN) to manage and access a distributed directory service. LDAPs primary purpose is to provide a set of records in a hierarchical structure. What can you do with those records? The best use-case is for user validation/authentication against desktops. If both server and client are set up properly, you can have all your Linux desktops authenticating against your LDAP server. This makes for a great single point of entry so that you can better manage (and control) user accounts.

The most popular iteration of LDAP for Linux is OpenLDAP. OpenLDAP is a free, open-source implementation of the Lightweight Directory Access Protocol, and makes it incredibly easy to get your LDAP server up and running.

In this three-part series, I’ll be walking you through the steps of:

  1. Installing OpenLDAP server.

  2. Installing the web-based LDAP Account Manager.

  3. Configuring Linux desktops, such that they can communicate with your LDAP server.

In the end, all of your Linux desktop machines (that have been configured properly) will be able to authenticate against a centralized location, which means you (as the administrator) have much more control over the management of users on your network.

In this first piece, I’ll be demonstrating the installation and configuration of OpenLDAP on Ubuntu Server 18.04. All you will need to make this work is a running instance of Ubuntu Server 18.04 and a user account with sudo privileges.
Let’s get to work.

Update/Upgrade

The first thing you’ll want to do is update and upgrade your server. Do note, if the kernel gets updated, the server will need to be rebooted (unless you have Live Patch, or a similar service running). Because of this, run the update/upgrade at a time when the server can be rebooted.
To update and upgrade Ubuntu, log into your server and run the following commands:

sudo apt-get update

sudo apt-get upgrade -y

When the upgrade completes, reboot the server (if necessary), and get ready to install and configure OpenLDAP.

Installing OpenLDAP

Since we’ll be using OpenLDAP as our LDAP server software, it can be installed from the standard repository. To install the necessary pieces, log into your Ubuntu Server and issue the following command:

sudo apt-get instal slapd ldap-utils -y

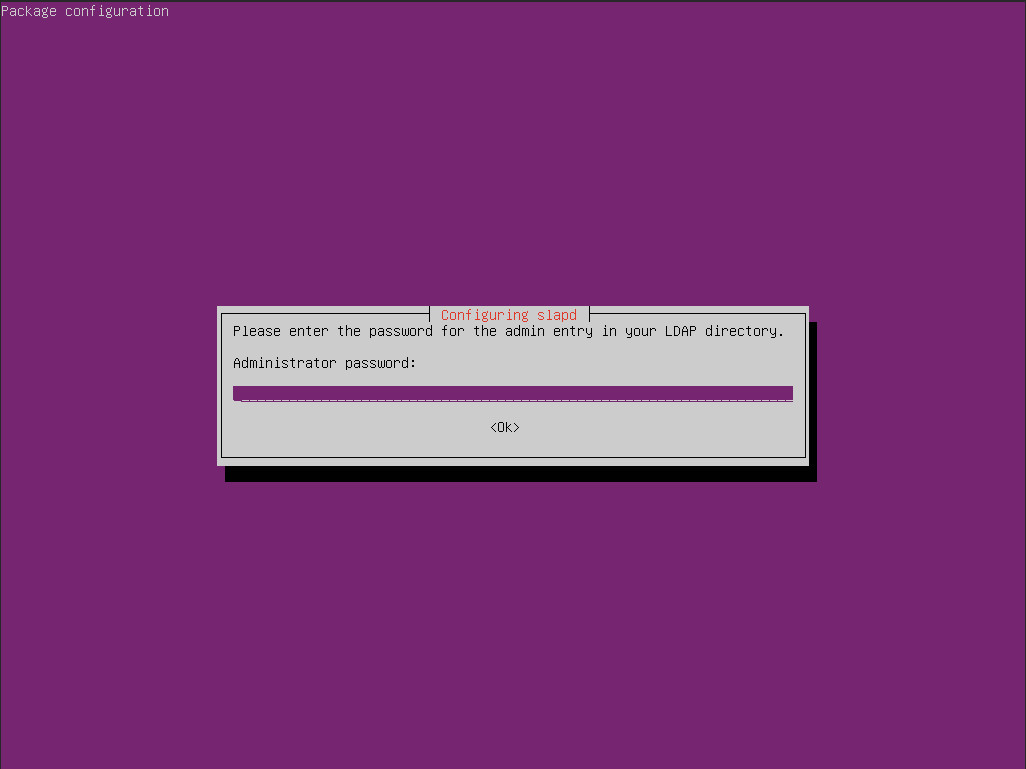
During the installation, you’ll be first asked to create an administrator password for the LDAP directory. Type and verify that password (Figure 1).

Figure 1: Creating an administrator password for LDAP.

Configuring LDAP

With the installation of the components complete, it’s time to configure LDAP. Fortunately, there’s a handy tool we can use to make this happen. From the terminal window, issue the command:

sudo dpkg-reconfigure slapd

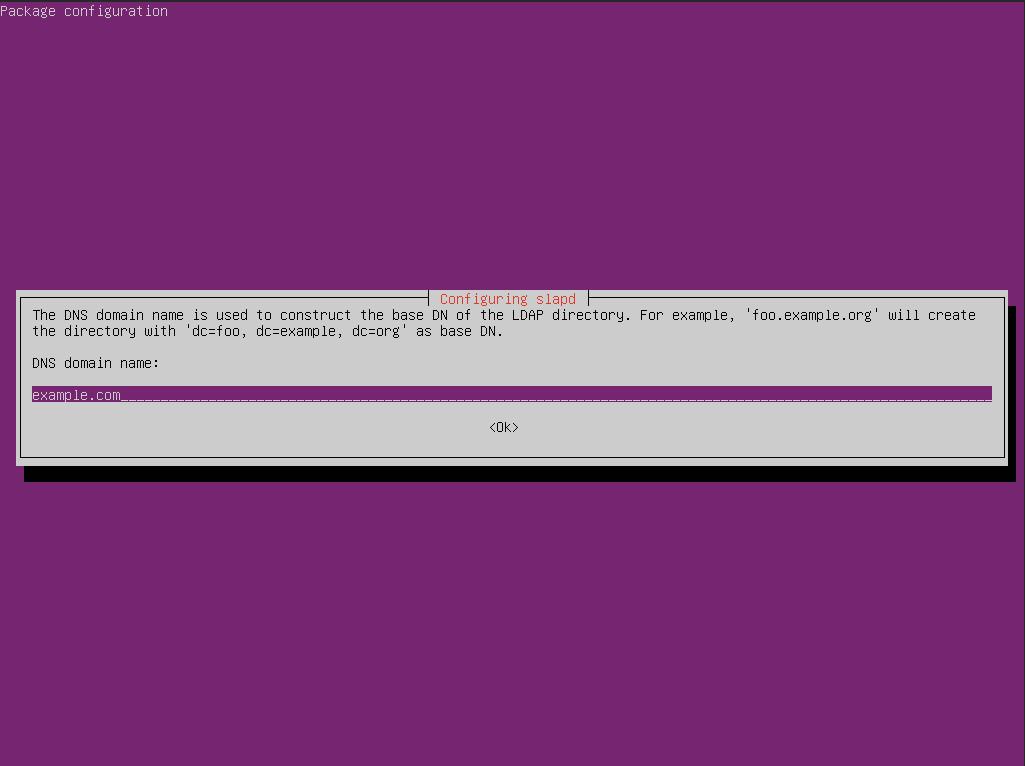
In the first window, hit Enter to select No and continue on. In the second window of the configuration tool (Figure 2), you must type the DNS domain name for your server. This will serve as the base DN (the point from where a server will search for users) for your LDAP directory. In my example, I’ve used example.com (you’ll want to change this to fit your needs).

Figure 2: Configuring the domain name for LDAP.

In the next window, type your Organizational name (ie the name of your company or department). You will then be prompted to (once again) create an administrator password (you can use the same one as you did during the installation). Once you’ve taken care of that, you’ll be asked the following questions:

  • Database backend to use – select MDB.

  • Do you want the database to be removed with slapd is purged? – Select No.

  • Move old database? – Select Yes.

OpenLDAP is now ready for data.

Adding Initial Data

Now that OpenLDAP is installed and running, it’s time to populate the directory with a bit of initial data. In the second piece of this series, we’ll be installing a web-based GUI that makes it much easier to handle this task, but it’s always good to know how to add data the manual way.

One of the best ways to add data to the LDAP directory is via text file, which can then be imported in with the ldapadd command. Create a new file with the command:

nano ldap_data.ldif

In that file, paste the following contents:

dn: ou=People,dc=example,dc=com

objectClass: organizationalUnit

ou: People


dn: ou=Groups,dc=EXAMPLE,dc=COM

objectClass: organizationalUnit

ou: Groups


dn: cn=DEPARTMENT,ou=Groups,dc=EXAMPLE,dc=COM

objectClass: posixGroup

cn: SUBGROUP

gidNumber: 5000


dn: uid=USER,ou=People,dc=EXAMPLE,dc=COM

objectClass: inetOrgPerson

objectClass: posixAccount

objectClass: shadowAccount

uid: USER

sn: LASTNAME

givenName: FIRSTNAME

cn: FULLNAME

displayName: DISPLAYNAME

uidNumber: 10000

gidNumber: 5000

userPassword: PASSWORD

gecos: FULLNAME

loginShell: /bin/bash

homeDirectory: USERDIRECTORY

In the above file, every entry in all caps needs to be modified to fit your company needs. Once you’ve modified the above file, save and close it with the [Ctrl]+[x] key combination.

To add the data from the file to the LDAP directory, issue the command:

ldapadd -x -D cn=admin,dc=EXAMPLE,dc=COM -W -f ldap_data.ldif

Remember to alter the dc entries (EXAMPLE and COM) in the above command to match your domain name. After running the command, you will be prompted for the LDAP admin password. When you successfully authentication to the LDAP server, the data will be added. You can then ensure the data is there, by running a search like so:

ldapsearch -x -LLL -b dc=EXAMPLE,dc=COM 'uid=USER' cn gidNumber

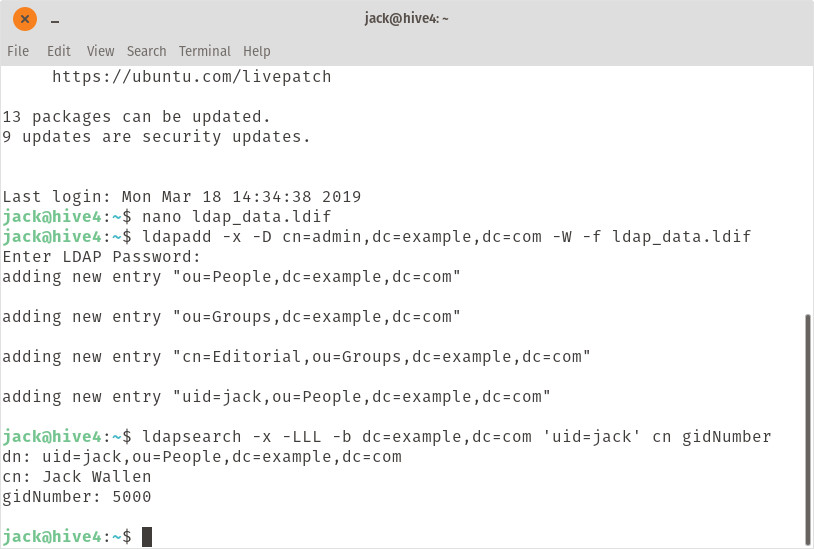
Where EXAMPLE and COM is your domain name and USER is the user to search for. The command should report the entry you searched for (Figure 3).

Figure 3: Our search was successful.

Now that you have your first entry into your LDAP directory, you can edit the above file to create even more. Or, you can wait until the next entry into the series (installing LDAP Account Manager) and take care of the process with the web-based GUI. Either way, you’re one step closer to having LDAP authentication on your network.

Managing Changes in Open Source Projects

Why bother having a process for proposing changes to your open source project? Why not just let people do what they’re doing and merge the features when they’re ready? Well, you can certainly do that if you’re the only person on the project. Or maybe if it’s just you and a few friends.

But if the project is large, you might need to coordinate how some of the changes land. Or, at the very least, let people know a change is coming so they can adjust if it affects the parts they work on. A visible change process is also helpful to the community. It allows them to give feedback that can improve your idea. And if nothing else, it lets people know what’s coming so that they can get excited, and maybe get you a little bit of coverage on Opensource.com or the like. Basically, it’s “here’s what I’m going to do” instead of “here’s what I did,” and it might save you some headaches as you scramble to QA right before your release.

So let’s say I’ve convinced you that having a change process is a good idea. How do you build one?

Decide who needs to review changes​

One of the first things you need to consider when putting together a change process for your community is: “who needs to review changes?” This isn’t necessarily approving the changes; we’ll come to that shortly. But are there people who should take a look early in the process? 

Read more at OpenSource.com

CI/CD Gets Governance and Standardization

Kubernetes, microservices and the advent of cloud native deployments have created a Renaissance-era in computing. As developers write and deploy code as part of continuous integration and continuous delivery (CI/CD) production processes, an explosion of tools has emerged for CI/CD processes, often targeted for cloud native deployments.

“Basically, when we all started looking at microservices as a possible paradigm of development, we needed to learn how to operationalize them,” Priyanka Sharma, director of alliances at GitLab and a member of the governing board at the Cloud Native Computing Foundation (CNCF), said. “That was something new for all of us. And from a very good place, a lot of technology came out, whether it’s open source projects or vendors who are going to help us with every niche problem we were going to face.”

As a countermeasure to this chaos, The Linux Foundation created the CD Foundation, along with more than 20 industry partners, to help standardize tools and processes for CI/CD production pipelines. Sharma has played a big part in establishing the CD Foundation, which she discusses in this episode of The New Stack Makers podcast hosted by Alex Williams, founder and editor-in-chief of The New Stack.

Read more at The New Stack

A Musical Tour of Hints and Tools for Debugging Host Networks

Shannon Nelson from the Oracle Linux Kernel Development team offers these tips and tricks to help make host network diagnostics easier. He also includes a recommended playlist for accompanying your debugging!

Ain’t Misbehavin’ (Dinah Washington)

As with many debugging situations, digging into and resolving a network-based problem can seem like a lot of pure guess and magic.  In the networking realm, not only do we have the host system’s processes and configurations to contend with, but also the exciting and often frustrating asynchronicity of network traffic.

Some of the problems that can trigger a debug session are reports of lost packets, corrupt data, poor performance, even random system crashes.  Not always do these end up as actual network problems, but as soon as the customer mentions anything about their wiring rack or routers, the network engineer is brought in and put on the spot.

This post is intended not as a full how-to in debugging any particular network issue, but more a set of some of the tips and tools that we use when investigating network misbehavior.

Start Me Up (The Rolling Stones)

In order to even get started, and probably the most important debugging tool available, is a concise and clear description of what is happening that shouldn’t happen.  This is harder to get than one might think.  You know what I mean, right?  The customer might give us anything from “it’s broken” to the 3 page dissertation of everything but the actual problem.

We start gathering a clearer description by asking simple questions that should be easy to answer.  Things like:

  • Who found it, who is the engineering contact?
  • Exactly what equipment was it running on?
  • When/how often does this happen?
  • What machines/configurations/NICs/etc are involved?
  • Do all such machines have this problem, or only one or two?
  • Are there routers and/or switches involved?
  • Are there Virtual Machines, Virtual Functions, or Containers involved?
  • Are there macvlans, bridges, bonds or teams involved?
  • Are there any network offloads involved?

With this information, we should be able to write our own description of the problem and see if the customer agrees with our summary.  Once we can refine that, we should have a better idea of what needs to be looked into.

Some of the most valuable tools for getting this information are simple user commands that the user can do on the misbehaving systems.  These should help detail what actual NICs and drivers are on the system and how they might be connected.

uname -a – This is an excellent way to start, if nothing else but to get a basic idea of what the system is and how old is the kernel being used.  This can catch the case where the customer isn’t running a supported kernel.

These next few are good for finding what all is on the system and how they are connected:

ip addr, ip link – these are good for getting a view of the network ports that are configured, and perhaps point out devices that are either offline or not set to the right address.  These can also give a hint as to what bonds or teams might be in place.  These replace the deprecated “ifconfig” command.

ip route – shows what network devices are going to handle outgoing packets.  This is mostly useful on systems with many network ports. This replaces the deprecated “route” command and the similar “netstat -rn“.

brctl show – lists software bridges set up and what devices are connected to them.

netstat -i – gives a summary list of the interfaces and their basic statistics. These are also available with “ip -s link“, just formatted differently.

lseth – this is a non-standard command that gives a nice summary combining a lot of the output from the above commands.  (See http://vcojot.blogspot.com/2015/11/introducing-lsethlsnet.html)

Watchin’ the Detectives (Elvis Costello)

Once we have an idea which particular device is involved, the following commands can help gather more information about that device.  This can get us an initial clue as to whether or not the device is configured in a generally healthy way.

ethtool <ethX> – lists driver and connection attributes such as current speed connection and if link is detected.

ethtool -i <ethX> – lists device driver information, including kernel driver and firmware versions, useful for being sure the customer is working with the right software; and PCIe device bus address, good for tracking the low level system hardware interface.

ethtool -l <ethX> – shows the number of Tx and Rx queues that are setup, which usually should match the number of CPU cores to be used.

ethtool -g <ethX> – shows the number of packet buffers for each Tx and Rx queue; too many and we’re wasting memory, too few and we risk dropping packets under heavy throughput pressure.

lspci -s <bus:dev:func> -vv – lists detailed information about the NIC hardware and its attributes. You can get the interface’s <bus:dev:func> from “ethtool -i“.

Diary (Bread)

The system logfiles usually have some good clues in them as to what may have happened around the time of the issue being investigated.  “dmesg” gives the direct kernel log messages, but beware that it is a limited sized buffer that can get overrun and loose history over time. In older Linux distributions the systems logs are found in /var/log, most usefully in either /var/log/messages or /var/log/syslog, while newer “systemd” based systems use “journalctl” for accessing log messages. Either way, there are often interesting traces to be found that can help describe the behavior.

One thing to watch out for is that when the customer sends a log extract, it usually isn’t enough.  Too often they will capture something like the kernel panic message, but not the few lines before that show what led up to the panic.  Much more useful is a copy of the full logfile, or at least something with several hours of log before the event.

Once we have the full file, it can be searched for error messages, any log messages with the ethX name or the PCI device address, to look for more hints.  Sometimes just scanning through the file shows patterns of behavior that can be related.

Fakin’ It (Simon & Garfunkel)

With the information gathered so far, we should have a chance at creating a simple reproducer.  Much of the time we can’t go poking at the customer’s running systems, but need to demonstrate the problem and the fix on our own lab systems.  Of course, we don’t have the same environment, but with a concise enough problem description we stand a good chance of finding a simple case that shows the same behavior.

Some traffic generator tools that help in reproducing the issues include:

ping – send one or a few packets, or send a packet flood to a NIC.  It has flags for size, timing, and other send parameters.

iperf – good for heavy traffic exercise, and can run several in parallel to get a better RSS spread on the receiver.

pktgen – this kernel module can be used to generate much more traffic than user level programs, in part because the packets don’t have to traverse the sender’s network stack.  There are also several options for packet shapes and throughput rates.

scapy – this is a Python tool that allows scripting of specially crafted packets, useful in making sure certain data patterns are exactly what you need for a particular test.

All Along the Watchtower (The Jimi Hendrix Experience)

With our own model of the problem, we can start looking deeper into the system to see what is happening: looking at throughput statistics and watching actual packet contents.  Easy statistic gathering can come from these tools:

ethtool -S <ethX> – most NIC device drivers offer Tx and Rx packets counts, as well as error data, through the ‘-S’ option of ethtool.  This device specific information is a good window into what the NIC thinks it is doing, and can show when the NIC sees low level issues, including malformed packets and bad checksums.

netstat -s <ethX> – this gives protocol statistics from the upper networking stack, such as TCP connections, segments retransmitted, and other related counters.

ip -s link show <ethX> – another method for getting a summary of traffic counters, including some dropped packets.

grep <ethX> /proc/interrupts – looking at the interrupt counters can give a better idea of how well the processing is getting spread across the available CPU cores.  For some loads, we can expect a wide dispersal, and other loads might end up with one core more heavily loaded that others.

/proc/net/* – there are lots of data files exposed by the kernel networking stack available here that can show many different aspects of the network stack operations. Many of the command line utilities get their info directly from these files. Sometimes it is handy to write your own scripts to pull the very specific data that you need from these files.

watch – The above tools give a snapshot of the current status, but sometimes we need to get a better idea of how things are working over time.  The “watch” utility can help here by repeatedly running the snapshot command and displaying the output, even highlighting where things have changed since the last snapshot.  Example uses include:

1
2
3
4
5
#         See the interrupt activity as it happens
watch "grep ethX /proc/interrupts"
#        Watch all of the NIC's non-zero stats
watch "ethtool -S ethX | grep -v ': 0'"

Also useful for catching data in flight is tcpdump and its cousins wireshark and tcpreplay.  These are invaluable in catching packets from the wire, dissecting what exactly got sent and received, and replaying the conversation for testing.  These have whole tutorials in and of themselves so I won’t detail them here, but here’s an example of tcpdump output from a single network packet:

1
2
3
4
5
6
23:12:47.471622 IP (tos 0x0, ttl 64, id 48247, offset 0, flags [DF], proto TCP (6), length 52)
    14.0.0.70.ssh > 14.0.0.52.37594: Flags [F.], cksum 0x063a (correct), seq 2358, ack 2055, win 294, options [nop,nop,TS val 2146211557 ecr 3646050837], length 0
    0x0000:  4500 0034 bc77 4000 4006 61d3 0e00 0046
    0x0010:  0e00 0034 0016 92da 21a8 b78a af9a f4ea
    0x0020:  8011 0126 063a 0000 0101 080a 7fec 96e5
    0x0030:  d952 5215

Photographs and Memories (Jim Croce)

Once we’ve made it this far and we have some idea that it might be a particular network device driver issue, we can do a little research into the history of the driver.  A good web search is an invaluable friend. For example, a web search for “bnxt_en dropping packets” brings up some references to a bugfix for the Nitro A0 hardware – perhaps this is related to a packet drop problem we are seeing?

If we have a clone of the Linux kernel git repository, we can do a search through the patch history for keywords.  If there’s something odd happening with macvlan filters, this will point out some patches that might be related to the issue.  For example, here’s a macvlan issue with driver resets that was fixed upstream in v4.18:

$ git log --oneline drivers/net/ethernet/intel/ixgbe | grep -i macvlan | grep -i reset 
8315ef6 ixgbe: Avoid performing unnecessary resets for macvlan offload 
e251ecf ixgbe: clean macvlan MAC filter table on VF reset
 
$ git describe --contains 8315ef6 
v4.18-rc1~114^2~380^2

Reelin’ In the Years (Steely Dan)

A couple of examples can show a little of how these tools have been used in real life.  Of course, it’s never as easy as it sounds when you’re in the middle of it.

lost/broken packets with TSO from sunvnet through bridge

When doing some performance testing on the sunvnet network driver, a virtual NIC in the SPARC Linux kernel, we found that enabling TSO actually significantly hurt throughput, rather than helping, when going out to a remote system.  After using netstat and ethtool -S to find that there were a lot of lost packets and retries through the base machine’s physical, we used tcpdump on the NIC and at various points in the internal software bridge to find where packets were getting broken and dropped.  We also found comments in the netdev mailing list about an issue with TSO’d packets getting messed up when going into the software bridge.  We turned off TSO for packets headed into the host bridge and the performance issue was fixed.

log file points out misbehaving process

In a case where NIC hardware was randomly freezing up on several servers, we found that a compute service daemon had recently been updated with a broken version that would immediately die and restart several times a second on scores of servers at the same time and was resetting the NICs each time.  Once the daemon was fixed, the NIC resetting stopped and the network problem went away.

Bring It On Home

This is just a quick overview of some of the tools for debugging a network issue.  Everyone has their favorite tools and different uses, we’ve only touched on a few here. They are all handy, but all need our imagination and perseverance to be useful in getting to the root of whatever problem we are chasing.  Also useful are quick shell scripts written to collect specific sets of data, and shell scripts to process various bits of data when looking for something specific.  For more ideas, see the links below.

And sometimes, when we’ve dug so far and haven’t yet found the gold, it’s best to just get up from the keyboard, take a walk, grab a snack, listen to some good music, and let the mind wander.

Good hunting.

This article originally appeared at Oracle Developers Blog

Top 10 New Linux SBCs to Watch in 2019

A recent Global Market Insights report projects the single board computer market will grow from $600 million in 2018 to $1 billion by 2025. Yet, you don’t need to read a market research report to realize the SBC market is booming. Driven by the trends toward IoT and AI-enabled edge computing, new boards keep rolling off the assembly lines, many of them tailored for highly specific applications.

Much of the action has been in Linux-compatible boards, including the insanely popular Raspberry Pi. The number of different vendors and models has exploded thanks in part to the rise of community-backed, open-spec SBCs.

Here we examine 10 of the most intriguing, Linux-driven SBCs among the many products announced in the last four weeks that bookended the recent Embedded World show in Nuremberg. (There was also some interesting Linux software news at the show.) Two of the SBCs—the Intel Whiskey Lake based UP Xtreme and Nvidia Jetson Nano driven Jetson Nano Dev Kit—were announced only this week.

Our mostly open source list also includes a few commercial boards. Processors range from the modest, Cortex-A7 driven STM32MP1 to the high-powered Whiskey Lake and Snapdragon 845. Mid-range models include Google’s i.MX8M powered Coral Dev Board and a similarly AI-enhanced, TI AM5729 based BeagleBone AI. Deep learning acceleration chips—and standard RPi 40-pin or 96Boards expansion connectors—are common themes among most of these boards.

The SBCs are listed in reverse chronological order according to their announcement dates. The links in the product names go to recent LinuxGizmos reports, which link to vendor product pages.

UP XtremeThe latest in Aaeon’s line of community-backed SBCs taps Intel’s 8th Gen Whiskey Lake-U CPUs, which maintain a modest 15W TDP while boosting performance with up to quad-core, dual threaded configurations. Depending on when it ships, this Linux-ready model will likely be the most powerful community-backed SBC around — and possibly the most expensive.

The SBC supports up to 16GB DDR4 and 128GB eMMC and offers 4K displays via HDMI, DisplayPort, and eDP. Other features include SATA, 2x GbE, 4x USB 3.0, and 40-pin “HAT” and 100-pin GPIO add-on board connectors. You also get mini-PCIe and dual M.2 slots that support wireless modems and more SATA options. The slots also support Aaeon’s new AI Core X modules, which offer Intel’s latest Movidius Myriad X VPUs for 1TOPS neural processing acceleration.

Jetson Nano Dev KitNvidia just announced a low-end Jetson Nano compute module that’s sort of like a smaller (70 x 45mm) version of the old Jetson TX1. It offers the same 4x Cortex-A57 cores but has an even lower-end 128-core Maxwell GPU. The module has half the RAM and flash (4GB/16GB) of the TX1 and TX2, and no WiFi/Bluetooth radios. Like the hexa-core Jetson TX2, however, it supports 4K video and the GPU offers similar CUDA-X deep learning libraries.

Although Nvidia has backed all its Linux-driven Jetson modules with development kits, the Jetson Nano Dev Kit is its first community-backed, maker-oriented kit. It does not appear to offer open specifications, but it costs only $99 and there’s a forum and other community resources. Many of the specs match or surpass the Raspberry Pi 3B+, including the addition of a 40-pin GPIO. Highlights include an M.2 slot, GbE with Power-over-Ethernet, HDMI 2.0 and eDP links, and 4x USB 3.0 ports.

Coral Dev Board—Google’s very first Linux maker board arrived earlier this month featuring an NXP i.MX8M and Google’s Edge TPU AI chip—a stripped-down version of Google’s TPU Unit is designed to run TensorFlow Lite ML models. The $150, Raspberry Pi-like Coral Dev Board was joined by a similarly Edge TPU-enabled Coral USB Accelerator USB stick. These will be followed by an Edge TPU based Coral PCIe Accelerator and a Coral SOM compute module. All these devices are backed with schematics, community resources, and other open-spec resources.

The Coral Dev Board combines the Edge TPU chip with NXP’s quad-core, 1.5GHz Cortex-A53 i.MX8M with a 3D Vivante GPU/VPU and a Cortex-M4 MCU. The SBC is even more like the Raspberry Pi 3B+ than Nvidia’s Dev Kit, mimicking the size and much of the layout and I/O, including the 40-pin GPIO connector. Highlights include 4K-ready GbE, HDMI 2.0a, 4-lane MIPI-DSI and CSI, and USB 3.0 host and Type-C ports.

SBC-C43—Seco’s commercial, industrial temperature SBC-C43 board is the first SBC based on NXP’s high-end, up to hexa-core i.MX8. The 3.5-inch SBC supports the i.MX8 QuadMax with 2x Cortex-A72 cores and 4x Cortex-A53 cores, the QuadPlus with a single Cortex-A72 and 4x -A53, and the Quad with no -A72 cores and 4x -A53. There are also 2x Cortex-M4F real-time cores and 2x Vivante GPU/VPU cores. Yocto Project, Wind River Linux, and Android are available.

The feature-rich SBC-C43 supports up to 8GB DDR4 and 32GB eMMC, both soldered for greater reliability. Highlights include dual GbE, HDMI 2.0a in and out ports, WiFi/Bluetooth, and a variety of industrial interfaces. Dual M.2 slots support SATA, wireless, and more.

Nitrogen8M_Mini—This Boundary Devices cousin to the earlier, i.MX8M based Nitrogen8M is available for $135, with shipments due this Spring. The open-spec Nitrogen8M_Mini is the first SBC to feature NXP’s new i.MX8M Mini SoC. The Mini uses a more advanced 14LPC FinFET process than the i.MX8M, resulting in lower power consumption and higher clock rates for both the 4x Cortex-A53 (1.5GHz to 2GHz) and Cortex-M4 (400MHz) cores. The drawback is that you’re limited to HD video resolution.

Supported with Linux and Android, the Nitrogen8M_Mini ships with 2GB to 4GB LPDDR4 RAM and 8GB to 128GB eMMC. MIPI-DSI and -CSI interfaces support optional touchscreens and cameras, respectively. A GbE port is standard and PoE and WiFi/BT are optional. Other features include 3x USB ports, one or two PCIe slots, and optional -40 to 85°C support. A Nitrogen8M_Mini SOM module with similar specs is also in the works.

Pine H64 Model B—Pine64’s latest hacker board was teased in late January as part of an ambitious roll-out of open source products, including a laptop, tablet, and phone. The Raspberry Pi semi-clone, which recently went on sale for $39 (2GB) or $49 (3GB), showcases the high-end, but low-cost Allwinner H64. The quad -A53 SoC is notable for its 4K video with HDR support.

The Pine H64 Model B offers up to 128GB eMMC storage, WiFi/BT, and a GbE port. I/O includes 2x USB 2.0 and single USB 3.0 and HDMI 2.0a ports plus SPDIF audio and an RPi-like 40-pin connector. Images include Android 7.0 and an “in progress” Armbian Debian Stretch.

AI-ML Board—Arrow unveiled this i.MX8X based SBC early this month along with a similarly 96Boards CE Extended format, i.MX8M based Thor96 SBC. While there are plenty of i.MX8M boards these days, we’re more intrigued with the lowest-end i.MX8X member of the i.MX8 family. The AI-ML Board is the first SBC we’ve seen to feature the low-power i.MX8X, which offers up to 4x 64-bit, 1.2GHz Cortex-A35 cores, a 4-shader, 4K-ready Vivante GPU/VPU, a Cortex-M4F chip, and a Tensilica HiFi 4 DSP.

The open-spec, Yocto Linux driven AI-ML Board is targeted at low-power, camera-equipped applications such as drones. The board has 2GB LPDDR4, Ethernet, WiFi/BT, and a pair each of MIPI-DSI and USB 3.0 ports. Cameras are controlled via the 96Boards 60-pin, high-power GPIO connector, which is joined by the usual 40-pin low-power link. The launch is expected June 1.

BeagleBone AI—The long-awaited successor to the Cortex-A8 AM3358 based BeagleBone family of boards advances to TIs dual-core Cortex-A15 AM5729, with similar PowerVR GPU and MCU-like PRU cores. The real story, however, is the AI firepower enabled by the SoC’s dual TI C66x DSPs and four embedded-vision-engine (EVE) neural processing cores. BeagleBoard.org claims that calculations for computer-vision models using EVE run at 8x times the performance per watt compared to the similar, but EVE-less, AM5728. The EVE and DSP chips are supported through a TIDL machine learning OpenCL API and pre-installed tools.

Due to go on sale in April for about $100, the Linux-powered BeagleBone AI is based closely on the BeagleBone Black and offers backward header, mechanical, and software compatibility. It doubles the RAM to 1GB and quadruples the eMMC storage to 16GB. You now get GbE and high-speed WiFi, as well as a USB Type-C port.

Robotics RB3 Platform (DragonBoard 845c)—Qualcomm and Thundercomm are initially launching their 96Boards CE form factor, Snapdragon 845-based upgrade to the Snapdragon 820-based DragonBoard 820c SBC as part of a Qualcomm Robotics RB3 Platform. Yet, 96Boards.org has already posted a DragonBoard 845c product page, and we imagine the board will be available in the coming months without all the robotics bells and whistles. A compute module version is also said to be in the works.

The 10nm, octa-core, “Kryo” based Snapdragon 845 is one of the most powerful Arm SoCs around. It features an advanced Adreno 630 GPU with “eXtended Reality” (XR) VR technology and a Hexagon 685 DSP with a third-gen Neural Processing Engine (NPE) for AI applications. On the RB3 kit, the board’s expansion connectors are pre-stocked with Qualcomm cellular and robotics camera mezzanines. The $449 and up kit also includes standard 4K video and tracking cameras, and there are optional Time-of-Flight (ToF) and stereo SLM camera depth cameras. The SBC runs Linux with ROS (Robot Operating System).

Avenger96—Like Arrow’s AI-ML Board, the Avenger96 is a 96Boards CE Extended SBC aimed at low-power IoT applications. Yet, the SBC features an even more power-efficient (and slower) SoC: ST’s recently announced STM32MP153. The Avenger96 runs Linux on the high-end STM32MP157 model, which has dual, 650MHz Cortex-A7 cores, a Cortex-M4, and a Vivante 3D GPU.

This sandwich-style board features an Avenger96 module with the STM32MP157 SoC, 1GB of DDR3L, 2MB SPI flash, and a power management IC. It’s unclear if the 8GB eMMC and WiFi-ac/Bluetooth 4.2 module are on the module or carrier board. The Avenger96 SBC is further equipped with GbE, HDMI, micro-USB OTG, and dual USB 2.0 host ports. There’s also a microSD slot and the usual 40- and 60-pin GPIO connectors. The board is expected to go on sale in April.

Why Unikernels Are Great for DevOps

Unikernels are single-purpose virtual machines (VM). They only run one application—which is interesting when you think about it, because that’s precisely how a lot of DevOps practitioners provision their applications today. There is way too much software to provision nowadays—pools of app servers, clusters of databases, etc. Unikernels are fast to boot, fast to run, small in size, way more secure than Linux or containers and, if you have access to your own bare metal—either in your data center or through a provider—you can run thousands of them per box.

Some stats? Some can boot in less than five milliseconds—that’s slightly slower than calling fork (three milliseconds) but orders of magnitude faster than Linux. Some can run databases including Cassandra and MySQL, 20 percent faster. Some people (yours truly included) have provisioned thousands of them on a single box with no performance degradation. Some are reporting them running as a VM faster than a comparable bare-metal Linux installation of that application. Clearly, this is worth investigating.

Read more at DevOps.com

Datapractices.org Joins the Linux Foundation to Advance Best Practices and Offers Open Courseware Across Data Ecosystem

The Linux Foundation has announced datapractices.org,  a vendor-neutral community working on the first-ever template for modern data teamwork, has joined as an official Linux Foundation project.

DataPractices.org was pioneered by data.world as a “Manifesto for Data Practices” of four values and 12 principles that illustrate the most effective, ethical, and modern approach to data teamwork. As a member of the foundation, datapractices.org will expand to offer open courseware and establish a collaborative approach to defining and refining data best practices. 

We talked with Patrick McGarry, head of data.world, to learn more about DataPractices.org.

LF: Can you briefly describe datapractices.org and tell us about its history?
Patrick:
 The Data Practices movement originated back in 2017 at The Open Data Science Leadership Summit in San Francisco. This event gathered together leaders in data science, semantics, open source, visualization, and industry to discuss the current state of the data community. We discovered that there were many similarities between the then current challenges around data, and the previous difficulties felt in software development that Agile addressed.

The goal of the Data Practices movement was to start a similar “Agile for Data” movement that could help offer direction and improved data literacy across the ecosystem. While the first step was the “Manifesto for Data Practices” the intent was always to move past that and apply the values and principles to a series of free and open courseware that could benefit anyone who was interested.

Read more at Linux Foundation

Printing from the Linux Command Line

Printing from the Linux command line is easy. You use the lp command to request a print, and lpq to see what print jobs are in the queue, but things get a little more complicated when you want to print double-sided or use portrait mode. And there are lots of other things you might want to do — such as printing multiple copies of a document or canceling a print job. Let’s check out some options for getting your printouts to look just the way you want them to when you’re printing from the command line.

Displaying printer settings

To view your printer settings from the command line, use the lpoptions command. The output should look something like this:

$ lpoptions
copies=1 device-uri=dnssd://HP%20Color%20LaserJet%20CP2025dn%20(F47468)._pdl-datastream._tcp.local/ 
  finishings=3 job-cancel-after=10800 job-hold-until=no-hold job-priority=50 job-sheets=
  none,none marker-change-time=1553023232 marker-colors=#000000,#00FFFF,#FF00FF,#FFFF00 
  marker-levels=18,62,62,63 marker-names='Black Cartridge HP CC530A,Cyan Cartridge 
  HP CC531A,Magenta Cartridge HP CC533A,Yellow Cartridge HP CC532A' marker-types=
  toner,toner,toner,toner number-up=1 printer-commands=none printer-info='HP Color LaserJet 
  CP2025dn (F47468)' printer-is-accepting-jobs=true printer-is-shared=true printer-is-temporary=
  false printer-location printer-make-and-model='HP Color LaserJet cp2025dn pcl3, hpcups 3.18.7' 
  printer-state=3 printer-state-change-time=1553023232 printer-state-reasons=none printer-type=
  167964 printer-uri-supported=ipp://localhost/printers/Color-LaserJet-CP2025dn sides=one-sided   

This output is likely to be a little more human-friendly if you turn its blanks into carriage returns. Notice how many settings are listed.

Read more at Network World

How to Set the PATH Variable in Linux

In Linux, your PATH is a list of directories that the shell will look in for executable files when you issue a command without a path. The PATH variable is usually populated with some default directories, but you can set the PATH variable to anything you like.

When a command name is specified by the user or an exec call is made from a program, the system searches through $PATH, examining each directory from left to right in the list, looking for a filename that matches the command name. Once found, the program is executed as a child process of the command shell or program that issued the command.  -Wikipedia

In this short tutorial, we will discuss how to add a directory to your PATH and how to make the changes permanent. Although there is no native way to delete a default directory from your path, we will discuss a workaround. We will end by creating a short script and placing it in our newly created PATH to demonstrate the benefits of the PATH variable.

Read more at Putorius