Home Blog Page 316

Open Source Logging Tools for Linux

If you’re a Linux systems administrator, one of the first tools you will turn to for troubleshooting are log files. These files hold crucial information that can go a long way to help you solve problems affecting your desktops and servers. For many sysadmins (especially those of an old-school sort), nothing beats the command line for checking log files. But for those who’d rather have a more efficient (and possibly modern) approach to troubleshooting, there are plenty of options.

In this article, I’ll highlight a few such tools available for the Linux platform. I won’t be getting into logging tools that might be specific to a certain service (such as Kubernetes or Apache), and instead will focus on tools that work to mine the depths of all that magical information written into /var/log.

Speaking of which…

What is /var/log?

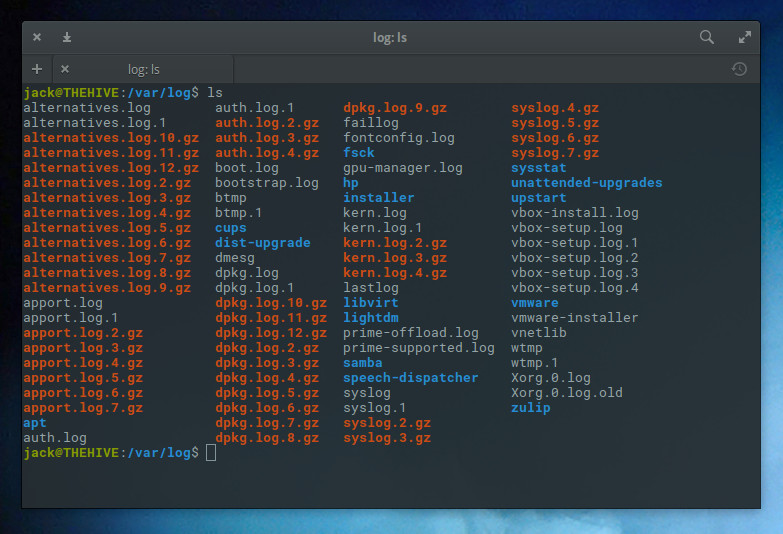
If you’re new to Linux, you might not know what the /var/log directory contains. However, the name is very telling. Within this directory is housed all of the log files from the system and any major service (such as Apache, MySQL, MariaDB, etc.) installed on the operating system. Open a terminal window and issue the command cd /var/log. Follow that with the command ls and you’ll see all of the various systems that have log files you can view (Figure 1).

Figure 1: Our ls command reveals the logs available in /var/log/.

Say, for instance, you want to view the syslog log file. Issue the command less syslog and you can scroll through all of the gory details of that particular log. But what if the standard terminal isn’t for you? What options do you have? Plenty. Let’s take a look at few such options.

Logs

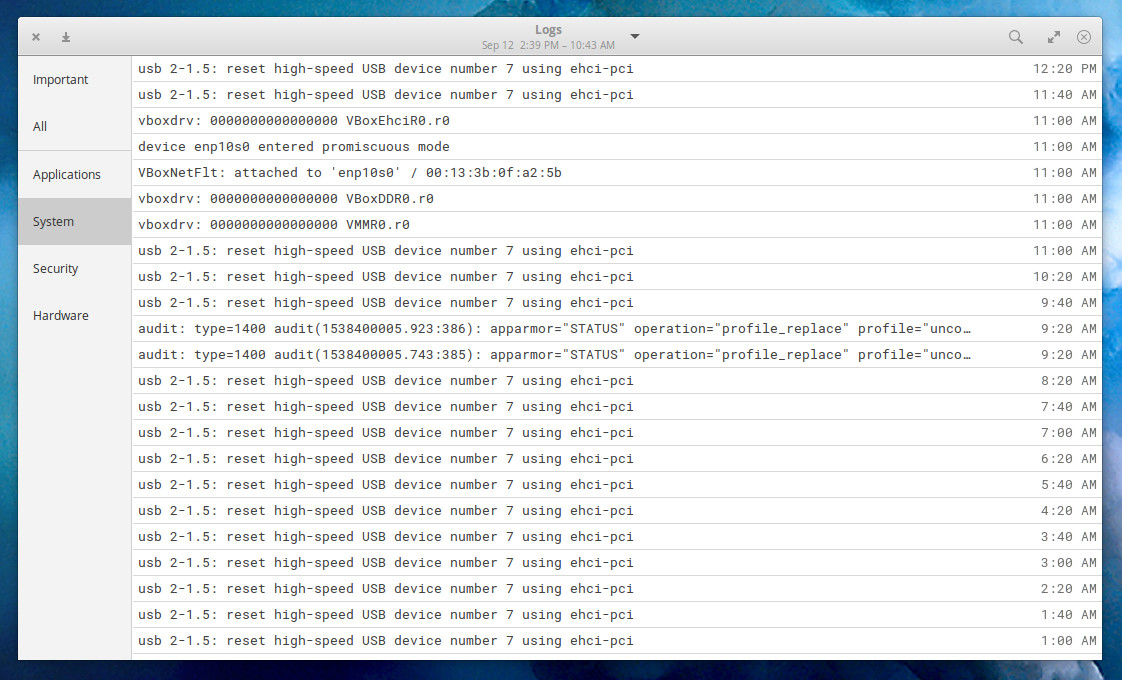
If you use the GNOME desktop (or other, as Logs can be installed on more than just GNOME), you have at your fingertips a log viewer that mainly just adds the slightest bit of GUI goodness over the log files to create something as simple as it is effective. Once installed (from the standard repositories), open Logs from the desktop menu, and you’ll be treated to an interface (Figure 2) that allows you to select from various types of logs (Important, All, System, Security, and Hardware), as well as select a boot period (from the top center drop-down), and even search through all of the available logs.

Figure 2: The GNOME Logs tool is one of the easiest GUI log viewers you’ll find for Linux.

Logs is a great tool, especially if you’re not looking for too many bells and whistles getting in the way of you viewing crucial log entries, so you can troubleshoot your systems.

KSystemLog

KSystemLog is to KDE what Logs is to GNOME, but with a few more features to add into the mix. Although both make it incredibly simple to view your system log files, only KSystemLog includes colorized log lines, tabbed viewing, copy log lines to the desktop clipboard, built-in capability for sending log messages directly to the system, read detailed information for each log line, and more. KSystemLog views all the same logs found in GNOME Logs, only with a different layout.

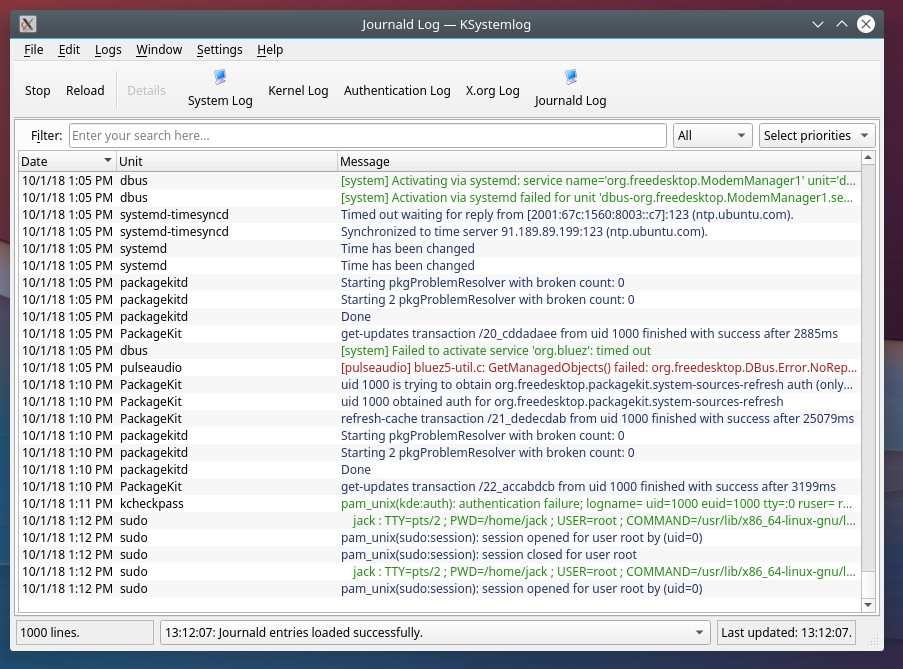
From the main window (Figure 3), you can view any of the different log (from System Log, Authentication Log, X.org Log, Journald Log), search the logs, filter by Date, Host, Process, Message, and select log priorities.

Figure 3: The KSystemLog main window.

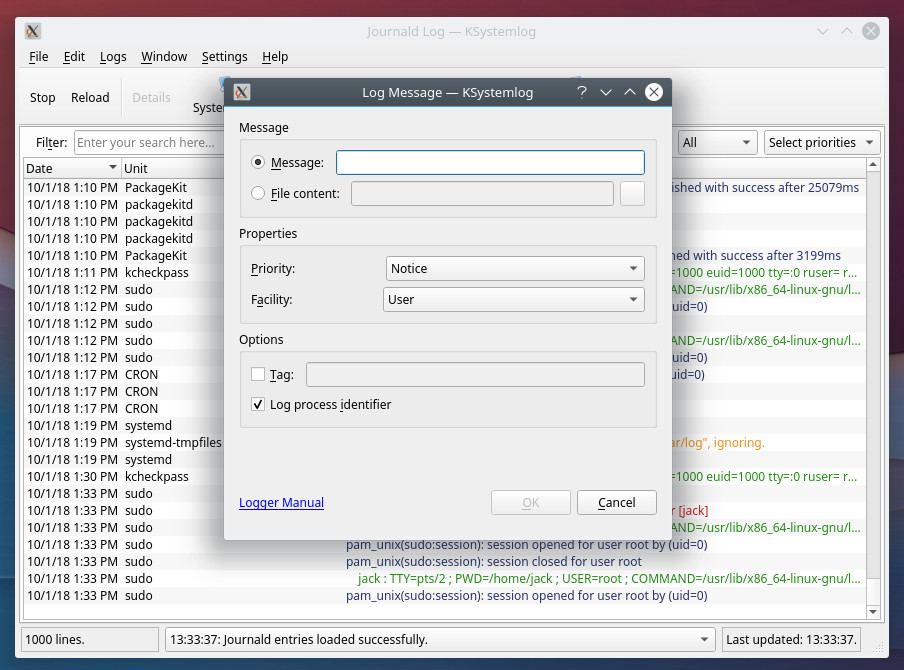
If you click on the Window menu, you can open a new tab, where you can select a different log/filter combination to view. From that same menu, you can even duplicate the current tab. If you want to manually add a log to a file, do the following:

  1. Open KSystemLog.

  2. Click File > Add Log Entry.

  3. Create your log entry (Figure 4).

  4. Click OK

Figure 4: Creating a manual log entry with KSystemLog.

KSystemLog makes viewing logs in KDE an incredibly easy task.

Logwatch

Logwatch isn’t a fancy GUI tool. Instead, logwatch allows you to set up a logging system that will email you important alerts. You can have those alerts emailed via an SMTP server or you can simply view them on the local machine. Logwatch can be found in the standard repositories for almost every distribution, so installation can be done with a single command, like so:

sudo apt-get install logwatch

Or:

sudo dnf install logwatch

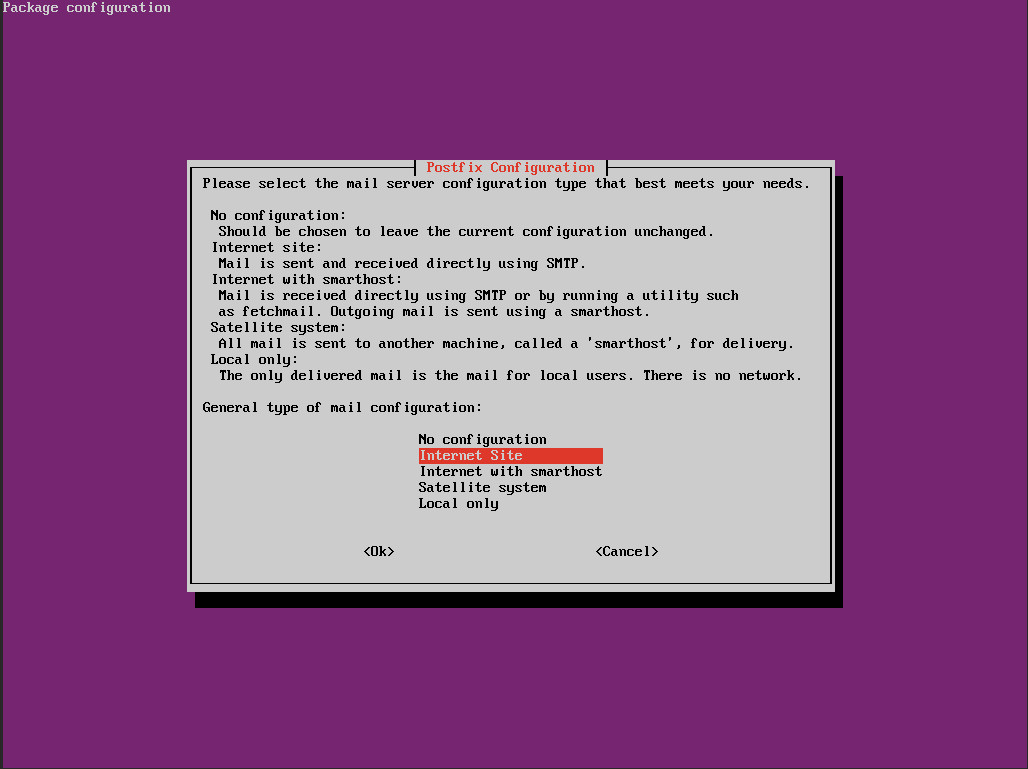
During the installation, you will be required to select the delivery method for alerts (Figure 5). If you opt to go the local mail delivery only, you’ll need to install the mailutils app (so you can view mail locally, via the mail command).

Figure 5: Configuring Logwatch alert sending method.

All Logwatch configurations are handled in a single file. To edit that file, issue the command sudo nano /usr/share/logwatch/default.conf/logwatch.conf. You’ll want to edit the MailTo = option. If you’re viewing this locally, set that to the Linux username you want the logs sent to (such as MailTo = jack). If you are sending these logs to an external email address, you’ll also need to change the MailFrom = option to a legitimate email address. From within that same configuration file, you can also set the detail level and the range of logs to send. Save and close that file.
Once configured, you can send your first mail with a command like:

logwatch --detail Med --mailto ADDRESS --service all --range today
Where ADDRESS is either the local user or an email address.

For more information on using Logwatch, issue the command man logwatch. Read through the manual page to see the different options that can be used with the tool.

Rsyslog

Rsyslog is a convenient way to send remote client logs to a centralized server. Say you have one Linux server you want to use to collect the logs from other Linux servers in your data center. With Rsyslog, this is easily done. Rsyslog has to be installed on all clients and the centralized server (by issuing a command like sudo apt-get install rsyslog). Once installed, create the /etc/rsyslog.d/server.conf file on the centralized server, with the contents:

# Provide UDP syslog reception
$ModLoad imudp
$UDPServerRun 514

# Provide TCP syslog reception
$ModLoad imtcp
$InputTCPServerRun 514

# Use custom filenaming scheme
$template FILENAME,"/var/log/remote/%HOSTNAME%.log"
*.* ?FILENAME

$PreserveFQDN on

Save and close that file. Now, on every client machine, create the file /etc/rsyslog.d/client.conf with the contents:

$PreserveFQDN on
$ActionQueueType LinkedList
$ActionQueueFileName srvrfwd
$ActionResumeRetryCount -1
$ActionQueueSaveOnShutdown on
*.* @@SERVER_IP:514

Where SERVER_IP is the IP address of your centralized server. Save and close that file. Restart rsyslog on all machines with the command:

sudo systemctl restart rsyslog

You can now view the centralized log files with the command (run on the centralized server):

tail -f /var/log/remote/*.log

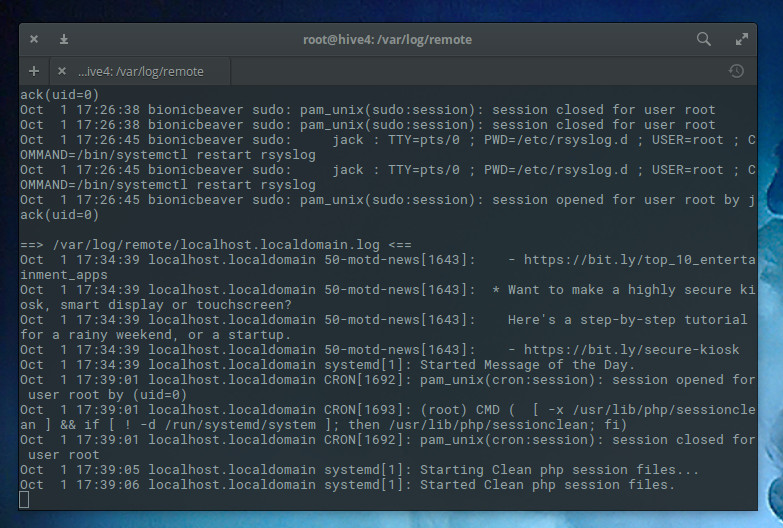
The tail command allows you to view those files as they are written to, in real time. You should see log entries appear that include the client hostname (Figure 6).

Figure 6: Rsyslog showing entries for a connected client.

Rsyslog is a great tool for creating a single point of entry for viewing the logs of all of your Linux servers.

More where that came from

This article only scratched the surface of the logging tools to be found on the Linux platform. And each of the above tools is capable of more than what is outlined here. However, this overview should give you a place to start your long day’s journey into the Linux log file.

Learn more about Linux through the free “Introduction to Linux” course from The Linux Foundation and edX.

Continuous Security with Kubernetes

As the Chief Technologist at Red Hat for the western region, Christian Van Tuin has been architecting solutions for strategic customers and partners for over a decade. He’s lived through the rise of DevOps and containers. And in his role, he’s found that security is the highest adoption barrier for enterprises interested in harnessing the power of containers.

After all, “Now we’re seeing an increasing level of threats for geopolitical reasons, and we’re seeing the dissolving security perimeter,” says Van Tuin. “Everything doesn’t sit behind the firewall in your data center anymore, and there’s a shift to software-based storage, networking and compute. The traditional network base, the fences, are no longer good enough.”

But as he will share during his talk at OpenFinTech Forum in New York City, Oct. 10-11, there are security best practices in the areas of DevOps, containers, and Kubernetes that companies can adopt so that everyone can sleep better at night.

“We’re seeing this evolution to DevSecOps,” he says. “It’s all about reducing security and business risk, lowering costs, speeding up delivery and reaction time, falling in line with DevOps. And we’re doing this with automation process optimization and continuous security improvement.”

This is particularly relevant for FinTech companies. “With the move from physical to digital banking, DevSecOps ensures security is integrated into the process from the start of development rather than appended on in production,” says Van Tuin. “At the same time, it still allows for rapid and frequent releases without security becoming a bottleneck or burden on development.” For instance, OpenSCAP can be used to scan container images for compliance with PCI DSS (Payment Card Industry Security Standard) and customer security policies for banking.

Van Tuin’s best practices are wide-ranging: addressing security risks such as container images, builds, registry, hosts, and network; automating and integrating security vulnerability management and compliance checking in a DevOps CI/CD pipeline; and deployment strategies for container security updates. And he’s hopeful that there will be more improvements to security around Kubernetes with the growth of Istio service mesh and CoreOS operators.

“One of the keys to DevSecOps is to ensure that you can enable your developers to rapidly innovate and experiment,” says Van Tuin. And the first thing that needs to happen? “Embrace security into the culture of the company.”

To hear all about Chris’s strategies for continuous security with DevOps, containers, and Kubernetes, plus talks from other open source leaders, come to OpenFinTech Forum in New York City October 10-11. You can still register here!

Sign up to receive updates on Open FinTech Forum:

​IBM Mainframe Containers Grow More Secure

Everything old is new again. In the 1960s, IBM’s OS/650 mainframe operating system had two modes, MFT and MVT, in which process got its own address space and couldn’t interface with others processes running parallel with it. This was the ancestor to both virtual machines (VM) and containers. Fast forward to now, and IBM Secure Service Container for IBM Cloud Private enables you to run an operating system and applications in containers with their own address space and walls to keep them from interacting with other programs.

Of course, you can do a wee bit more with Secure Service Containers (SSC) on IBM LinuxONE and Z mainframes than you could on a 360 mainframe with a maximum of 1MB of memory. IBM Cloud Private is a Platform as a Service (PaaS) environment for developing and managing containerized applications. It’s built on top of the Kubernetes container orchestrator Kubernetes.

Read more at ZDNet

14 Common Network Ports You Should Know

The physical ports on your computer allow communicate with peripheral devices such as your keyboard and mouse and to connect with internet devices via Ethernet cables.

Within computer networking, ports serve a similar purpose. When a computer system seeks to connect to another computer, the port serves as a communication endpoint. It is also possible for different services running on the same computer to expose various ports and communicate with one another using these ports. In simple terms, if a software application or service needs to communicate with others, it will expose a port. Ports are identified with positive 16-bit unsigned integers, ranging from 0 to 65535. Other services use this port number to communicate with the service or app. Port numbers are divided into three ranges: well-known ports, registered ports, and dynamic or private ports.

Well-known ports (also known as system ports) are numbered from 0 through 1023. For example, to connect to the host example.com via SSH, I would use this command:

ssh username@example.com -v

In this example, -v stands for verbose,…

Read more at OpenSource.com

Dealing with printk()

It’s odd that printk() would pose so many problems for kernel development, given that it’s essentially just a replacement for printf() that doesn’t require linking the standard C library into the kernel.

And yet, it’s famously a mess, full of edge cases, corner cases, deadlocks, race conditions and a variety of other tough-to-solve problems. The reason for this is, unlike printf(), the printk() system call has to produce reasonable behavior even when the entire system is in the midst of crashing. That’s really the whole point—printk() needs to report errors and warnings that can be used to debug whatever strange and unexpected catastrophe has just hit a running system.

Trying to fix all the deadlocks and other problems at the same time would be too large a task for anyone, especially since each one is a special case defined by the particular context in which the printk() call appeared. But, sometimes a bunch of instances in a particular region of code can be addressed all together.

Read more at Linux Journal

Getting Started with the Unbreakable Enterprise Kernel Release 5 for Oracle Linux on Oracle Cloud Infrastructure

Oracle Linux images available on Oracle Cloud Infrastructure are frequently updated to help ensure access to the latest software. The latest Oracle Linux images provided in Oracle Cloud Infrastructure now include Oracle Linux 7 Update 5 with the Unbreakable Enterprise Kernel Release 5 (UEK R5). UEK R5 is an extensively tested and optimized Linux kernel designed for 64-bit (Intel x86_64) and ARM (aarch64)…
Click to Read More at Oracle Linux Kernel Development

Getting Started with the Unbreakable Enterprise Kernel Release 5 for Oracle Linux on Oracle Cloud Infrastructure

Oracle Linux images available on Oracle Cloud Infrastructure are frequently updated to help ensure access to the latest software. The latest Oracle Linux images provided in Oracle Cloud Infrastructure now include Oracle Linux 7 Update 5 with the Unbreakable Enterprise Kernel Release 5 (UEK R5). UEK R5 is an extensively tested and optimized Linux kernel designed for 64-bit (Intel x86_64) and ARM (aarch64)…

Click to Read More at Oracle Linux Kernel Development

Kid’s Day at Open Source Summit

The Linux Foundation strives to make Open Source Summit one of the most inclusive tech events in a variety of ways, offering activities such as the “Women in Open Source” lunch, a diversity social, a first-time attendees get-together, and more. The have activities focused on children, too. Not only does Open Source Summit offer free on-site childcare for attendees’ children, they also sponsor a Kid’s Day.

At this year’s Kid’s Day in Vancouver, the primary goal was to introduce the kids to coding via HTML, and very little computer knowledge or experience was required to participate. “The basics, typing, browsing the Internet and minor computer operation, are all your child needs to participate,” according to the website.

For this event, The Linux Foundation collaborated with Banks Family Tech, who organized the 4-hour long workshop. This workshop was geared toward children ages 9–18 and was open to children from the community as well as those of event attendees. The kids that participated actually ranged in age from 5-13 years of age, and, many already had some coding experience. Some had tried Scratch, and others had written scripts for games.

“We are going to teach how to go from nothing and become coders,” said Phillip Banks, founder of Banks Family Tech.

HTML workshop

The workshop focused squarely on HTML, one of the easiest computing languages. “It’s close to English and it’s not hard text and syntax to learn. It allows us to squeeze a lot of things into a day and get them excited so that they can go home and learn more,” said Banks. “After that, maybe, you can go to Python but HTML is so easy as they get a quick return by manipulating objects, text color and other things on a web-page immediately.”

This Kid’s Day event had a great mix of participants. While some of the kids accompanied their parents who were attending the conference, the majority were from the local community, whose parents learned about the workshop from social networks like Facebook. Khristine Carino, Director for Communications of SCWIST (Society for Canadian Women In Science and Technology), not only brought her own kids but also invited families from underrepresented minorities in Vancouver.

In the workshop, the children learned HTML basics like font tags, how to use fonts and colors, how to add images and videos, and how choose a background for their website. They also had the opportunity to share what they created with the whole group and learn from each other.

“It’s not so much about learning to code, just to be a coder; it’s learning to understand how things work,” said Banks. You can hear more in the video below.

Check out the full list of activities coming up at Open Source Summit in Europe and sign up to receive updates:

This article originally appeared at The Linux Foundation

Linux strace Command Tutorial for Beginners (8 Examples)

The Linux command line offers many tools that are helpful for software developers. One among them is strace, basics of which we’ll be discussing in this tutorial using some easy to understand examples.

But before we do that, it’s worth mentioning that all examples in this article have been tested on an Ubuntu 18.04 LTS machine.

Linux strace command

The strace command in Linux lets you trace system calls and signals. Following is its syntax:

strace [OPTIONS] command

Read more at HowToForge