Kubeadm is the tool that ships with Kubernetes to manage your cluster’s lifecycle; it’s designed to be used any time you need to do something significant to your cluster. Kubeadm 1.8 brings new features to the table, and we recommend checking out the the repository for all the latest development.
Today we’ll look at one of kubeadm’s most crucial functions: upgrading your cluster to a new release of Kubernetes. There are many moving parts here; not only do you have to upgrade the Kubernetes control plane components, but also the actual packages that run on the operating system itself. This blog post heavily references the kubeadm documentation, so you’re going to want to become familiar with that page. We’re going to break this down into three major steps.
This week in open source and Linux news, Linus Torvalds reveals that fuzzing is improving security in Linux, Hyperledger announces a new sub-project and member, and more! Read on to stay in the open source know.
1) Linux 4.14 release candidate five is out and with it comes a steady stream of security improvements.
4) “Alibaba Cloud will soon be able to offer its clients access to Red Hat’s offerings, which includes the full range of open source cloud solutions, as well as Red Hat Enterprise Linux.”
You can now run Android on top of a regular Linux graphics stack. This was not the case before, and according to Robert Foss, a Linux graphic stack contributor and Software Engineer at Collabora, this is hugely empowering. In his upcoming talk at Embedded Linux Conference Europe, Foss will cover recent developments in this area and discuss how these changes allow you to take advantage of new features and improvements in kernels.
Robert Foss, Linux graphic stack contributor and Software Engineer at Collabora
In this article, Foss explains more and offers a preview of his talk.
Linux.com: Can you please tell us a bit about the graphics stack you’re talking about?
Foss: Traditional Linux graphics systems (like X11) mostly did not use planes. But modern graphics systems like Android and Wayland can take full advantage of it.
Android has the most mature implementation of plane support in HWComposer, and its graphics stack is a bit different from the usual Linux desktop graphics stack. On desktops, the typical compositor just uses the GPU for all composition, because this is the only thing that exists on the desktop.
Most embedded and mobile chips have specialized 2D composition hardware that Android is designed around. The way this is done is by dividing the things that are displayed into layers, and then intelligently feeding the layers to hardware that is optimized to handle layers. This frees up the GPU to work on the things you actually care about, while at the same time, it lets hardware that is more efficient do what it does best.
Linux.com: When you say Android, do you mean the Android Open Source Project (the AOSP)?
Foss: The Android Open Source Project (the AOSP), is the base upon which many Android products is built, and there’s not much of a distinction between AOSP and Android.
Specifically, my work has been done in the AOSP realm, but nothing is preventing this work from being pulled into a shipped Android product.
The distinction is more about licensing and fulfilling the requirements of Google for calling a product Android, than it is about code.
Linux.com: Who would want to run that and why? What are some advantages?
Foss: AOSP gives you a lot of things for free, such as a software stack optimized for usability, low power, and diverse hardware. It’s a lot more polished and versatile than what any single company feasibly could develop on their own, without putting a lot of resources behind it.
As a manufacturer it also provides you with access to a large pool of developers that are immediately able to develop for your platform.
Linux.com: What are some practical use cases?
Foss: The new part here is the ability to run Android on top of the regular Linux graphics stack. Being able to do this with mainline/upstream kernels and drivers allows you to take advantage of new features and improvements in kernels as well, not just depend on whatever massively forked BSP you get from your vendor.
For any GPU that has reasonable standard Linux support, you are now able to run Android on top of it. This was not the case before. And in that way it is hugely enabling and empowering.
It also matter in the sense, that it incentivizes GPU designers to work with upstream for their drivers. Now there’s a straightforward path for them to provide one driver that works for Android and Linux with no added effort. Their costs will be lower, and maintaining their GPU driver upstream is a lot more appealing.
For example, we would like to see mainline support Qualcomm SOCs, and we would like to be a part of making that a reality.
To summarize, this will help the hardware ecosystem get better software support and the software ecosystem have more hardware to work with.
It improves the economy of SBC/devboard manufacturers: they can provide a single well-tested stack which works on both, rather than having to provide a “Linux stack” and an Android stack.
It simplifies work for driver developers, since there’s just a single target for optimisation and enablement.
It enables the Android community, since Android running on mainline allows them to share the upstream improvements being made.
It helps upstream, because we get a product-quality stack, that has been tested and developed with help from the designer of the hardware.
Previously, Mesa was looked upon as a second-class stack, but it’s now shown that it is up-to-date (fully compliant with Vulkan 1.0, OpenGL 4.6, OpenGL ES 3.2 on release day), as well as performant, and product quality.
That means that driver developers can be involved in Mesa, and be confident that they’re sharing in the hard work of others, and also getting a great base to build on.
The Linux desktop has come a very long way from its humble beginnings. Back in my early days of using Linux, knowledge of the command line was essential—even for the desktop. That’s no longer true. Many users might never touch the command line. For Linux system administrators, however, that’s not the case. In fact, for any Linux admin (be it server or desktop), the command line is a requirement. From managing networks, to security, to application and server settings—there’s nothing like the power of the good ol’ command line.
But, the thing is… there are a lotof commands to be found on a Linux system. Consider /usr/bin alone and you’ll find quite a lot of commands (you can issue ls /usr/bin/ | wc -lto find out exactly how many you have). Of course, these aren’t all user-facing executables, but it gives you a good idea of the scope of Linux commands. On my Elementary OS system, there are 2029 executables within /usr/bin. Even though I will use only a fraction of those commands, how am I supposed to remember even that amount?
Fortunately, there are various tricks and tools you can use, so that you’re not struggling on a daily basis to remember those commands. I want to offer up a few such tips that will go a long way to helping you work with the command line a bit more efficiently (and save a bit of brain power along the way).
We’ll start with a built-in tool and then illustrate two very handy applications that can be installed.
Bash history
You may or may not know this, but Bash (the most popular Linux shell) retains a history of the commands you run. Want to see it in action? There are two ways. Open up a terminal window and tap the Up arrow key. You should see commands appear, one by one. Once you find the command you’re looking for, you can either use it as is, by hitting the Enter key, or modify it and then execute with the Enter key.
This is a great way to re-run (or modify and run) a command you’ve previously issued. I use this Linux feature regularly. It not only saves me from having to remember the minutiae of a command, it also saves me from having to type out the same command over and over.
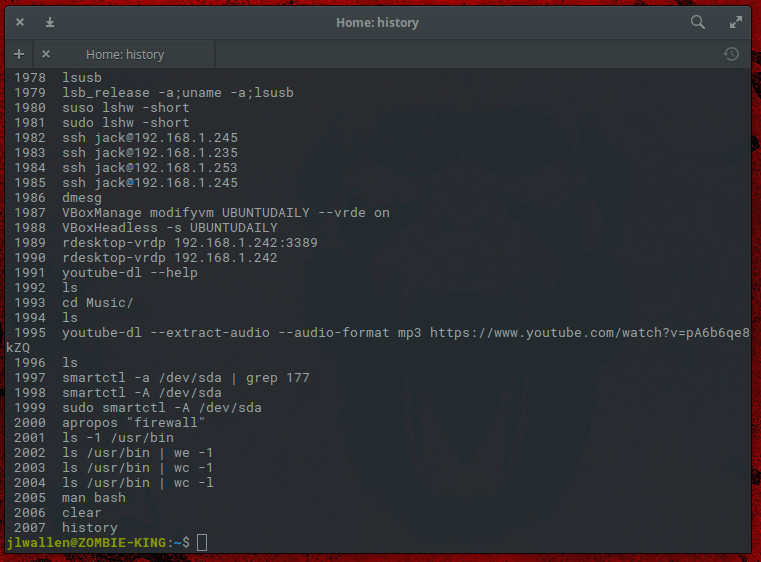
Speaking of the Bash history, if you issue the command history, you will be presented with a listing of commands you have run in the past (Figure 1).
Figure 1: Can you spot the mistake in one of my commands?
The number of commands your Bash history holds is configured within the ~/.bashrc file. In that file, you’ll find two lines:
HISTSIZE=1000HISTFILESIZE=2000
HISTSIZE is the maximum number of commands to remember on the history list, whereas HISTFILESIZE is the maximum number of lines contained in the history file.
Clearly, by default, Bash will retain 1000 commands in your history. That’s a lot. For some, this is considered an issue of security. If you’re concerned about that, you can shrink the number to whatever gives you the best ratio of security to practicality. If you don’t want Bash to remember your history, set HISTSIZE to 0.
If you make any changes to the ~/.bashrc file, make sure to log out and log back in (otherwise the changes won’t take effect).
Apropos
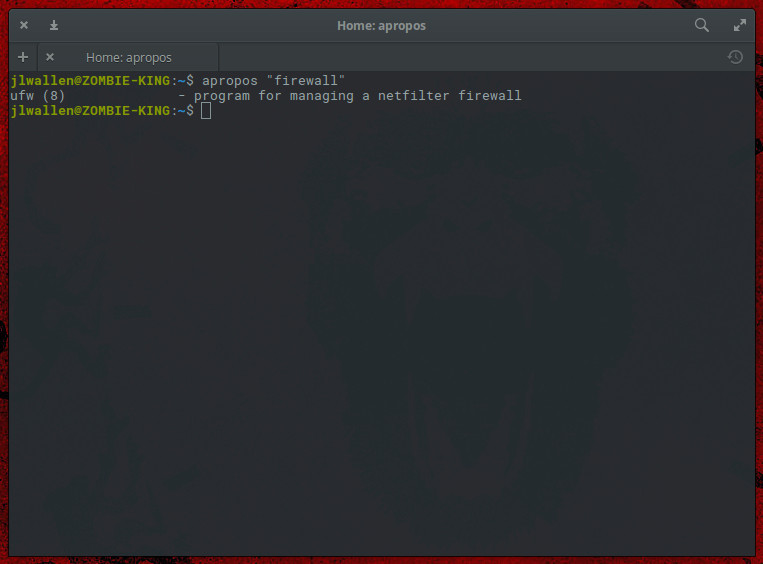
This is the first of two tools that can be installed to assist you in recalling Linux commands. Apropos is able to search the Linux man pages to help you find the command you’re looking for. Say, for instance, you don’t remember which firewall tool your distribution uses. You could type apropos “firewall” and the tool would return any related command (Figure 2).
Figure 2: What is your firewall command?
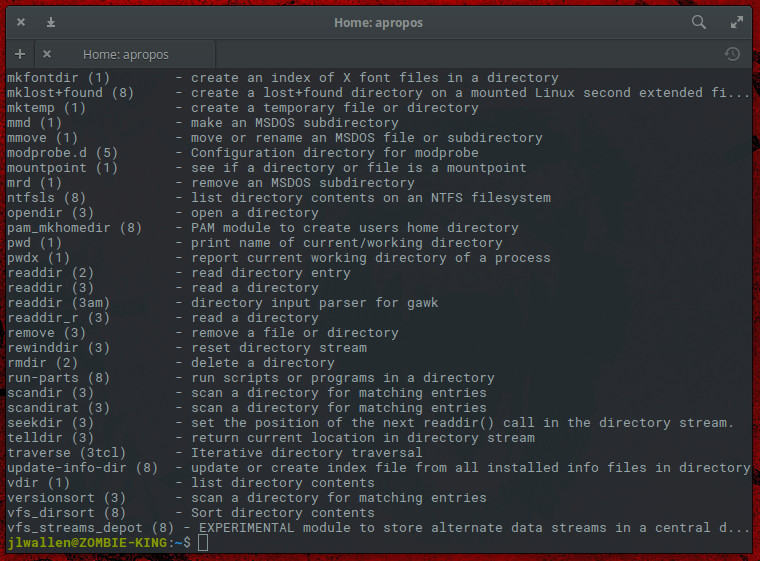
What if you needed a command to work with a directory, but had no idea what command was required? Type apropos “directory” to see every command that contains the word “directory” in its man page (Figure 3).
Figure 3: What was that tool you used on a directory?
The apropos tool is installed, by default, on nearly every Linux distribution.
Fish
There’s another tool that does a great job of helping you recall commands. Fish is a command line shell for Linux, Unix, and Mac OS that has a few nifty tricks up its sleeve:
Autosuggestions
VGA Color
Full scriptability
Web Based configuration
Man Page Completions
Syntax highlighting
And more
The autosuggestions make fish a really helpful tool (especially when you can’t recall those commands).
As you might expect, fish isn’t installed by default. For Ubuntu (and its derivatives), you can install fish with the following commands:
sudo apt-add-repository ppa:fish-shell/release-2sudo apt updatesudo apt install fish
For the likes of CentOS, fish can be installed like so. Add the repository with the commands:
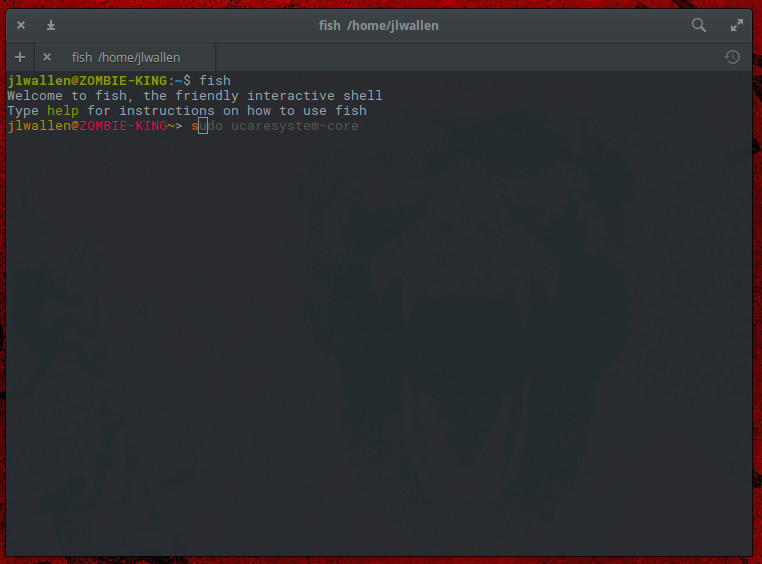
Using fish isn’t quite as intuitive as you might expect. Remember, fish is a shell, so you have to enter the shell before using the command. From your terminal, issue the command fish and you will find yourself in the newly install shell (Figure 4).
Figure 4: The fish interactive shell.
Start typing a command and fish will automatically complete the command. If the suggested command is not the one you’re looking for, hit the Tab key on your keyboard for more suggestions. If it is the command you want, type the right arrow key on your keyboard to complete the command and then hit Enter to execute. When you’re done using fish, type exit to leave that shell.
Fish does quite a bit more, but with regards to helping you remember your commands, the autosuggestions will go a very long way.
Keep learning
There are so many commands to learn on Linux. But don’t think you have to commit every single one of them to memory. Thanks to the Bash history and tools like apropos and fish, you won’t have to strain your memory much to recall the commands you need to get your job done.
Learn more about Linux through the free “Introduction to Linux” course from The Linux Foundation and edX.
As organizations shift their application strategies to embrace the cloud-native world, the purpose of the cloud transitions from saving money to delivering and managing applications. Platforms such as Cloud Foundry, Kubernetes, and Docker redefine the possibilities for application environments that utilize the cloud. It’s time for us as operations professionals to rethink how we approach our jobs in this new world. We should be asking, how do our organizations take advantage of cloud-native as a new mode of application delivery?
In addressing this question, we should strive to make our platforms and services as easy to consume as possible. Both the developer and the consumer rely on us to hide operational complexity and maintain freedom of choice. For the sake of both groups, we should recognize four pillars of cloud-native operations: …
When you start comparing computers, you probably pit Windows against macOS—but Linux rarely gets a mention. Still, this lesser-known operating system has a strong and loyal following. That’s because it offers a number of advantages over its competitors.
Whether you’re completely new to Linux or have dabbled with it once or twice already, we want you to consider running it on your next laptop or desktop—or alongside your existing operating system. Read on to decide if it’s time to make the switch.
What is Linux?
If you’re already familiar with Linux, you can skip this section. For everyone else, Linux is a free open-source operating system, which means the code is available for anyone to explore. Technically speaking, the term “Linux” refers to just the kernel, or the core, of the code. However, people often use the name to talk about the whole operating system, including the interface and bundled apps.
Microservices have been a focus across the open source world for several years now. Although open source technologies such as Docker, Kubernetes, Prometheus, and Swarm make it easier than ever for organizations to adopt microservice architectures, getting your team on the same page about microservices remains a difficult challenge.
For a profession that stresses the importance of naming things well, we’ve done ourselves a disservice with microservices. The problem is that that there is nothing inherently “micro” about microservices. Some can be small, but size is relative and there’s no standard measurement unit across organizations. A “small” service at one company might be 1 million lines of code, but far fewer at another organization.
Some argue that microservices aren’t a new thing at all, …
As mentioned previously, OPNFV integrates a number of upstream projects along with code contributions from the OPNFV community. To integrate and test these projects and contributions in an automated manner, the OPNFV project uses a variety of DevOps tools, hardware labs and a sophisticated CI pipeline. In fact, there is no better way for a telecom operator to absorb the principles of DevOps than by joining OPNFV.
Chapter 6 starts by discussing each of the various software and cloud-based tools used by OPNFV for DevOps:
Collaboration: JIRA/Confluence
Source code management and code review: Git, Gerrit, and GitHub
CI/software automation: Jenkins
Artifact repository: Google cloud storage and Docker hub
Let’s take a closer look at Gerrit, for example.
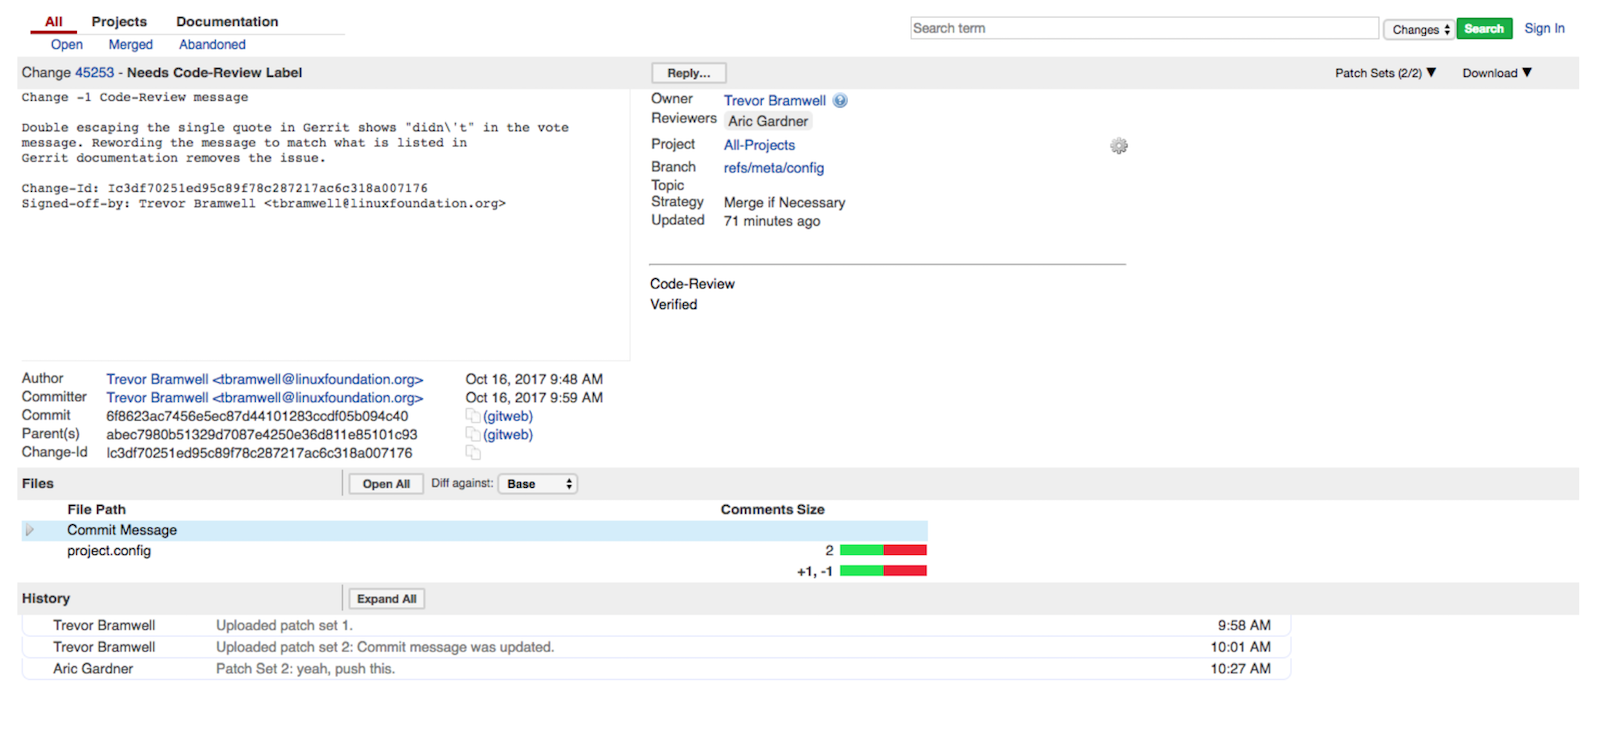
Code Reviews – Gerrit
Committing to master requires an approval process, and this process is managed through a tool called Gerrit. Gerrit is an open source web-based code review tool developed by Google. All changes pushed by contributors using a git push or git review command are reviewed in Gerrit by a set of reviewers, who view and inspect the patch. Reviewers also get to see the results of a continuous integration (CI) build and automated verify test run. Reviewers provide scores of +2, +1, -1 or -2. A +2 is a definite accept, while a -2 is a definite reject. A +1 or -1 may result in the change being accepted, rejected or sent back for changes.
OPNFV Gerrit
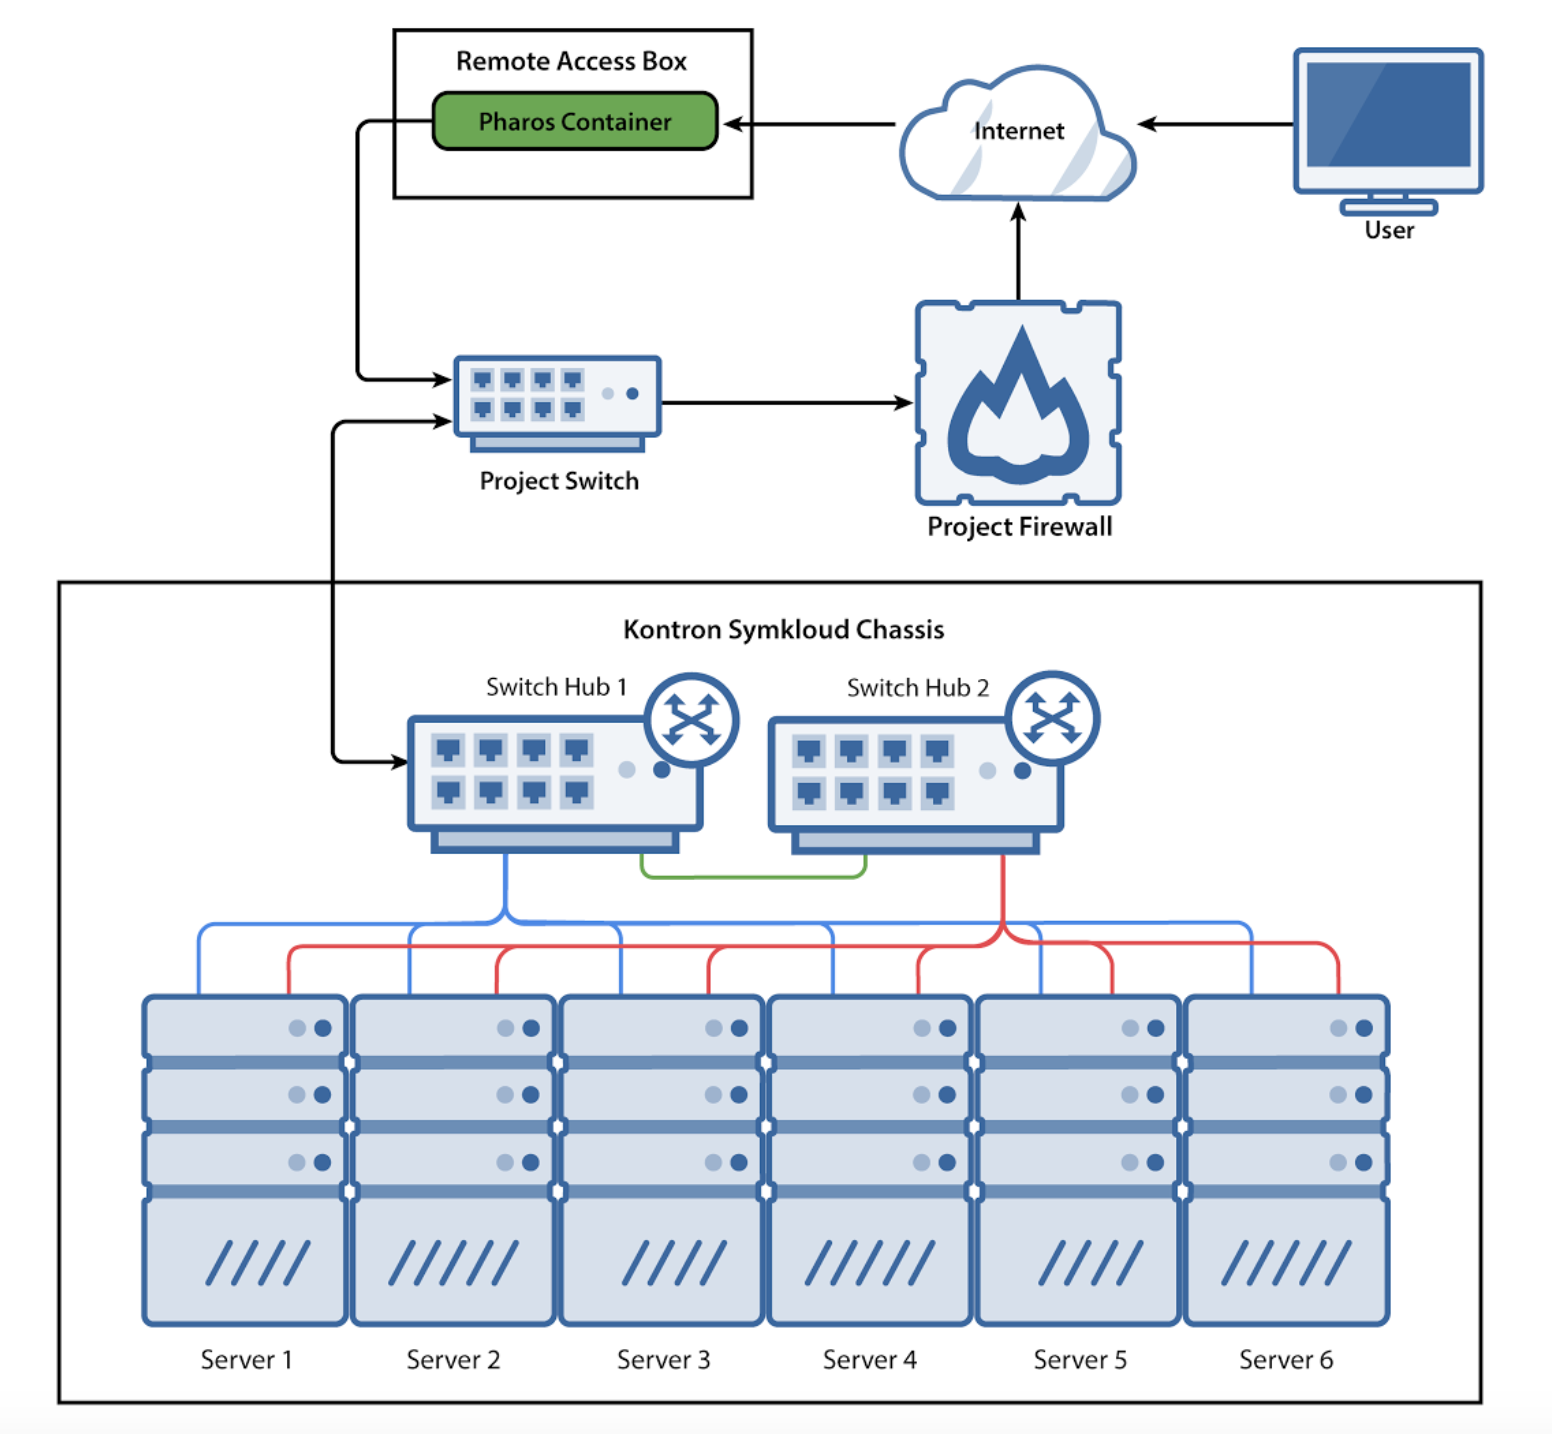
The chapter then describes the hardware labs used for automated integration and testing jobs. OPNFV has defined a standardized set of hardware, called a Pharos lab, consisting of 6 nodes and associated switches to automatically deploy OPNFV software by using the CI pipeline. The Pharos lab concept has been very successful with 16 labs distributed all around the world working seamlessly.
Centre of Excellence in Next Generation Networks Pharos Lab
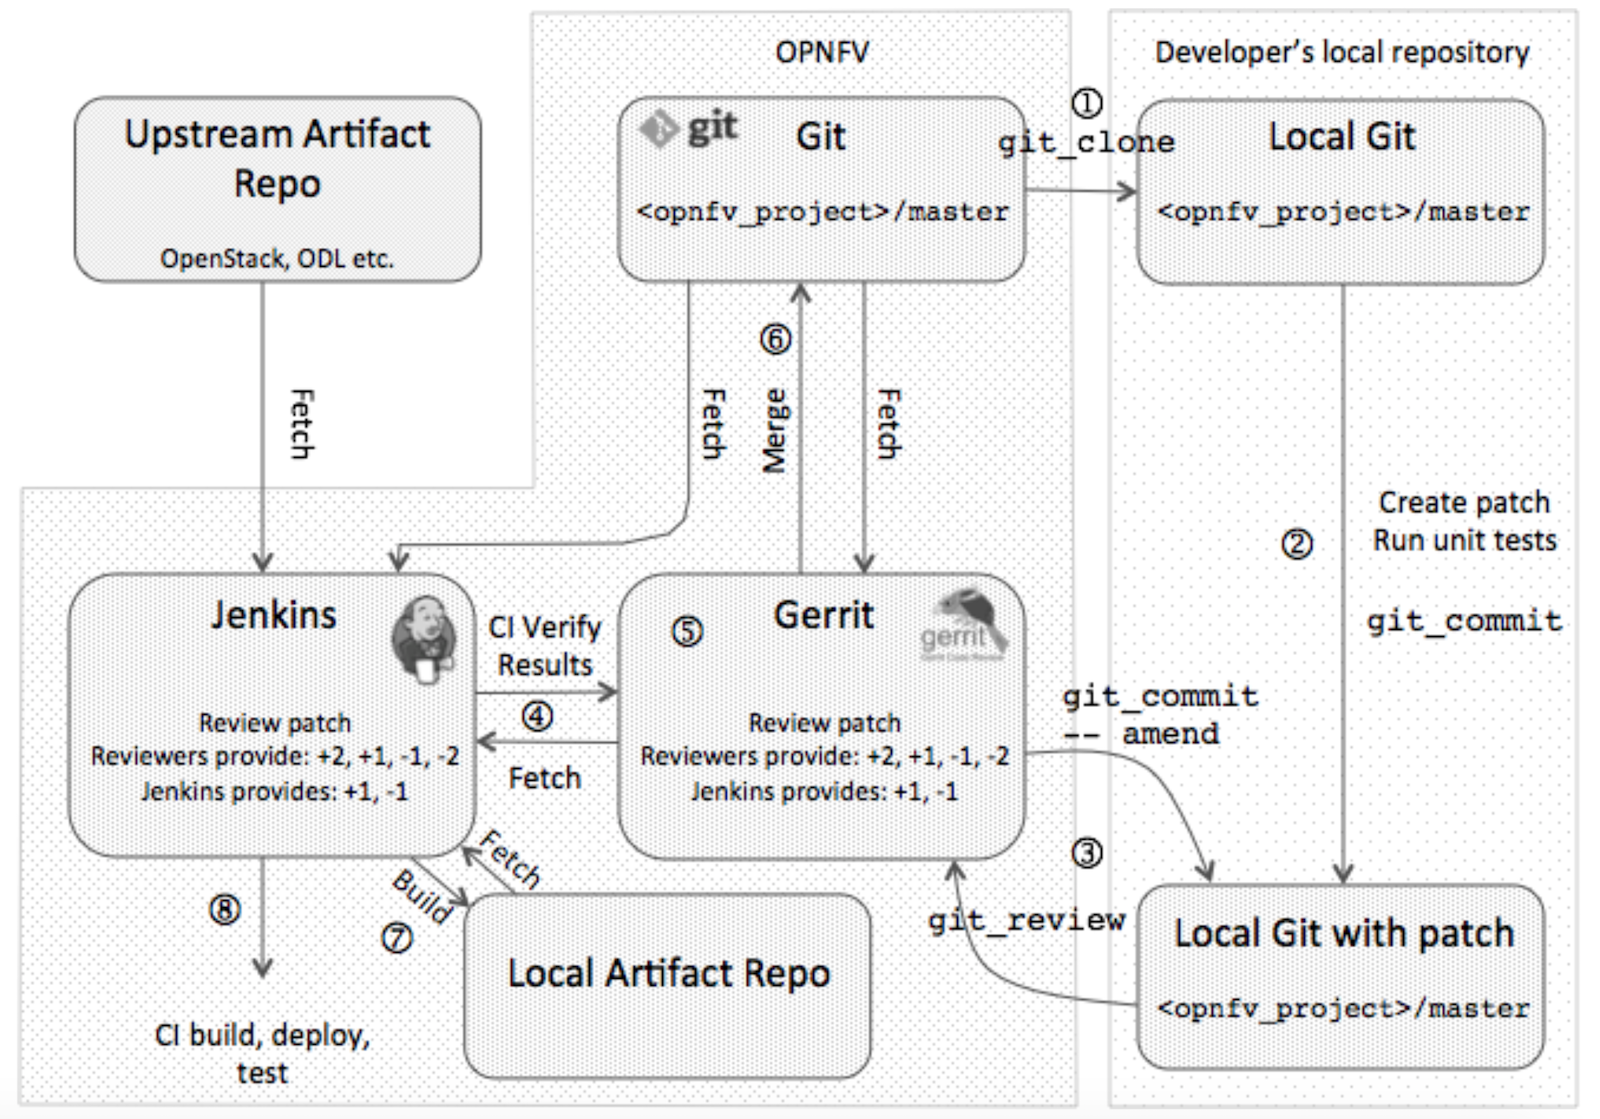
Chapter 6 continues by describing the CI pipeline in detail, where changes in upstream projects or community code contributions trigger integration jobs and specific time-durations (such as daily, weekly) trigger testing jobs. The CI pipeline diagram from the book is shown below:
OPNFV CI Pipeline
Chapter 7 start by exploring the concept of OPNFV scenarios. Since OPNFV allows for multiple choices for different software layers, numerous permutations are possible. In addition to the different upstream projects described in the previous blog, OPNFV also allows for diversity in installers. The list of scenarios represents a subset of all possible permutations; effectively each scenario is a tested reference architecture. Examples of scenarios are:
OpenStack + ODL + L3 FD.io + High Availability (HA) using the Apex installer, or
OpenStack + OpenContrail + HA using the JOID installer
The OPNFV Danube release had 55 scenarios. However, if we ignore non-HA scenarios and the specific installer used, we are down to 21 distinct usable scenarios.
The chapter continues by providing an overview of the 4 major installers used in the Danube release: Apex, Compass, Fuel and JOID, and ends with a discussion of additional deployment related projects such as Daisy (a new installer), IPv6, Parser, ARMBand (to run OPNFV on ARM), and FastDataStacks (FD.io with OPNFV).
Want to learn more? You can check out the previous blogpost that discussed the broader NFV transformation complexities and how OPNFV solves an important piece of the puzzle, download the Understanding OPNFV ebook in PDF (in English or Chinese), or order a printed version on Amazon.
Samsung’s DeX is a clever way to turn your phone into a desktop computer. However, there’s one overriding problem: you probably don’t have a good reason to use it instead of a PC. And Samsung is trying to fix that. It’s unveiling Linux on Galaxy, an app-based offering that (surprise) lets you run Linux distributions on your phone. Ostensibly, it’s aimed at developers who want to bring their work environment with them wherever they go. You could dock at a remote office knowing that your setup will be the same as usual.
You can learn an amazing amount of information about your network connections with these three glorious Linux networking commands. iftop tracks network connections by process number, Nethogs quickly reveals what is hogging your bandwidth, and vnstat runs as a nice lightweight daemon to record your usage over time.
iftop
The excellent iftop listens to the network interface that you specify, and displays connections in a top-style interface.
This is a great little tool for quickly identifying hogs, measuring speed, and also to maintain a running total of your network traffic. It is rather surprising to see how much bandwidth we use, especially for us old people who remember the days of telephone land lines, modems, screaming kilobits of speed, and real live bauds. We abandoned bauds a long time ago in favor of bit rates. Baud measures signal changes, which sometimes were the same as bit rates, but mostly not.
If you have just one network interface, run iftop with no options. iftop requires root permissions:
$ sudo iftop
When you have more than one, specify the interface you want to monitor:
$ sudo iftop -i wlan0
Just like top, you can change the display options while it is running.
h toggles the help screen.
n toggles name resolution.
s toggles source host display, and d toggles the destination hosts.
s toggles port numbers.
N toggles port resolution; to see all port numbers toggle resolution off.
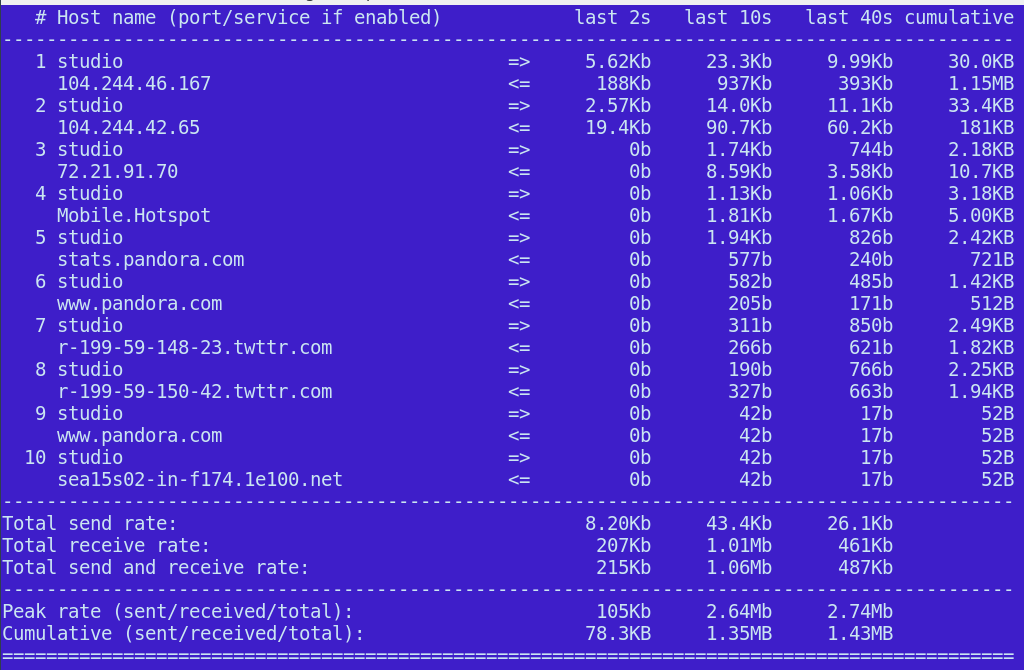
t toggles the text interface. The default display requires ncurses. I think the text display is more readable and better-organized (Figure 1).
p pauses the display.
q quits the program.
Figure 1: The text display is readable and organized.
When you toggle the display options, iftop continues to measure all traffic. You can also select a single host to monitor. You need the host’s IP address and netmask. I was curious how much of a load Pandora put on my sad little meager bandwidth cap, so first I used dig to find their IP address:
$ dig A pandora.com
[...]
;; ANSWER SECTION:
pandora.com.            267     IN      A       208.85.40.20
pandora.com.            267     IN      A       208.85.40.50
Is that not seriously groovy? I was surprised to learn that Pandora is easy on my precious bits, using around 500Kb per hour. And, like most streaming services, Pandora’s traffic comes in spurts and relies on caching to smooth out the lumps and bumps.
You can do the same with IPv6 addresses, using the -G option. Consult the fine man page to learn the rest of iftop’s features, including customizing your default options with a personal configuration file, and applying custom filters (see PCAP-FILTER for a filter reference).
Nethogs
When you want to quickly learn who is sucking up your bandwidth, Nethogs is fast and easy. Run it as root and specify the interface to listen on. It displays the hoggy application and the process number, so that you may kill it if you so desire:
$ sudo nethogs wlan0

NetHogs version 0.8.1

PID USER   PROGRAM              DEV    SENT   RECEIVED
7690 carla /usr/lib/firefox     wlan0 12.494 556.580 KB/sec
5648 carla .../chromium-browser wlan0  0.052   0.038 KB/sec
TOTAL                                 12.546 556.618 KB/sec
Nethogs has few options: cycling between kb/s, kb, b, and mb, sorting by received or sent packets, and adjusting the delay between refreshes. See man nethogs, or run nethogs -h.
vnstat
vnstat is the easiest network data collector to use. It is lightweight and does not need root permissions. It runs as a daemon and records your network statistics over time. The vnstat command displays the accumulated data:
By default it displays all network interfaces. Use the -i option to select a single interface. Merge the data of multiple interfaces this way:
$ vnstat -i wlan0+eth0+eth1
You can filter the display in several ways:
-h displays statistics by hours.
-d displays statistics by days.
-w and -m displays statistics by weeks and months.
Watch live updates with the -l option.
This command deletes the database for wlan1 and stops watching it:
$ vnstat -i wlan1 --delete
This command creates an alias for a network interface. This example uses one of the weird interface names from Ubuntu 16.04:
$ vnstat -u -i enp0s25 --nick eth0
By default vnstat monitors eth0. You can change this in /etc/vnstat.conf, or create your own personal configuration file in your home directory. See man vnstat for a complete reference.
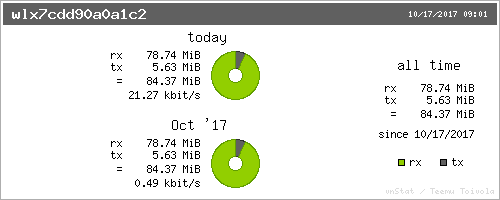
You can also install vnstati to create simple, colored graphs (Figure 2):
$ vnstati -s -i wlx7cdd90a0a1c2 -o vnstat.png
Figure 2: You can create simple colored graphs with vnstati.
See man vnstati for complete options.
Learn more about Linux through the free “Introduction to Linux” course from The Linux Foundation and edX.