Now I talk regularly at local meetups and I went as a speaker to few big conferences. Given that I am no expert in public speaking, my heart beat rises and occasionally words scramble as I am on the stage. But still, I will give you some reasons, why you should speak at conferences or at least attend them.
One of the influencers from Microsoft tweeted that attending conferences will show you the path to what to learn next. He is right, because honestly people can’t remember everything from all the talks (at least in my case). Usually there will be around 6 to 8 talks in a day at any given conference, So when you are presented with that much information on different topics in a single day, you won’t learn much as your brain will be overwhelmed with information.
Open Source Summit North America in Los Angeles was packed with keynotes, technical sessions, and special presentations, including a conversation with Linux creator Linus Torvalds. In case you couldn’t make it, CodePop.com’s Gregg Pollack has put together some short videos recapping highlights of the event.
OSN Days are a fantastic opportunity for network developers and users to learn how ONAP, OPNFV, OpenDaylight and other open source initiatives are changing NFV/SDN orchestration and networking solutions. Stops on the tour include: Paris, Milan,Stockholm,London,Tel Aviv, and Japan.Register today for an upcoming OSN Day in your region.
The day-long events will start with a plenary session where attendees will hear from site hosts and The Linux Foundation speakers on the state of the industry and the collaboration and touch points between projects that make up the open source networking stack. Presenters will also explore how business opportunities like 5G and IoT are enabled by network transformation. In the afternoon, events may feature technical sessions, tutorials, demonstrations, and workshops that empower attendees to participate, contribute, and deepen their knowledge of open source networking.
At many organizations, managing containerized applications at scale is the order of the day (or soon will be). And few open source projects are having the impact in this arena that Kubernetes is.
Above all, Kubernetes is ushering in “operations transformation” and helping organizations make the transition to cloud-native computing, says Craig McLuckie co-founder and CEO of Heptio and a co-founder of Kubernetes at Google, in a recent free webinar, ‘Getting to Know Kubernetes.’ Kubernetes was created at Google, which donated the open source project to theCloud Native Computing Foundation.
As was historically true for the very first Local-Area Networks and Linux alike, McLuckie noted that small groups of upstart staffers at many organizations are driving operational change by adopting Kubernetes.
I’ve been using the lm-sensors tool ever since CPUs became hot enough to melt themselves. It monitors CPU temperature, fan speeds, and motherboard voltages. In this two-part series, I’ll explain some advanced uses of lm-sensors, and look at some of the best graphical interfaces to use with it.
Install and Run
Install lm-sensors, then run it with no options to see what it does:
This is on an Ubuntu PC. My openSUSE Leap system installs it with a working configuration, but Ubuntu needs some additional tweaking. Run sensors-detect to set it up to detect even more stuff. The safe method is to accept all of the defaults by pressing the return key to answer every question:
$ sudo sensors-detect
# sensors-detect revision 6284 (2015-05-31 14:00:33 +0200)
# Board: ASRock H97M Pro4
# Kernel: 4.4.0-96-generic x86_64
# Processor: Intel(R) Core(TM) i7-4770K CPU @ 3.50GHz (6/60/3)

This program will help you determine which kernel modules you need
to load to use lm_sensors most effectively. It is generally safe
and recommended to accept the default answers to all questions,
unless you know what you're doing.

Some south bridges, CPUs or memory controllers contain embedded sensors.
Do you want to scan for them? This is totally safe. (YES/no):

[...]
When it finishes scanning, it will ask you if you want it to modify /etc/modules:
To load everything that is needed, add this to /etc/modules:
#----cut here----
# Chip drivers
coretemp
nct6775
#----cut here----
If you have some drivers built into your kernel, the list above will
contain too many modules. Skip the appropriate ones!

Do you want to add these lines automatically to /etc/modules? (yes/NO)
Before you answer, look in your kernel configuration file to see if the drivers are built-in, or are loadable modules. If they are built-in then don’t modify /etc/modules. If they are modules, then modify /etc/modules. This is what loadable modules look like in my /boot/config-4.4.0-96-generic file:
A feast of information! Much of which is not useful because devices do not exist or are not connected, like most of the fan sensors. On Ubuntu I disabled these in /etc/sensors3.conf with the ignore directive:
ignore fan1
ignore fan3
ignore fan4
ignore fan5
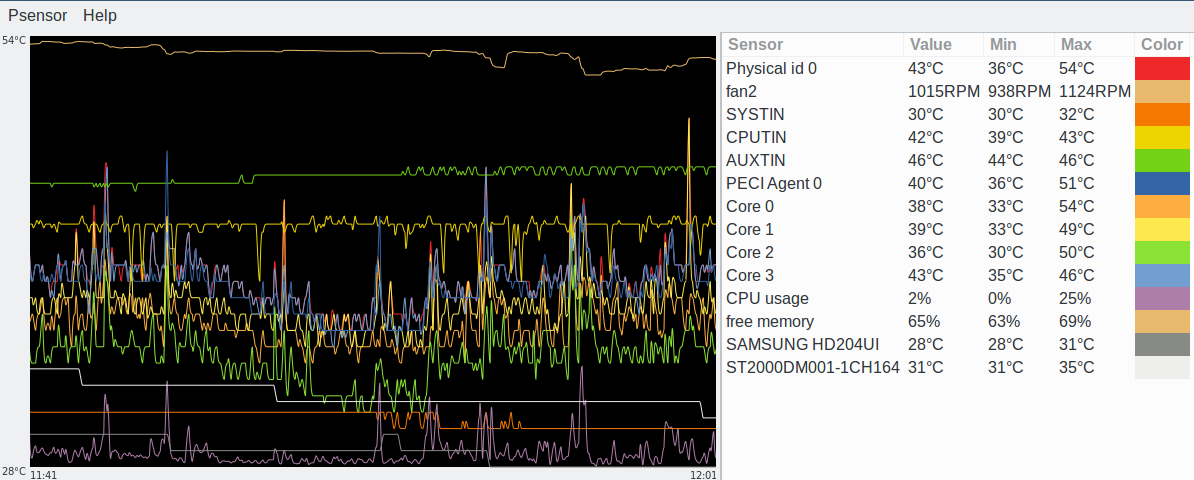
Now when I run sensors the output does not include those (Figure 1). You should be able to put your customizations in files in /etc/sensors.d, but this doesn’t work on my Ubuntu machine.
Learn how to use lm-sensors to monitor CPU temperature, fan speeds, and motherboard voltages.
What do Those Things Mean?
CPUTIN is CPU temperature index, AUXTIN is auxiliary temperature index, and SYSTIN is system temperature index. These are all sensors on the motherboard. AUXTIN is the power supply temperature sensor, and SYSTIN measures motherboard temperature. Core temperature is different from CPUTIN as it reads from a sensor on your CPU.
HYST is short for hysteresis. This is the value that you want an alarm to turn off. For example, if your alarm temperature is 80C, set your HYST value to stop the alarm when the temperature falls to 75C.
Get the Specs
The basic lm-sensors monitoring of CPU temperatures may be enough for you. However, you can finely-tweak lm-sensors for greater accuracy, change labels, and run it as a daemon. You need the spec sheet for your motherboard (which will also help make sense of your lm-sensors output). Find your exact motherboard model and version by running $ sudo dmidecode -t 2. The kernel driver documentation is also useful. For example, this is the kernel spec for my nct6775 driver.
Come back next week and we’ll learn even cooler advanced uses of lm-sensors.
Learn more about Linux through the free “Introduction to Linux” course from The Linux Foundation and edX.
Inclusivity is the quality of an open organization that allows and encourages people to join the organization and feel a connection to it. Practices aimed at enhancing inclusivity are typically those that welcome new participants to the organization and create an environment that makes them want to stay.
When we talk about inclusivity, we should clarify something: Being “inclusive” is not the same as being “diverse.” Diversity is a product of inclusivity; you need to create an inclusive community in order to become a diverse one, not the other way around. The degree to which your open organization is inclusive determines how it adapts to, responds to, and embraces diversity in order to improve itself. Interestingly enough, the best way to know which organizational changes will make your group more inclusive is to interact with the people you want to join your community.
When learning how to code for the first time, there’s a common misconception that learning how to code is primarily about learning the syntax of a programming language. That is, learning how the special symbols, keywords, and characters must be written in the right order for the language to run without errors.
However, focusing only on knowledge of syntax is a bit like practicing to write a novel by only studying grammar and spelling. Grammar and spelling are needed to write a novel, but there are many other layers of skills that are needed in order to write an original, creative novel.
Similarly, to be developer and write original, creative code we need other layers of skills in addition to syntax. Here is one way to organize these skills into what I call the four layers of programming skills:
Syntax skills
This is the layer that is most often focused on in the early learning phase. Syntax skills essentially means how to read and write a programming language using the rules for how different characters must be used for the code to actually work.
It’s not every day you see this group of companies agree on anything, but as Kubernetes has developed into an essential industry tool, each of these companies sees it as a necessity to join the CNCF and support its mission. This is partly driven by customer demand and partly by the desire to simply have a say in how Kubernetes and other related cloud-native technologies are developed.
For those of you who might not be familiar with this organization, it is the part of the Linux Foundation that houses Kubernetes, the open source project originally developed at Google.
If you’re a software developer today, you know how to use open source software, but do you know how and why open source licensing started? A little background will help you understand how and why the licenses work the way they do.
Origins of open source licensing
Technologists today, having grown up in the age of Microsoft Windows and proprietary software, may believe that open source licensing is a recent trend that began in the 1990s. Although open source licensing’s popularity has skyrocketed in the past two decades, in truth, open source was the original model for software licensing, with proprietary licensing coming later.
In fact, the two models for software licensing (open source and proprietary) trace their origins from a common source: the Unix operating system. Unix was developed by AT&T Bell Laboratories in the late 1960s and early 1970s and was the first general-purpose operating system. At that time, AT&T’s market position was so dominant that the US Justice Department issued a consent decree barring AT&T from engaging in commercial activities outside the field of its telephone service, which was AT&T’s primary business. Because of the consent decree, AT&T could not exploit Unix as a commercial product, so Bell Labs gave Unix away in source code form under terms that allowed its modification and redistribution. This led to Unix’s widespread use and popularity among computer scientists in the 1970s and 1980s.
After the US Justice Department lifted the consent decree in 1983, AT&T pivoted to commercialize Unix as a proprietary product and adopted more restrictive licensing terms that allowed Unix to be redistributed only in object code format.
As the chief technology officer of a company specialized in cloud native storage, I have a first hand view of the massive transformation happening right now in enterprise IT. In short, two things are happening in parallel right now that make it radically simpler to build, deploy and run sophisticated applications.
The first is the move to the cloud. This topic has been discussed so much that I won’t try to add anything new. We all know it’s happening, and we all know that its impact is huge.
The second is the move to cloud-native architectures. Since this is a relatively new development, I want to focus on it — and specifically on the importance of pluggable Cloud-Native architectures — in today’s post. But before diving into how to architect for Cloud Native, let’s define it.