AMD and Intel released the first 64-bit CPUs for consumers back in 2003 and 2004. Now, more than a decade later, Linux distributions are looking at winding down support for 32-bit hardware.
Google already took this leap back in 2015, dumping 32-bit versions of Chrome for Linux.
Ubuntu is just the latest distro to plan for this
Ubuntu’s Dimitri John Ledkov put forth a proposal to wind down 32-bit support on the Ubuntu mailing list recently. Hardware that can’t run 64-bit software is becoming much less common, while creating 32-bit images, testing them, and supporting them takes time and effort. (On Linux, the “i386” architecture is the standard 32-bit for Intel-compatible CPUs, while “amd64” is the 64-bit architecture originally made by AMD that Intel CPUs are compatible with.)
When we talk about NGINX, we are clear on the fact that we’re discussing one of the applications that has been revolutionizing the web server industry. It has not only grown bigger in terms of use than other solutions like IIS, but also it’s taking a big chunk of the pie from the general web server market (lead by Apache), with over 140 million servers running on this application.
Due to the growth in the number of web servers that run NGINX, it’s becoming more necessary to not only monitor these systems, but also they should integrate in the global monitoring for any IT infrastructure.
To perform a correct monitoring scheme on NGINX, the software offers two possible alternatives:
its module nginx_status, included with all versions of NGINX
the recently launched NGINX Plus Status Module, available on the paid version of the app.
Next, we’ll list the different traits corresponding to each of the different ways we can monitor NGINX, in order to end up giving you some recommendations on when to use one or another and how to use them.
NGINX Status Module
In order to activate this module we need to insert a URL we’ll associate to the monitoring module in the NGINX configuration.
With this directive and, after having configured NGINX to allow it to show monitoring data via the parameter –with-http_stub_status_module, we’ll be able to access the /server-status URL for our server, receiving varied data related to our server’s status. Data like the number of active connections, amount of queued queries, amount or read/write requests, and number of active customers.
Nginx Plus Status Module
This is the module that NGINX has developed to be able to offer a larger amount of information on our server’s status. One of the large advantages that this module has is that, apart from giving a lot more information, it also offers a console to be able to check your NGINX server’s status in real time.
Apart from being able to see all the information on a dashboard, this module allows us to access the following data that the previous module wouldn’t allow: both information related to the number of mistaken requests and code (4xx, 5xx…) such as information on the cache, that’s shown with this module.
Another extra feature on the NGINX Plus Status module is that it allows users to see the performance data grouped according to ‘zones’.
Nginx status, Nginx Plus Status or simple monitoring
On this occasion the question has to be if we wish to install the Open Source edition of NGINX, or if we’ll choose to pay for NGINX Plus. When it comes to taking this decision we must know how to fundamentally stick to the needs that our web infrastructure has, rather than basing the decision on the monitoring process itself. Do we need load balancing? How about persistent login? Is our server reset so complex that we need to change immediately change configurations without resetting? If the answer to these questions is “yes”, then you should probably think about purchasing an NGINX Plus license.
Whether we have the Plus version of NGINX or not, it is highly recommendable that you perform good monitoring on your web infrastructure, regardless of what size it is, because if you’re on the Internet, your platform’s unavailability can generate costs that, on many occasions cannot be measured.
If your infrastructure is simple and only runs simple web pages, it’s quite recommendable to use HTTP monitoring services such as uptimerobot, for example. Going straight to the point: is my webpage active, yes or no? In this case, we wouldn’t need monitoring via NGINX and its status module.
In case our infrastructure is more complex, we have various databases, or a network with multiple nodes, routers or switches; then it’s recommended we use a server monitoring software.
This software will allow adding all your network elements on to the same monitoring dashboard, and will send alerts based on their status. When there’s an issue in our systems, it’s very important that we know where it’s coming from and what’s causing it as soon as possible, in order to counteract the possible issues generated from unavailability.
For this case, if we have the Plus version of NGINX, it’s quite recommendable to include the NGINX Plus Status module on our monitoring dashboard. For Pandora FMS this can be done following the steps in the video below.
In case you don’t have the paid version of NGINX we recommend you create a script that helps the monitoring system digest the information coming from the NGINX Status module. The main data can be obtained by calling on the URL where the NGINX Status module has been configured. Other important data like response times and error codes will require us to resort to the server logs and process them through a script in order to be able to show them on our alert and monitoring console. For further information, read this article on NGINX monitoring.
We hope this was all useful and that after reading this article, whatever your infrastructure is, you feel ready to monitor it correctly.
Linux Mint is a modern, polished, easy-to-use and comfortable community-driven GNU/Linux desktop distribution based on the popular Ubuntu Linux distribution. It is a great and recommended distribution for computer users switching from Windows or…
[[ This is a content summary only. Visit my website for full links, other content, and more! ]]
This tutorial shows how to set up a high-availability storage with two storage servers (CentOS 7.2) that use GlusterFS. Each storage server will be a mirror of the other storage server, and files will be replicated automatically across both storage servers. The client system (CentOS 7.2 as well) will be able to access the storage as if it was a local filesystem. GlusterFS is a clustered file-system capable of scaling to several peta-bytes.
You’ve probably already heard the open source cloud server ownCloud has been forked by its founder and the new company/server Nextcloud has been formed. What you might not know, however, is that Nextcloud has already released a ready-to-install server that offers the same functionality as ownCloud as well as a newfound focus on apps (Calendar, Contacts, Documents, Email, and more). What Nextcloud has to offer is really impressive so far and, by the time you finish reading this post (and walking through the steps), you can have a Nextcloud server on premises.
I will be demonstrating the installation of Nextcloud on a Ubuntu 16.04 desktop installation. This installation will start with installing LAMP and conclude with you logging into your first Nextcloud cloud server. Most of this install will be done from the command line, so get ready to start typing.
Snap install
You should know that there are no DEB packages for Nextcloud. There is, however, a snap package to install. This means you can install Nextcloud with a single command:
sudo snap install nextcloud
You should also know, however, that the snap package is limited in what it can do. You will not be configuring this installation nearly as much as you would the standard installation. Because of this, I will give you the step-by-step for installing Nextcloud manually.
With that said, let’s get to the install.
LAMP
I’m going to assume you’re installing Nextcloud on a machine that doesn’t even include LAMP (Linux Apache MySQL PHP). To install the basic LAMP server, open up a terminal window and issue the following command:
sudo apt-get install lamp-server^
During the above installation, you’ll be prompted to enter (and verify) a password for MySQL. Once that is done, you’re ready to finish up your LAMP server install.
Nextcloud does require a few extra PHP modules to function properly. These modules can be installed with the following command:
You should now see the folder nextcloud in the current working directory. Move that folder with the command:
sudo mv nextcloud /var/www
The next step is to give the proper permission to the /var/www/nextcloudfolder (as well as its contents). Fortunately, Nextcloud has created a script for that very purpose. Copy the following and paste it into a file called nextcloud_permissions.sh.
Once you’ve saved that file, give it the proper execution privileges with the command sudo chmod +x nextcloud_permissions.sh and then run the file with the command sudo ./nextcloud_permissions.sh.
Apache configuration
Because we’re working with Ubuntu and Apache2, you’ll need to create a configuration file for Nextcloud in /etc/apache2/sites-available. Create a new file in that folder called nextcloud.conf with the following contents:
Alias /nextcloud "/var/www/nextcloud/"<Directory /var/www/nextcloud/> Options +FollowSymlinks AllowOverride All<IfModule mod_dav.c> Dav off</IfModule>SetEnv HOME /var/www/nextcloudSetEnv HTTP_HOME /var/www/nextcloud</Directory>
Save that file in /etc/apache2/sites-availableand then create a symlink to /etc/apache2/sites-enabledwith the command:
There are some recommended Apache modules to be enabled for Nextcloud. Issue the following commands to do this:
sudo a2enmod headers
sudo a2enmod env
sudo a2enmod dir
sudo a2enmod mime
The last thing to do is enable SSL. For this, issue the following commands:
a2enmod ssl
a2ensite default-ssl
service apache2 reload
Finally, restart Apache with the command:
sudo service apache2 reload
MariaDB configuration
Our final command-line configuration step creates the MariaDB database and configures the user for permissions. Here are the necessary commands:
sudo mysql -u root -p(You’ll be prompted for your MySQL root user password)
CREATE DATABASE nextcloud;
CREATE USER nextclouduser@localhost IDENTIFIED BY ‘PASSWORD’; (Where PASSWORD is a password you want to use for the nextcloud database users)
GRANT ALL PRIVILEGES ON nextcloud.* TO nextclouduser@localhost;
EXIT
Log in to Nextcloud
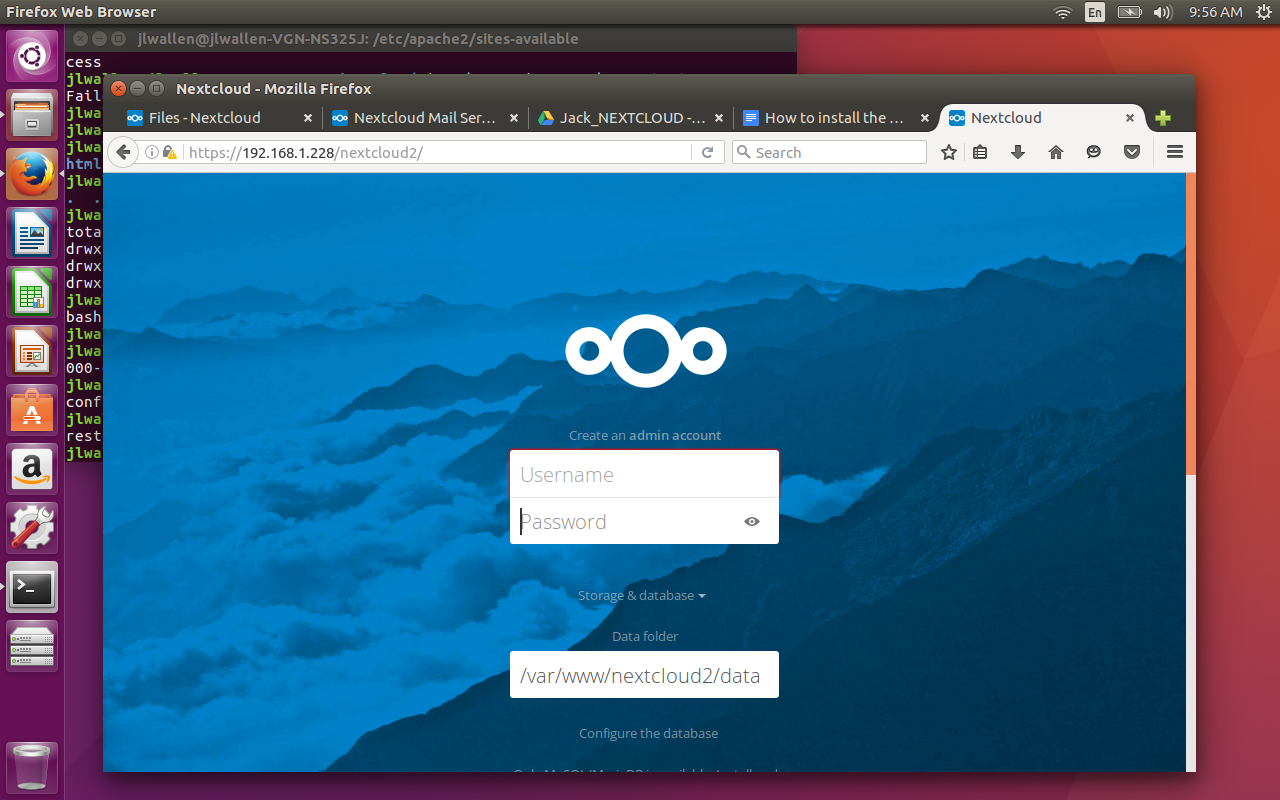
You’re finally ready to log in to your Nextcloud server. Point a browser to https://IP_OF_SERVER/nextcloud (where IP_OF_SERVER is the actual IP address of the server hosting Nextcloud).
Figure 1: Logging in to your Nextcloud installation.
You will be prompted to create an admin user, so enter a username and password for this user. Below this you should see a prompt asking for the Database user, Database password, and Database name (Figure 1 —all of which we created a moment ago).
Once logged in, you’re ready to start setting up Nextcloud to your liking!
What’s next?
What you do with Nextcloud is up to you. You can add new modules or just use it as a cloud-based file sync and share. You can install the Android app and even make use of the ownCloud desktop clients (they’ll work fine with Nextcloud). Regardless of what you do, it’s exciting to know that the technology will continue on and, hopefully, expand and grow.
Instead of starting a potentially very long, conceptual conversation about what DevOps means, it’s more effective to identify a small but non-trivial project or area of your business that would benefit from being able to develop and deploy software faster, at scale… and more easily.
This means getting teams and people from across the IT stack together and getting them working on that one project or area, because the results and benefits become rapidly apparent.
Which all sounds marvellous, but what then, are the key metrics for DevOps success? It’s time to ask ourselves some key questions here.
Even though they may not be familiar with the term “Internet of Things” (IoT), 65 percent of organizations are collecting data from equipment, devices, or other connected endpoints. And they’re using that data for business purposes, according to an IoT study conducted by 451 Research.
The vast majority of IoT data derives from data centers. More than half of IoT data (51 percent) is coming through data center IT equipment, followed by camera/surveillance equipment (34 percent), data center facilities equipment (33 percent), and smartphones (29 percent).
Eurotech’s rugged, IP40 protected “ReliaGate 20-26” IoT gateway runs Red Hat Linux on a Bay Trail Atom, and has cellular, GPS, WiFi, and Bluetooth options.
Eurotech’s ReliaGate 20-26 is the latest in a line of Internet of Things gateways, such as the ReliaGate 10-11, based on a TI AM3352 Sitara SoC, and the Intel Atom Z510-based ReliaGate 50-21. For the ReliaGate 20-26, Eurotech advances to a more modern “Bay Trail” Atom E3800.
I missed DockerCon live for its closing sessions but I saw a tweet from Jerome mentioning Ben Firshman about “Serverless” Docker.
And I really don’t know what does “Severless” mean. So I dig around and found it’s the Function-as-a-Service model. I studied this model a while ago to POC a Map-Reduce model (similar to Apache Spark) based on Docker but I made no progress.
Back to the example. Ben’s example is written in Python but I’m not a Python guy so I started looking around again. Ben pointed to Ahment’s go-dexec.