Could the transactional mechanism that drives Canonical’s IoT-focused Snappy Ubuntu Core help unify Linux and save it from fragmentation? Today, Canonical announced that the lightweight Snappy’s “snap” mechanism, which two months ago was extended to all Ubuntu users in Ubuntu 16.04, can also work with other Linux distributions. Snap could emerge as a universal Linux package format, enabling a single binary package “to work perfectly and securely on any Linux desktop, server, cloud or device,” says Canonical.
Snap works natively on Arch, Debian, and Fedora, in addition to Ubuntu-based distros like Kubuntu, Lubuntu, Ubuntu GNOME, Ubuntu Kylin, Ubuntu MATE, Ubuntu Unity, and Xubuntu. It is now being validated on CentOS, Elementary, Gentoo, Mint, openSUSE, RHEL, and OpenWrt.
Snap greatly simplifies third-party Linux app distribution, claims Canonical. ISVs can publish snaps rather than making tough decisions about which distros to support and then struggling to manage diverse package formats and security update mechanisms across multiple distributions.
The containerized snap technology offers better security than is available with typical package formats such as .deb, says Canonical. Snaps are isolated from one another to ensure security, and they can be updated or rolled back automatically. Each snap is confined using a range of tailored kernel isolation and security mechanisms and receives only the permissions it needs to operate.
Snaps sit alongside a Linux distro’s native packages and do not infringe on its own update mechanisms for those packages, says Canonical. The snap format is simpler than native internal package formats because it is focused only on applications rather than the core system. “Snaps are essentially self-contained zip files that can be executed very fast in place,” says the company. Stable releases, release candidates, beta versions, and daily builds of a snap can all be published simultaneously, supporting rolling releases.
Snap It Up
While the snap technology could help reduce desktop Linux app fragmentation, much of the focus is on the potentially much larger Internet of Things (IoT) market. Snap won’t solve all the interoperability challenges in Linux-based IoT, but it could go a long way toward unifying the upper application layer.
“We believe snaps address the security risks and manageability challenges associated with deploying and running multiple third party applications on a single IoT Gateway,” stated Jason Shepherd, Director, IoT Strategy and Partnerships, Dell.
Significantly, Samsung has endorsed the snap technology for its Artik embedded boards, which already supports Fedora.
Snaps can be based on existing distribution packages, but “are more commonly built from source for optimization and size efficiency,” says Canonical. Snaps are based on snapd, a free software project on GitHub, and snap packages are built using a “snapcraft” tool. A snapcraft.io project site has been established with documentation and step-by-step guides.
Mark Shuttleworth, founder of Canonical.
The press call was led by Ubuntu creator Mark Shuttleworth, and included reps from Samsung, Dell, and app vendor Mycroft, which is using snap for a voice-controlled smart-home IoT platform. Missing were leaders of other major Linux projects, but testimonials were provided by key contributors, such as: Arch, Debian, and OpenWrt. There were other testimonials from ISVs such as Mozilla and the Krita Foundation, which is releasing Krita 3.0 in the snap format.
According to Shuttleworth, the “stunning” and “surprising” emergence of snap as a universal package format was not even on his roadmap a few months ago. He said that when he told ISVs that Canonical was extending snap to classic Ubuntu, the response was overwhelming.
Shuttleworth conceded that there are other universal open source packaging solutions available, such as AppImage and the newer Flatpak, but argued that most lack the security and/or transactional nature of snap. “The snap mechanism has sophisticated capabilities in the way it delivers updated versions,” he said. “Snaps are perfectly transactional.”
In response to questions, Shuttleworth said that he could see no reason why the Snap mechanism could not be extended to Android. He also said that there was considerable interest among software defined radio (SDR) developers, following the lead of Lime Microsystem’s Snappy Ubuntu Core based LimeSDR. Other notable Ubuntu Snappy supporters have included Acer, GE, and Microsoft, to name a few.
A myriad of point-tools are involved in every organizations’ software production. Some of our enterprise customers report using over 50 tools along their pipeline – from code development all the way to releasing into Production. For the majority of development organizations today, these tools are comprised of a mix of commercial and Open Source (OSS) technologies.
Existing open source tools can be found throughout your software Dev and Ops teams – from programming languages, infrastructure and technology stacks, development and test tools, project management and bug tracking, source control management, CI, configuration management, and more – OSS is everywhere.
The proliferation of OSS technologies, libraries and frameworks in recent years has greatly contributed to the advancement of software development, increased developer productivity, and to the flexibility and customizability of the tools landscape to support different use cases and developers’ preferences.
To increase productivity and encourage a culture of autonomy and shared ownership – you want to enable teams to use their tool(s) of choice. That being said, since the advent of Agile development, we see large enterprises wrestle with striking a balance to allow this choice while also retaining a level of management, visibility and governance over all the technologies used in the software delivery lifecycle. And this problem gets harder over time – because with every passing day new tools are being created and adopted to solve increasingly fine-grained problems in a unique and valuable way.
Enterprises operating mission-critical applications need this level of control, not only to lower costs (with improved utilization of tools, infrastructure, etc.) or speed cycle times (with streamlined or standardized processes), but – more importantly – as a way to ensureoperability, compliance and SLAs.
The tools you’re using can be free, and your process can be faster. But, at the end of the day, no savings on the development side would justify the risks if you’re having trouble managing your applications in Production, or if you’re exposed from a security or regulatory standpoint.
I’d like to address two of the key challenges software executives face with regards to the use of OSS as part of the software development and release process, and how you can address them when adopting OSS, while mitigating possible risks.
Enabling Developers while Ensuring System-Level Management
The realities of software production in large enterprises involve a complex matrix of hundreds or thousands of inter-connected projects, applications, teams and infrastructure nodes. All of them using different OSS tools and work processes – creating management, visibility, scalability and interoperability challenges.
The multitude of point-tools involved also creates a problem of silos of automation. In this situation – each part of the work along the pipeline is carried out by a different tool, and the output of this work has to be exported, analyzed and handed-off to a different team and tool(s) for the next stage in the pipeline. These manual, error-prone handoffs are one of the biggest impediments to enterprise DevOps productivity – they not only slow down your process, but they also introduce risk and increase management overhead.
The fact that your process involves a lot of “best for the task” tools is pretty much a fact of life by now – and with (mostly) good reason. But these silos of automation do not have to be.
Enterprise DevOps initiatives require a unifying approach that coordinates, automates, and manages a disparate set of dozens of tools and processes across the organization. While you want to allow your developers to use the tools they’re used to, you also want to be able to manage the entire end-to-end process of software delivery, maintain the flexibility to include new tools as they are needed, and optimize the whole process across many teams and projects throughout the organization.
This is why enterprises today are opting to integrate their toolchains into an end-to-end DevOps Release Automation platform. To accelerate your pipeline and support better manageability of the entire process, you want a platform that can serve as a layer above (or below) any infrastructure or specific tools/technology and enable centralized management and orchestration of all your tools, environments and apps. This allows for the flexibility to manage the unique tool set of each team has today (or adopts tomorrow), while also tying all the tools together to eliminate silos of automation and provide cross-organization visibility, compliance and control.
Security Risks and Open Source:
Open source is not only prevalent in your toolchain, it’s also in your code and in yourinfrastructure. Many applications today incorporate OSS components and libraries, or rely on OSS technology stacks. Some estimate that more than a third of software code uses open source components, with some applications relying on as much as 70 percent open source code. As OSS use increases, so are the potential security vulnerabilities and breeches (think Heartbleed, Shellshock and POODLE.)
Commercial software is just as likely to include security bugs as OSS code. To mitigate these risks, you need to ensure you have the infrastructure in place to react and fix things quickly to resolve or patch any vulnerability that might come up.
By orchestrating all the tools and automating your end-to-end processes across Dev and Ops, a DevOps Release Automation platform also accelerates your lead time in these cases – so that you can develop, test, and deploy your update more quickly.
In addition, the historical tracking and easy visibility provided by some of these solutions into the state of all your applications, environments, and pipeline stages greatly simplifies your response. When you can easily identify which version of the application is deployed on which environment, and where the compromised bits are located, you can more quickly roll out your update in a faster, more consistent, and repeatable deployment process.
In conclusion:
When managing IT organizations and steering digital transformation in the enterprise, technology leaders need to support proper use of both OSS and commercial technologies as part of their toolchain, while putting the right systems in place to enableenterprise-scale, governance and security.
How do you know where OSS technologies are being used in your process, and if there are any inherent risks or major inefficiencies that need to be addressed as a result? Before you can start optimizing, you have to know exactly what your application lifecycle looks like. This holistic process is sometimes hard to encapsulate in large and complex organizations. I often see different stakeholders understanding only a fraction of the overall process, but lacking knowledge of the entire cross-organizational “pathway to production.” CIOs need to work with their teams to capture the end-to-end pipeline and toolchain, from code-commit all the way to production. This mapping is critical to finding the bottlenecks, breakages and inefficiencies that need to be addresses.
Then, work with your teams to pick the tools (whether they be OSS or not) that work best for the problem that you are trying to solve. Consider how you can orchestrate all these tools as part of a centralized platform. By being able to manage, track and provide visibility into all the tools, tasks, environments and data flow across your delivery pipeline, end-to-end DevOps automation supports extensibility and flexibility for different teams, while enabling system-level view and cross-organizational management for complex enterprise pipelines.
Along with cultural change, breaking the “silos of automation” goes a long way towards effectively breaking the silos between Dev and Ops, and unifying your processes towards one – shared – business goal: the faster delivery of valuable software to your end users.
Michael Ducy is known by many as the goat whisperer and co-host of the Goat Farm podcast and blog focused on DevOps in the enterprise. He is a champion for the idea that you should staff your DevOps team with curious, hungry individuals (goats) from within your company, rather than from the outside. When he isn’t blogging, podcasting or speaking at conferences, you can find him at Chef where he is Manager, Solutions Architects.
Michael Ducy is co-host of the Goat Farm podcast and Manager, Solutions Architects at Chef.Linux.com: Why are so many organizations embracing DevOps?
Michael Ducy: The way consumers are interacting with business has changed greatly. More and more consumers interact with a company using technology. An app for your smartphone, a website, a kiosk, etc. are all ways that have changed how companies do business. There is also the expectation of consumers to have things instantly as well. Think of the ride sharing experience. A few taps, and a car has arrived. So with this change in the way we as consumers interact, businesses are realizing they need to change the way they deliver technology. Thus this “Digital Transformation” is driving the need to embrace a DevOps operating model.
Why are individuals interested in participating?
People want a better way to work. I think many realize that the way they’ve gone about IT in the past wasn’t ideal, and they are looking for something new and exciting. For many, their technology platforms have become stale, and they see DevOps as a way to experiment with new technologies and practices. For many, DevOps is that glass of water after being stranded in the desert.
What’s the primary advantage of DevOps?
It’s hard to boil it down to one thing. If I had to, I would say speed is a primary advantage. Speed in being able to experiment to find solutions, speed to quickly deliver technology to the consumer, and speed to respond to problems faster.
What is the overwhelming hurdle?
The overwhelming hurdle is that DevOps is a victim of it’s own success. Because this operating model is helping companies change, many vendors are getting into the DevOps space. This creates a bit of confusion as to what DevOps is, or isn’t, and often vendors shape DevOps to what they are trying to sell you. You also see this in the “fragmentation” of the DevOps space. Rugged DevOps, DevSecOps, Enterprise DevOps, and all these special branches of DevOps is just creating too much confusion in the market.
What advice would you give to people who want to get started in DevOps?
Start small and don’t get overwhelmed. Two principles of DevOps you’ll hear over and over is incremental change and continuous improvement. The DevOps space is so large these days that newcomers can easily get lost. Find a small area where you can make a change, learn from it, and iterate over those learnings to improve.
Learn more about DevOps from leaders in the field.
Read this Q&A with Kris Buytaert, one of the instigators of the current DevOps movement and organizer of DevOpsDays and Config Management Camp.
Read this Q&A with Patrick Debois, best known as the founder of DevOpsDays and as a creator of the DevOps movement, which explains why some refer to him as the “Godfather of DevOps.”
Cloud computing has paved the way for programmable infrastructure, which brought extreme automation into software development lifecycle. The ability to provision resources, configuring them on the fly, deploying applications, and monitoring the entire process led to the DevOps culture where developers and the operators are collaborating throughout the application lifecycle. While provisioning and configuration are best left to tools such as Chef, Puppet, and Ansible, one open source software that became the cornerstone of DevOps is Jenkins.
Software build, packaging, and deployment play a crucial role in release management. Enterprise developers often relied on tools such as Make, MS Build, Ant, Maven, and Gradle to compile and link source code.
Technology vendors are recognizing that by putting some technology into open source, they gain collaboration from other great minds to help the project mature more quickly.
Developers from different companies can collaborate on projects and develop solutions for the greater good of the entire community. That’s not something that happens in a competitive commercial software market.
Proponents argue that open source solutions can evolve more quickly because so many minds are working to improve them. Plus, more organizations have access to the software because the licenses are free.
The New Stack ran a survey that was able to target users of container management technology, with 70 percent of respondents using containers to some degree. We found that there is indeed uncertainty about what it means to manage and orchestrate containers. There is also a developing consensus that scheduling, cluster management and service discovery are necessary to orchestrate the use of containers in production.
Over 40 percent of respondents using or trialing containers said an orchestration platform was the primary way containers are managed in their organization. However, the actual products being used or planned for use were strongly influenced by a respondent’s stage of container adoption. People that have non-production use of containers were more likely to cite configuration management tools like Ansible andChef as a method of orchestration. Platforms-as-a-service (PaaS) solutions such as Red Hat OpenShift and Hashicorp products were cited more often in their roadmaps among those evaluating containers.
In the previous article on auditd, I showed how to use aureport to check stuff monitored by the auditddaemon. And, I showed how you could, for example, check whether a user had experienced trouble logging in, which could be interpreted as a malicious attempt to access a system.
As I said before, aureport is part of a larger toolset that comes with auditd. Using auditdto monitor some preset events is already quite useful, but where it comes into its own is when you customize it to monitor whatever you want.
Customized Monitoring Rules
To push your rules into auditd on the fly you use auditctl. But, before you insert any of your own rules, let’s check to see if any defaults are already in place. Become root (or use sudo) and try this:
auditctl -l-a never,task
The -l option lists all current active rules and, if you see the -a never,task line shown above, none of the rules following it will log anything. This rule, which is often a default in new auditd installations, is telling the daemon to append (-a) a rule to the task list (as in the list of tasks the kernel is running — don’t worry about this just yet), which will stop auditd from ever recording anything.
Because we’re not specifying which task, auditd assumes the rule applies to all of them. In plain English, this would read: “Never record anything from any of the tasks the kernel is running.” And, because auditd gives precedence from top to bottom (i.e., the first rule takes precedence over the ones following it in case of a conflict), this means nothing will be recorded despite what any of the other rules say.
You don’t want that, so the first thing to do is get rid of this rule. To delete all rules from a running auditd daemon, you can use:
auditctl -D
If you already have more than one rule and don’t want to zap them all, you can also selectively delete only this rule with
auditctl -d never,task
Now the coast is clear, so I’ll show how to build your own first rule. The typical use for auditd is to have it monitor files or directories. For example: As a regular user, create a directory in your /home directory, say…
mkdir test_dir
Now become root and set up a watch on the directory you just made:
The -w option tells auditd to watch the test_dir/ directory for any changes. The -k option tells auditd to append the stringtest_watch(called a key) to the log entries it creates. The key can be anything you want, although it is a good idea to make it something memorable and related to what the rule does. As you will see, this will be useful to filter out unrelated records when you revise auditd‘s logs later on.
Now, as a regular user, do some stuff in test_dir/ — make some subdirectories, create or copy some files, remove some files, or list the contents.
When you’re done, take a look at what auditd logged with
ausearch -k test_watch
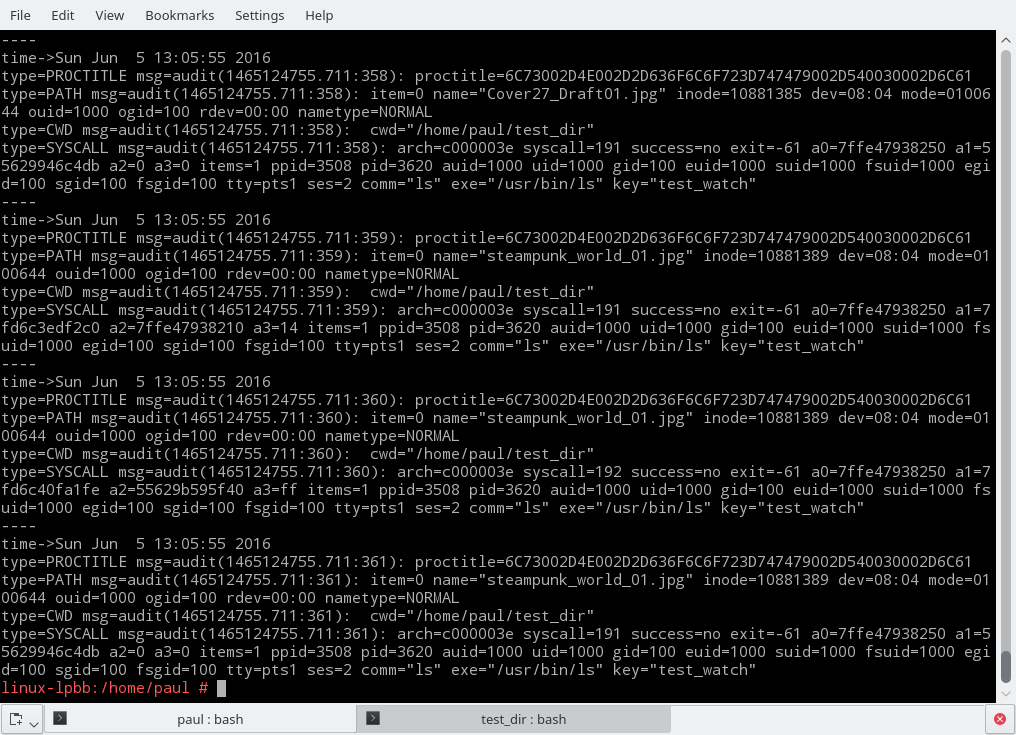
See the use of -k test_watch here? Even if you have a dozen more rules logging different things, by using a key string, you can tell ausearch to only list what you’re interested in (Figure 1).
Figure 1: Output of ausearch command.
Even with this filter, the amount of information ausearch throws at you is a bit overwhelming. However, you will also notice that the information is very structured. The output is actually made up of three records per event.
Each record contains some keyword/value pairs separated by a “=” sign; some of the values are strings, others are lists enclosed in parenthesis, and so on. You can read up on what each snippet of information means in the official manual, but the important thing to take away is that the structured nature of ausearch‘s output makes processing it using scripts relatively easy. In fact, aureport, the tool I showed in the previous article, does a very good job of sorting things out.
To prove it, let’s pipe our ausearch output through aureport and see what’s what:
ausearch -k test_watch | aureport -f -iFile Report =============================================== # date time file syscall success exe auid event =============================================== 1. 05/06/16 13:04:54 sub_dir mkdir yes /usr/bin/mkdir paul 193 2. 05/06/16 13:04:54 /home/paul/test_dir/sub_dir getxattr no /usr/bin/baloo_file paul 194 3. 05/06/16 13:04:54 /home/paul/test_dir/sub_dir getxattr no /usr/bin/baloo_file paul 195 4. 05/06/16 13:04:54 /home/paul/test_dir/sub_dir getxattr no /usr/bin/baloo_file paul 196 5. 05/06/16 13:05:06 /home/paul/test_dir/testfile.txt getxattr no /usr/bin/baloo_file paul 198 ...
This is starting to make sense! You can check who is doing what to which file and when.
One thing you can see in the listing above is that, because I am using the Plasma desktop, Baloo, KDE’s indexing service, is cluttering the list with irrelevant results. That’s because every time you create or destroy a file, Baloo has to come along and index the fact. This makes parsing what is going on and checking whether the user is up to no good, annoyingly hard. So, let’s filter Baloo’s actions out with a strategically placed grep:
ausearch -k test_watch | aureport -f -i | grep -v balooFile Report =============================================== # date time file syscall success exe auid event =============================================== 1. 05/06/16 13:04:54 sub_dir mkdir yes /usr/bin/mkdir paul 193 9. 05/06/16 13:05:06 testfile.txt open yes /usr/bin/touch paul 197 17. 05/06/16 13:05:29 ./be03316b71184fefba5cfbf59c21e6d5.jpg open yes /usr/bin/cp paul 210 18. 05/06/16 13:05:29 ./big_city.jpg open yes /usr/bin/cp paul 211
19. 05/06/16 13:05:29 ./blendertracking.jpg open yes /usr/bin/cp paul 212 20. 05/06/16 13:05:29 ./Cover27_Draft01.jpg open yes /usr/bin/cp paul 21337. 05/06/16 13:05:50 blendertracking.jpg unlinkat yes /usr/bin/rm paul 330 38. 05/06/16 13:05:50 be03316b71184fefba5cfbf59c21e6d5.jpg unlinkat yes /usr/bin/rm paul 328...
That’s much better. You can now clearly see what the users have been up to. You can follow how they create some directories and files and copy others from elsewhere. You can also check what files are being removed, and so on.
When you have no more use for it, you can remove the above watch with
Monitoring whole directories makes for a lot of logged data. Sometimes it is better to just monitor strategic individual files to make sure no one is tampering with them. A classic example is to use
auditctl -w /etc/passwd -p wa -k passwd_watch
to make sure nobody is messing with your passwd file.
The -p parameter tells auditd which permissions to monitor. The available permissions are:
r to monitor for read accesses to a file or a directory,
w to monitor for write accesses,
x to monitor for execute accesses,
and a to check for changes of the file’s or directory’s attributes.
Because there are legitimate reasons for an application to read from /etc/passwd, you’re not going to monitor for that to avoid false positives. It is also a bit silly to monitor for the execution of a non-executable file; hence, we tell auditd to only monitor for changes to passwd‘s content (i.e., writes) and its attributes.
If you don’t specify what permissions to monitor, auditd will assume it has to monitor all of them. That’s why, when you were monitoring the test_dir/ directory in the first examples, even a simple ls command triggered auditd.
Permanent Rules
To make your rules permanent, you can include them into /etc/audit/audit.rulesor create a new rules file in the /etc/audit/rules.d/directory. If you have been experimenting with rules using auditctl and you are happy with your current set up, you could do:
to dump your current rules into a rules file called my.rules and save yourself some typing. If you’ve been following this tutorial and used the example rules you saw above, my.rules would end up looking like this:
-D-w /home/[your_user]/test_dir/ -k test_watch-w /etc/passwd -p wa -k passwd_watch
To avoid interference and conflicts, move any pre-existing rules files in /etc/audit/ and /etc/audit/rules.dto backups:
Now, every time your system is rebooted, auditd will start monitoring whatever you told it to.
There’s More
I had time to cover only a small portion of auditd’s capabilities here. But, as you can see, auditd is very powerful, and it can be used monitor much more than just files and directories, with an insane level of detail. I plan to visit the more advanced topics in a future article.
In the beginning, Platform-as-a-Service (PaaS) was an easy to understand category of software, even if it wasn’t called Platform-as-a-Service initially. In its earliest incarnations, PaaS was a seamless if tightly constrained fabric which abstracted and made opaque the infrastructure running underneath it, from database to operating system. The promise to developers was, in strictly functional terms, serverless. No longer would developers have to concern themselves with operations minutiae like server instances. Instead, they deployed applications against a given platform and from there on out operations were, at least theoretically, the platform’s problem.
Since those first tentative releases in early 2007, PaaS has become more complicated to explain, both because the category itself has expanded its ambitions and because other, competitive layers of abstraction have emerged.
Henrik Austad of Cisco has published very early code for implementing a TSN core driver in the Linux kernel. TSN is short for Time Sensitive Networking and was formerly known as Audio/Video Bridging (AVB).
TSN is designed for establishing low-latency, jitter-free, guaranteed-bandwidth links over a LAN by reserving a path on the network. In order to support TSN, the NIC and the network itself must be compatible.
In the days leading up to DockerCon, it seems like storage is taking its turn at being the hot topic in containers, withCoreOS and EMC recently announcing container-storage projects.
Today, Portworx is up. The Redwood City, Calif.-based startup released a developer version of its container storage platform last year, and it’s now launching an enterprise version called PX-Enterprise.