The Linux terminal is a friendly, colorful place full of fast, lightweight and useful applications like dstat, Calcurse, Petris, and Siege.
One of my favorite Linux features is seamless switching between full-blown Xorg graphical desktop environments and the terminal. Sometimes I want to pointy-clicky, sometimes I want to type stuff. There are two types of terminal applications: plain text commands, for example top, ps, and ls, which are three popular commands, and ncurses-based applications. Ncurses is a slick graphical environment for the terminal with windows and menus. If you’ve ever used the text installer to install a Linux distribution, or used alsamixeror Midnight Commander file manager (mc), then you have used ncurses.
dstat System Monitor
dstat is yet another good application by the industrious Dag Wieers, who has given us the excellent and popular Dag RPM Repository for Fedora, CentOS and Red Hat, and a gaggle of nifty utilities you can read about here.
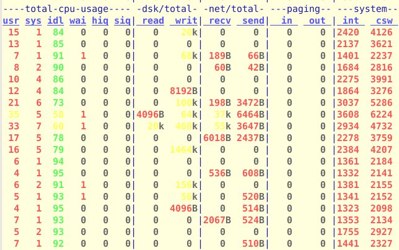
dstat is a “versatile resource statistics tool.” It replaces a host of individual utilities such as vmstat, iostat, netstat and ifstat. All displayed statistics are realtime and in the same timeframe, so you can see your desired stats side by side. It even supports CSV exports so you can make pretty graphs in Gnumeric or LibreOffice Calc. If you run dstat with no options (figure 1) it displays the options -cdngy by default, which are:
- cpu
- read-write disk stats
- network send and receive
- page stats in and out
- system interrupts and context switches

Ctrl+c stops it. Of course you may select whatever options you desire. You can monitor selected network interfaces:
$ dstat -nN eth0
--net/eth0-
 recv  send
 118B   66B
   0     0
  60B   42B
Memory usage:
$ dstat -m
------memory-usage-----
 used  buff  cach  free
2371M  373M  902M  308M
Enable time and date output:
$ dstat -t
----system----
     time
10-04 17:36:23
10-04 17:36:24
10-04 17:36:25
The fun part is stringing together your desired options in a single display, like this:
$ dstat -t --top-cpu --top-io  --top-latency
----system---- -most-expensive- ----most-expensive---- --highest-total--
     time     |  cpu process   |     i/o process      | latency process
10-04 17:44:08|X            2.5|xscreensave 192B 1491k|kworker/1:0  1297
10-04 17:44:09|plugin-contai2.0|plugin-cont8293B  101B|kworker/0:1  8271
10-04 17:44:10|plugin-contai1.7|xfce4-panel   0    53k|kworker/0:1  8008
10-04 17:44:11|plugin-contai2.3|firefox      28B   19k|plugin-contai 488
10-04 17:44:12|plugin-contai2.0|plugin-cont8294B  102B|kworker/0:1  8146
10-04 17:44:13|plugin-contai2.3|plugin-cont8297B  105B|kworker/0:1  8340
This shows, to no one’s surprise, that Web browsers and browser plugins are system resource hogs.
There is even an example plugin for learning how to write your own dstat plugins:
$ dstat --helloworld
plugin-title
  counter
Hello world!
Hello world!
Consult man dstat for a complete options list.
Calcurse Calendar, To-do, and Scheduling
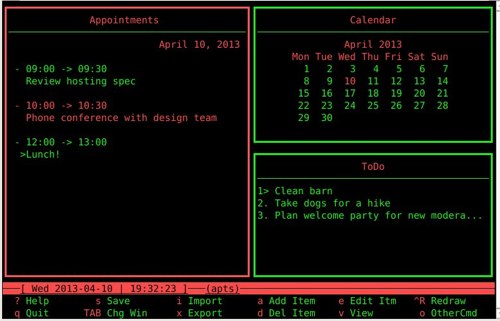
Calcurse is a nice ncurses-based calendar, to-do, and scheduling application. It opens with three panels: calendar, appointment list, and todo list. Hit the tab key to navigate between the three panels, and watch the border color to see which panel you’re in.

It has contextual help, so make sure you’re in the pane you want to be in, type ? for help, and then look at the very bottom pane to see what commands are available. This can take a little getting used to if you’re not familiar with ncurses applications, but it goes fast once you get the hang of it. For example, tab to the Appointments pane, press k to navigate up items in the pane, and j to go down. A selected item will be a different color. Type ? to open the help menu. Then in the bottom pane it says “a Add Item”, so type the letter a to learn how to add an appointment. Type q to quit the help menu.
Note the “o OtherCmd” option. This displays more commands, such as layout and color configuration, and additional navigation commands such as skip ahead or back a week, skip to today, and create/edit/delete a note. Notes are attached to appointments and to-dos, so first select the item you want to attach a note to, and then press n. Create your note, and an angle brace appears to indicate than an item has a note attached.
 There is more nice functionality explained in the contextual help, such as iCalendar import and export, and notifications. Also read the fine
 man calcurse page for additional options.
Petris
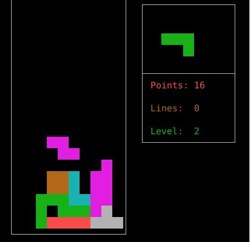
Yes, a game! All work and no play makes us dull, and console games don’t require high-end graphics and won’t crash your computer with buggy drivers. Petris is a simple Tetris clone with limited functionality: it doesn’t have a speed drop, and it only supports tracking high scores for a single player. It operates the same way as Tetris: pick your starting level, use the arrow keys to position the pieces as they fall, and then play until your fingers fall off.
Figure 3: Petris
Siege HTTP Load Tester
Siege is a nice and easy-to-use load tester for pummeling and benchmarking your Web applications and sites. Don’t use it on other people’s sites, unless you enjoy having angry Webmasters hunting you.
To start out, run siege.config to generate a configuration file in your home directory, ~/.siegerc. By default it logs to /var/siege.log, so if you run siege as an ordinary user it won’t be able to write to the default log file. I edit ~/.siegerc so that it logs to my homedir:
logfile = ${HOME}/.siege.log
This example is a simple benchmark test that sends 15 simulated concurrent users to pummel your site for 60 seconds:
$ siege -b -t60S  http://example.com
** SIEGE 2.70
** Preparing 15 concurrent users for battle.
The server is now under siege...
HTTP/1.1 200   0.38 secs:    6009 bytes ==> /
HTTP/1.1 200   0.42 secs:    6009 bytes ==> /
HTTP/1.1 200   0.42 secs:    6009 bytes ==> /
[...]
Lifting the server siege...      done.
Transactions:                   2131 hits
Availability:                 100.00 %
Elapsed time:                  59.18 secs
Data transferred:              12.21 MB
Response time:                  0.42 secs
Transaction rate:              36.01 trans/sec
Throughput:                     0.21 MB/sec
Concurrency:                   14.96
Successful transactions:        2131
Failed transactions:               0
Longest transaction:            0.78
Shortest transaction:           0.30
That is a good run: the server was always available, throughput was good, and transactions were quick. You can craft a more realistic test by creating a file of URLs of various pages on your site, one URL per line, and then try an incantation like this:
$ siege -c25 -d10 -i -f filename.txt
-c sets the number of simulated concurrent users, and -d sets the “sleep” interval for each user between requests. -d is a random interval up to the value you choose, so for a value of 10 the sleep intervals will range randomly from 0-10. -f specifies your URL file, and -i tells Siege to randomize the URLs. Which is all a pretty slick method for simulating real-world use.
You can learn interesting things about sites by pulling their headers:
$ siege -g http://example.com
GET / HTTP/1.1
Host: example.com
Accept: */*
Accept-Encoding: gzip
User-Agent: JoeDog/1.00 [en] (X11; I; Siege 2.70)
Connection: close
HTTP/1.1 200 OK
Date: Thu, 11 Apr 2013 03:46:22 GMT
Server: Apache
X-Powered-By: PHP/5.3.22
X-Drupal-Cache: HIT
Etag: "1365647258-1"
Content-Language: en
X-Generator: Drupal 7 (http://drupal.org)
Cache-Control: public, max-age=21600
Expires: Sun, 19 Nov 1978 05:00:00 GMT
Vary: Cookie,Accept-Encoding
Content-Encoding: gzip
Last-Modified: Thu, 11 Apr 2013 02:27:38 GMT
Connection: close
Transfer-Encoding: chunked
Content-Type: text/html; charset=utf-8
And you can test what happens when you send different user agents. The user agent is configured in ~/.siegerc. Just do a quick Web search to find various user agents to try, such as different Web browsers, and testing the various user agents for Web crawlers and search engine bots can be interesting. Read the fine man siege to learn more, and ~/.siegerc contains a lot of useful information.


