
Anytime a new language binding is introduced to syslog-ng, somebody immediately implements an Elasticsearch destination. There is one in Lua, Perl and Python, meaning that there is a very strong interest in getting data from syslog-ng into Elasticsearch. Recently, an official Elasticsearch destination has been developed by the syslog-ng team in Java.
Why do so many people want to send their logs to Elasticsearch? There are many reasons:
- it is an easy-to-scale and easy-to-search data store
- it is NoSQL: any number of name-value pairs can be stored (Hello PatternDB!)
- Kibana: an easy-to-use data explorer and visualization solution for Elasticsearch
And why to use syslog-ng on the sending side? There are also very good reasons for that:
- A single, high-performance and reliable log collector for all of your logs, no matter if they are coming from network devices, local system or applications. Therefore, it can greatly simplify your logging architecture.
- High speed data processor, parsing both structured (JSON, CSV/click stream) and unstructured log messages (PatternDB). It can also anonymize log messages if required by policies or regulations, and reformat them to be easily digested by analyzers.
- Complex filtering, to make sure that only important messages get through and they reach the right destination.
The next screenshot shows a Kibana dashboard, which displays logs collected by syslog-ng, parsed by PatternDB and stored into Elasticsearch by our brand new Java-based driver:
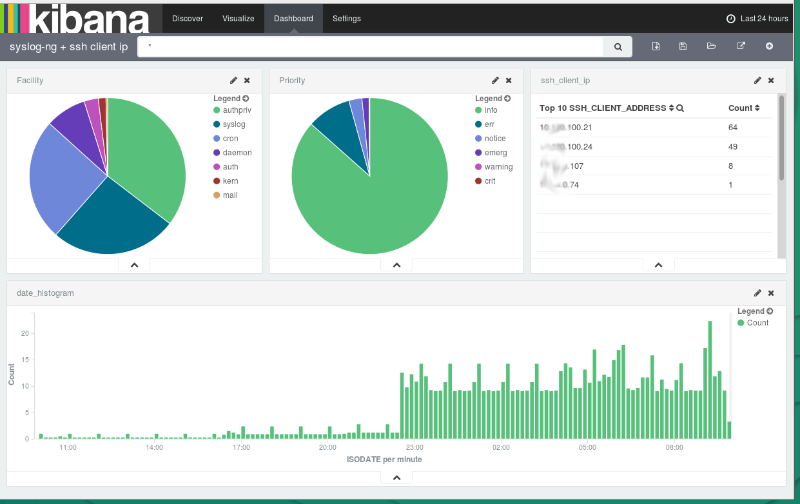
Read my blog at https://czanik.blogs.balabit.com/2015/10/how-to-parse-data-with-syslog-ng-store-in-elasticsearch-and-analyze-with-kibana/ to learn how to configure syslog-ng to parse logs and save them to Elasticsearch, and how to configure Kibana to be analyse those logs.


