 In this Linux training video, Linux Foundation training instructor Jan-Simon Möller takes you through how to set up and use debugging tool Ftrace to explore what’s happening inside the Linux Kernel.
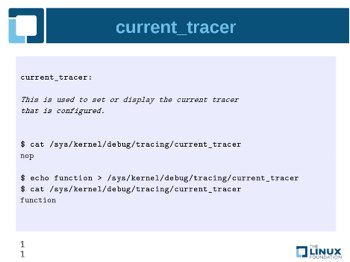
FTrace, or Function Tracer, allows kernel developers to record the function calls, latencies, and predefined events within the kernel and produce call graphs. Möller reviews configuration settings, the DebugFS interface, and files such as available_tracers, available_events, current_tracer, and more.
The full tutorial runs less than 9 minutes and is available on the Linux Foundation Training site. Registration is required.


