In the enterprise environment, there are certain tools that are a necessity for administrators. One such tool is the network monitor. In the close-source, proprietary world you will find plenty of tools to handle this task: Packettrap, GFI Max, Spiceworks. In the open source world – not so much. But there is one particular tool that does monitor networks and does an outstanding job of it. That tool? Nagios.
Nagios calls itself the “Industry standard in IT infrastructure monitoring.” It’s a bold statement, but anyone that has used Nagios, and used it correctly, they will happily agree with that statement. Why? Nagios is powerful, flexible, does exactly what you tell it, and will always work when others fail. Does that mean Nagios is perfect? Not necessarily. It does have a few caveats that will cause some network administrators to shy away from. But pound for pound, dollar for dollar, Nagios can’t be beat.
In this article I am going to show you how to install Nagios and configure hosts and hostsgroups for easy monitoring.
Features
Before we get into the thick of things, let’s take a peek at some of the features Nagios has to offer:
- Monitor network services (SMTP, POP3, HTTP, NNTP, Ping, and more)
- Monitor host resources
- Simple plugin design
- Parallelized service checks
- Network host hierarchy
- Alerts
- Custom event handlers
- Automated log file rotation
- Redundant monitoring hosts
- Easy to read web-based interface
And much more.
Installation
To illustrate how simple Nagios is to install, I am going to demonstrate using Ubuntu (10.4 to be precise). You will need to have the Apache web browser installed in order to use Nagios. If you do not already have it installed, the installation of Nagios will pick this requisite up. With the help of the Synaptic package manager, you can have Nagios installed in about a minute, if you follow these steps:
- Open up Synaptic.
- Search for “nagios” (no quotes).
- Mark nagios, nagios-plugins, and nagios-plugins-extra for installation (which will catch all dependencies necessary).
- Click Apply to install.
- During the installation you will be asked for an administrative password. You will use this to log in with user nagiosadmin
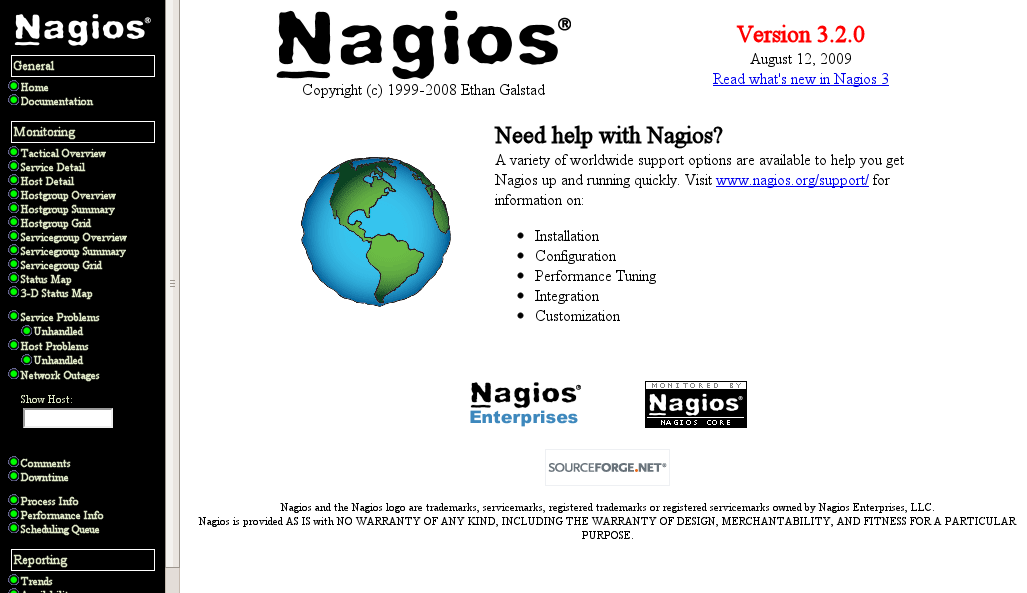
 That’s it! Once this is done you are ready to take a look at a very bare-bones Nagios installation. To do this open up your browser and point it to http://ADDRESS_TO_SERVER/nagios3. When you hit that page you will see a welcome screen (see Figure 1) and a left navigation that will include all of the links you need to monitor your network. Problem is, by default, Nagios will only see two hosts: localhost host and default gateway. What good is that on a large network? It’s not. You need to add some hosts before Nagios is really useful.
Initial Configuration
There isn’t too much system configuration that needs to be done with Nagios. If you open up the /etc/nagios3/conf.d/contacts_nagios2.cfg file you will see you can set up an administrator for which alerts are sent. The line you want to edit is:
email admin@localhost
Change this to reflect the email address necessary. You will have to make sure that mail can be sent out on this server before this will work (beyond the scope of this article).
Adding Hosts
This is one of those caveats I mentioned earlier. Nagios does not have any means of auto-discovery. Instead you have to manually enter hosts for monitoring. And by “manually” I do mean create configuration files for each host. This is generally fine, because you are not going to be monitoring every desktop and device on your network. What you will want to monitor is servers and other network devices. So let’s take a look at adding a server for Nagios to monitor.
In the directory /etc/nagios3/conf.d/ you will find sample files with which you can build your network from. A basic host file for Nagios is fairly simple to create. The file contains host definitions and directives that dictate to Nagios what exactly to monitor. let’s take a look at a typical host definition file:
define host{
host_name Elive
alias Elive Desktop
address 192.168.1.10
check_command check-host-alive
max_check_attempts 5
check_period 24×7
process_perf_data 0
retain_nonstatus_information 0
notification_interval 30
notification_period 24×7
notification_options d,u,r
}
define service{
use generic-service
host_name Elive
service_description Disk Space
check_command check_all_disks!20%!10%
}
define service{
use generic-service
active_checks_enabled 1
passive_checks_enabled 1
parallelize_check 1
obsess_over_service 1
check_freshness 1
notifications_enabled 1
event_handler_enabled 1
flap_detection_enabled 1
process_perf_data 1
retain_status_information 1
retain_nonstatus_information 1
register 0
}
This particular file defines all parameters for a device named Elive (named so, because of the Linux Distribution it uses). This is a desktop machine, but the above configuration could be used for just about any desktop or server. To make things easy on yourself you can copy the above file for all of the servers you need to monitor. You will want to edit the hostname, alias, and address according to each machine and give each file a name specific to the machine (say mailserver.cfg, webserver.cfg, etc).
Naturally you will notice the above file is missing critical services such as HTTP. A good template for an HTTP server would add the following service directives:
define service {
use generic-service
hostgroup_name http-servers
service_description HTTP
is_volatile 0
check_period 24×7
max_check_attempts 3
normal_check_interval 3
retry_check_interval 1
contact_groups admins
notification_interval 30
notification_period 24×7
notification_options w,u,c,r
check_command check_http
}
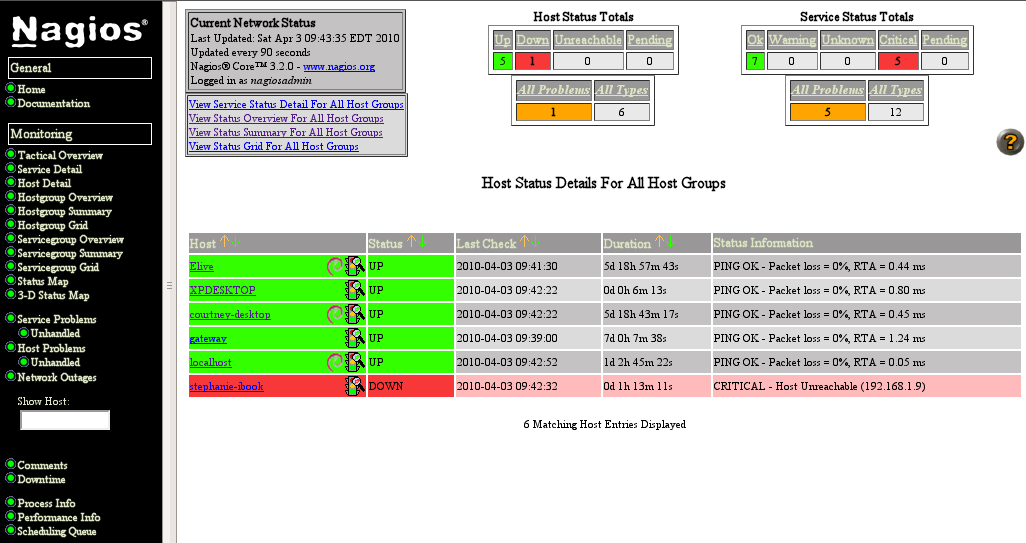
 Now that you’ve added some hosts, restart Nagios and refresh the web page. If you click on the Host Detail link you should see something like you see in Figure 2. As you can see, one host is down.
If you click on a host you will get the full detail on the machine – including the host state information, enabled checks, and plenty more.
Host Groups
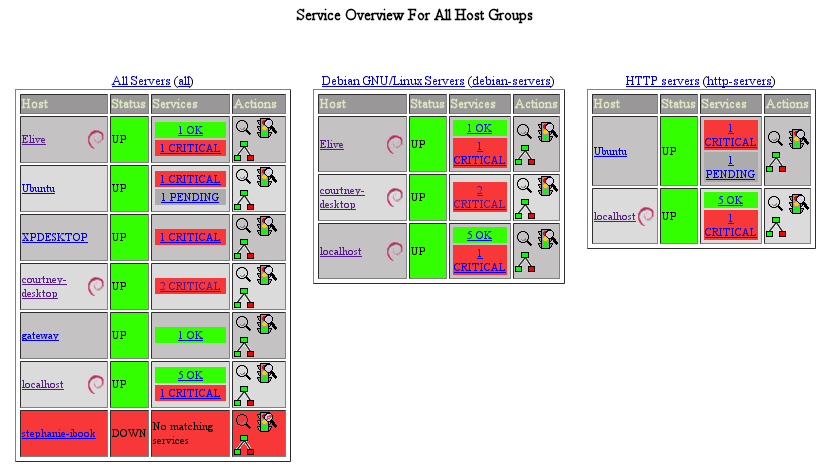
If you have multiple servers on your network, and some of theses servers belong to a specific group (say HTTP or MAIL), you can make it easy on yourself by grouping them together. This will allow you to quickly check their status all together in the Nagios Hostgroup Overview. But you have to add these machines to a hostgroup first. To do this open up the file /etc/nagios3/conf.d/hostgroups_nagios2.cfg. In this file you can define each hostgroup like so:
# A list of your web servers
define hostgroup {
hostgroup_name http-servers
alias HTTP servers
members localhost, Ubuntu
}
 Notice that your members use the hostname from their .cfg file hostname directive. Once you add new members to a hostgroup you will need to restart Nagios with the command sudo /etc/initi.d/nagios3 restart. Now you should see your devices grouped together like you see in Figure 3.
Nagios is now coming to life for you as a serious enterprise-ready network monitoring solution.
Final Thoughts
Nagios can do quite a lot. In upcoming articles we will stretch and push this tool into even more areas, making it even more useful for the network administrator. But already you should have a tool that is perfectly capable of monitoring your enterprise-level network.


