Network administrators have many tasks, and auditing the network is at the top of the heap. This isn’t a problem if you have a small network. But what happens when that network outgrows your ability to simply walk around and manually make note of what is up/down, what OS a device is running, or what ports are open? When this happens you need to make use of one of the de facto standard open source network auditing tools — Zenmap.
The Zenmap tool is actually a graphical front end for the very popular Nmap command line tool. Nmap is an open source tool for network security and auditing. Although Nmap is incredibly powerful, when working with larger networks most administrators do not want to work with command line only tools. And besides, as they say “A picture is worth a thousand words”. In this case that is very much true because Zenmap will give you an interactive graphical map of your network.
Installation
Installation of Zenmap is simple (you will need to also have Nmap installed). You will find both of these tools in your Add/Remove Software tool. Just mark Zenmap for installation and your package manager will pick up the Nmap requirement automatically.
Once installed you will find the tool in Applications > Network. There is a catch with the startup of Zenmap. Because Nmap requires some administrative access to use certain functionalities, you will want to launch Zenmap from the command line like so:
sudo zenmap
Or by first su‘ing to the root user (type su and then type the root user password). When the graphical window opens you are ready to start your audit.
Usage
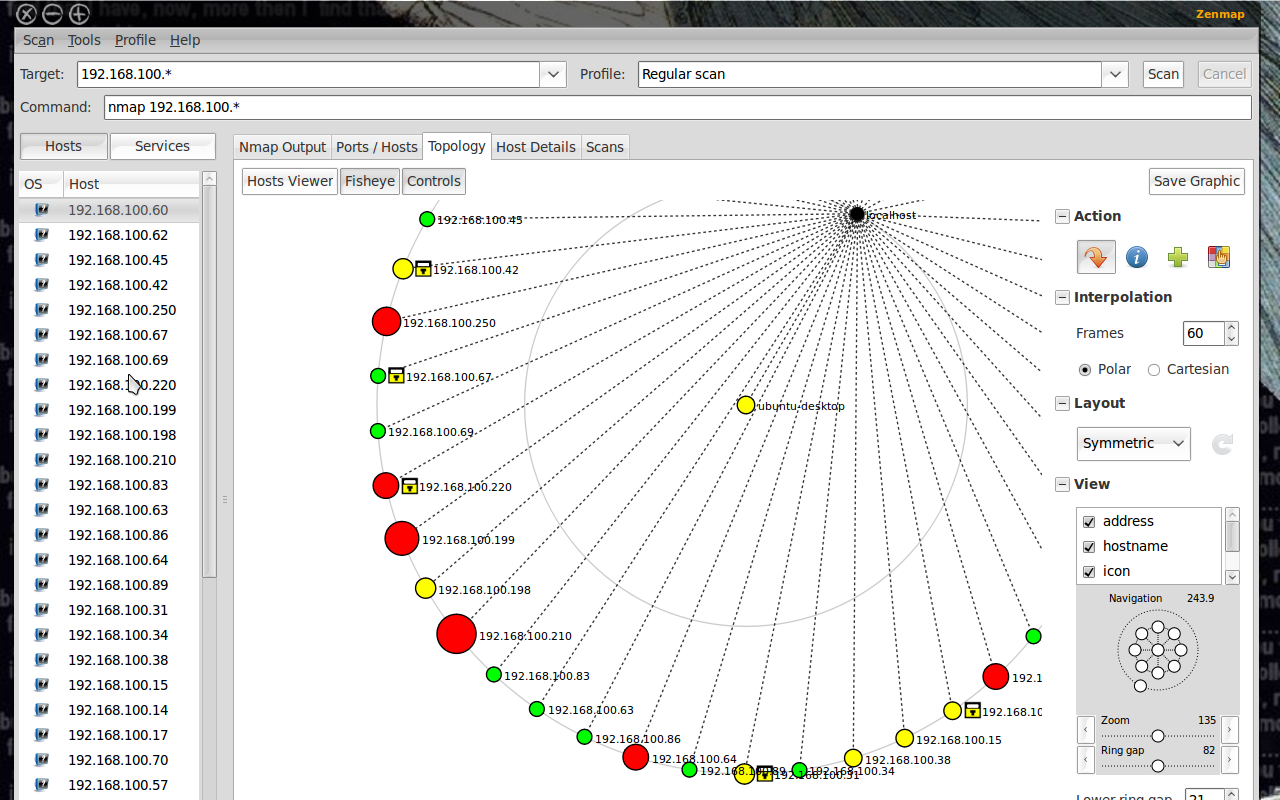
 When the Zenmap window opens (see Figure 1) you will see a fairly straight-forward user interface. Let’s take a look at what is necessary to start an audit of your network.
The first thing you will need is a target. Let’s say, for example, you want to audit a network that is on the 192.168.100.1 IP address scheme. If you want to scan your entire network you could enter 192.168.1.* in the Target section. That will scan every possible address on that network.
The next step is to select a profile. The Profile drop down is filled with pre-configured scan types that range from simple ping scans to intense scans. I will warn you — I have seen intense scans cripple smaller network hardware. If you are dealing with consumer-grade hardware (switches and routers), intense scans can completely bottleneck your network.
When you select the profile you want you will notice the Command section changes to reflect your choices. You could also enter this same command at a bash prompt and get results!
After your profile is selected click the Scan button and the scan will begin. What happens then is all discovered addresses will begin filling up the left pane and the output of the scan will fill up the right pane. Note: Let the scan complete before you click on a different tab or you run the risk of canceling your scan.
 You will also notice there are other tabs in the right pane. Each of these tabs serves a very distinct purpose:
Nmap Output: This is the default tab and shows the output of the command.
Ports/Hosts: This tab shows you what ports are open on what hosts.
Topology: This tab is a must-use for audits as it shows the actual topology of your network. As you can see (in Figure 2) they layout of your network will be displayed in graphical form.
Host details: This tab will give you specific information about a selected host. To select a host you simply select the desired target from the left pane where all of the IP addresses or host names are listed.
Scans: This tab lists all of the scans you have executed. Most of these will be unsaved scans. You can, of course, select one of your past scans and re-run it by selecting said scan and clicking the Scan button.
Topology
As I mentioned, the Topology tab is going to be one of the more important tools in your audit. When you click on this tab you will see, depending upon the size of your network, a blob of red circles and IP addresses. If your network is large enough this blob will, at first, be worthless. What you have to do is use the Zoom and Ring Gap sliders to zoom in on your network and enlarge the ring gap. By enlarging these numbers the devices on the topology map will expand and the details will begin to show.
As for what type of details you see, you can add/remove various details by expanding the View section (click the “+” sign next to View) and check the details you wish to see. The details available are:
- Address
- Hostname
- Icon
- Latency
- Ring
- Region
- Slow In/Out
Of course you can get a much deeper look at a particular host in the Details tab. But for the overall look at your network, this is ideal.
 As I mentioned earlier, this map is interactive. What you can do (other than add/remove details and zoom in and out) is select a particular host and make it the focal point of your map. You can also select a point in the Navigation section and move the map around.
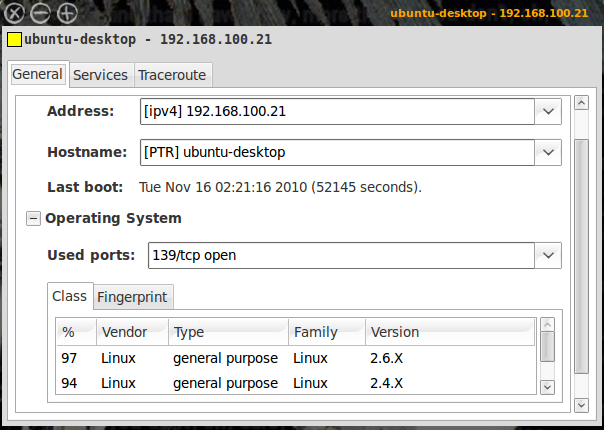
This is very handy when you have a large network and need to focus on one particular section of the network. To get even more details about a particular host, from the topology map, right click the host and a new window will appear (see Figure 3). In this window you will get information according to what you have scanned. In Figure 3 you can see I included OS information in the scan. In order to do that you actually have to edit the scan profile.
Scan Profiles
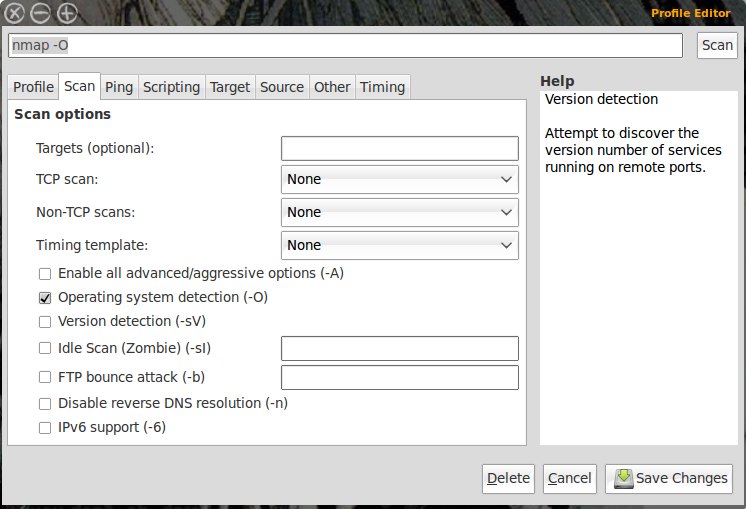
 As mentioned, you can use the default scanning profiles, or you can create your own. To do this click Profile and then select either New Profile or Command or Edit Current Profile. If you only want to make a minor change you can select a specific profile and then edit that profile. In my scan above I added Operating System information. To do that select a scan profile and then click Profile > Edit Current Profile. In this new window (see Figure 4) click on the Scan tab and then check the OS option and then click Save Changes to finish up.
If you make a change to a profile you will need to re-run the scan to get the desired results.
Final Thoughts
Zenmap is a very powerful tool that enables any network administrator to audit any size network. It’s a great tool, easy to use, and it’s open source! Make sure to dig in deep with the profile editor so you can create helpful scans for your specific network and you will see just how powerful Zenmap can be.


