Many people today work on mixed networks, with both Linux and Windows systems playing important roles. Sharing files between the two can be critical at times and is surprisingly easy with the right tools. With fairly little effort, you can copy files from Windows to Linux or Linux to Windows. In this post, we’ll look at what is needed to configure your Linux and Windows system to allow you to easily move files from one OS to the other.
Copying files between Linux and Windows
The first step toward moving files between Windows and Linux is to download and install a tool such as PuTTY’s pscp. You can get PuTTY from putty.org and set it up on your Windows system easily.
Another day, another Crostini feature comes to light. So far, we have the Linux Terminal installer,Files app integration, and Material Design cues already rounding out the Linux app experience. As we continue to uncover clues by the day, it seems development of the Crostini Project is full steam ahead today is no different. Each clue we uncover continues to push the entire experience closer to something I believe will be delivered to developers and general users alike.
There are multiple commits around this same theme: handling app icons for Linux apps on your Chromebook.
How do you ensure data is properly backed up and recoverable according to current policies on a Kubernetes cluster?
Traditional agent-based backup software won’t work natively with a container orchestrator such as Kubernetes. A Persistent Volume (PV) may be attached to any host at any given time in the cluster. Having a backup agent hogging the mount path on the host will lead to unpredictable behavior and most certainly failed backups. Applying the traditional backup paradigm to the containerized application paradigm will simply not work. Backup schemes need to be consumed as a data service provided by the cluster orchestrator and the underlying storage infrastructure. In this blog you’ll learn how HPE Nimble Storage provide these data protection services for Kubernetes and how cluster administrators, traditional storage architects and application owners that are part of a DevOps team may design and consume these data protection services.
Before we dig in, the very loaded word “Backup” needs to be defined with a touch of the 21st century. I’m using the define: operator on Google search to help me…
This week in Linux and open source headlines, Mark Hinkle of Node.js Foundation shares what he’s excited for in regards to the platform this year and more. Read on and stay open-source-informed!
“Executive Director of the Node.js Foundation, Mark Hinkle provides commentary on the growth of Node.js in general, how the Node.js Foundation works with the community and what he is most excited about this year with Node.js.”
“The interesting part [about] blockchain [is that] a combination of capabilities in computing, connectivity and cryptography, has applications not only in the financial world but in any transactional environment.”
“Coming full circle, Chrome OS could soon run Linux software somewhat directly, opening the OS and Chromebooks to use cases beyond education or enterprise.”
Once upon a time the idea of upgrading the Linux kernel sent fear through the hearts of many a user. Back then, the process of upgrading the kernel involved a lot of steps and even more time. Now, installing a new kernel can be easily handled with package managers like apt. With the addition of certain repositories, you can even easily install experimental or specific kernels (such as real-time kernels for audio production) without breaking a sweat.
Considering how easy it is to upgrade your kernel, why would you bother compiling one yourself? Here are a few possible reasons:
You simply want to know how it’s done.
You need to enable or disable specific options into a kernel that simply aren’t available via the standard options.
You want to enable hardware support that might not be found in the standard kernel.
You’re using a distribution that requires you compile the kernel.
You’re a student and this is an assignment.
Regardless of why, knowing how to compile a Linux kernel is very useful and can even be seen as a right of passage. When I first compiled a new Linux kernel (a long, long time ago) and managed to boot from said kernel, I felt a certain thrill coursing through my system (which was quickly crushed the next time I attempted and failed). With that said, let’s walk through the process of compiling a Linux kernel. I’ll be demonstrating on Ubuntu 16.04 Server. After running through a standard sudo apt upgrade, the installed kernel is 4.4.0-121. I want to upgrade to kernel 4.17. Let’s take care of that.
A word of warning: I highly recommend you practice this procedure on a virtual machine. By working with a VM, you can always create a snapshot and back out of any problems with ease. DO NOT upgrade the kernel this way on a production machine… not until you know what you’re doing.
Downloading the kernel
The first thing to do is download the kernel source file. This can be done by finding the URL of the kernel you want to download (from Kernel.org). Once you have the URL, download the source file with the following command (I’ll demonstrate with kernel 4.17 RC2):
Do note: You will need at least 12GB of free space on your local drive to get through the kernel compilation process. So make sure you have enough space.
Extracting the source
From within the directory housing our newly downloaded kernel, extract the kernel source with the command:
tar xvzf linux-4.17-rc2.tar.gz
Change into the newly created directory with the command cd linux-4.17-rc2.
Configuring the kernel
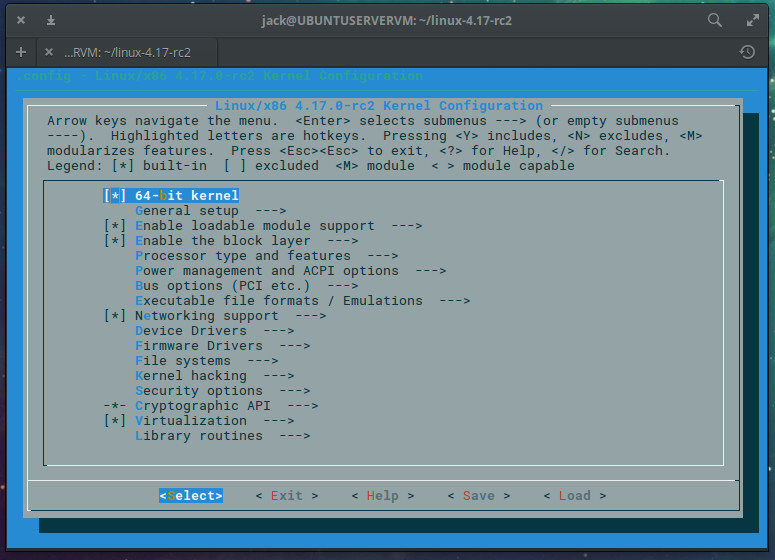
Before we actually compile the kernel, we must first configure which modules to include. There is actually a really easy way to do this. With a single command, you can copy the current kernel’s config file and then use the tried and true menuconfig command to make any necessary changes. To do this, issue the command:
cp /boot/config-$(uname -r) .config
Now that you have a configuration file, issue the command make menuconfig. This command will open up a configuration tool (Figure 1) that allows you to go through every module available and enable or disable what you need or don’t need.
Figure 1: The make menuconfig in action.
It is quite possible you might disable a critical portion of the kernel, so step through menuconfig with care. If you’re not sure about an option, leave it alone. Or, better yet, stick with the configuration we just copied from the running kernel (as we know it works). Once you’ve gone through the entire list (it’s quite long), you’re ready to compile!
Compiling and installing
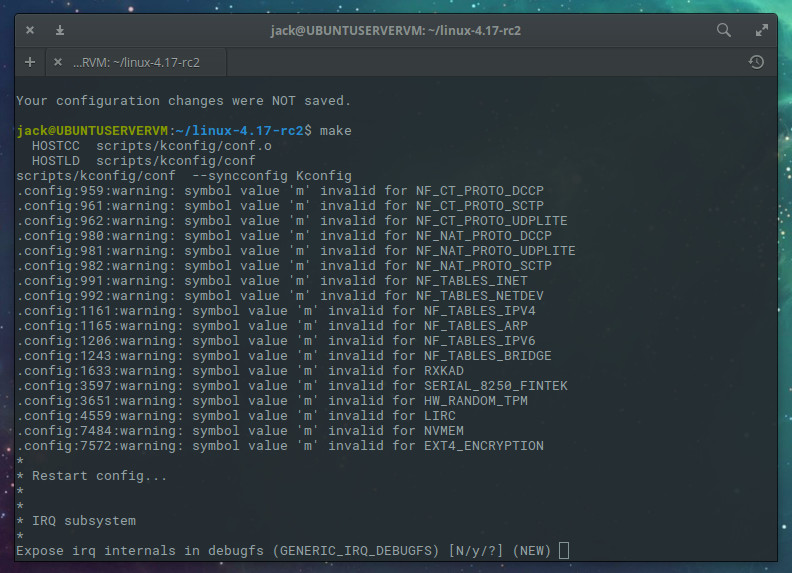
Now it’s time to actually compile the kernel. The first step is to compile using the make command. So issue make and then answer the necessary questions (Figure 2). The questions asked will be determined by what kernel you’re upgrading from and what kernel you’re upgrading to. Trust me when I say there’s a ton of questions to answer, so give yourself plenty of time here.
Figure 2: Answering the questions for the make command.
After answering the litany of questions, you can then install the modules you’ve enabled with the command:
make modules_install
Once again, this command will take some time, so either sit back and watch the output, or go do something else (as it will not require your input). Chances are, you’ll want to undertake another task (unless you really enjoy watching output fly by in a terminal).
Now we install the kernel with the command:
sudo make install
Again, another command that’s going to take a significant amount of time. In fact, the make install command will take even longer than the make modules_install command. Go have lunch, configure a router, install Linux on a few servers, or take a nap.
Enable the kernel for boot
Once the make install command completes, it’s time to enable the kernel for boot. To do this, issue the command:
sudo update-initramfs -c -k 4.17-rc2
Of course, you would substitute the kernel number above for the kernel you’ve compiled. When that command completes, update grub with the command:
sudo update-grub
You should now be able to restart your system and select the newly installed kernel.
Congratulations!
You’ve compiled a Linux kernel! It’s a process that may take some time; but, in the end, you’ll have a custom kernel for your Linux distribution, as well as an important skill that many Linux admins tend to overlook.
Learn more about Linux through the free “Introduction to Linux” course from The Linux Foundation and edX.
Conventional wisdom says you can’t run a database in a container because “Containers are stateless!” or “Databases are pointless without state!” However, this is not true any longer. We’ve been missing the right technology to support database running in a container.
Then came Kubernetes 1.5, which includes the new StatefulSet API object (in older versions, StatefulSet was known as PetSet). With StatefulSets, Kubernetes makes it easier to run stateful workloads such as Couchbase Server, a NoSQL database.
Stateful Containers
Kubernetes StatefulSets gives you a set of resources to deal with stateful containers, such as: volumes, stable network ids, ordinal indexes from 0 to N, etc. Volumes are one of the key features that allow us to run stateful applications on top of Kubernetes; let’s see the two main types currently supported:
Ephemeral storages volumes
The behavior of ephemeral storages is different than what you are used to in Docker. In Kubernetes, the volume outlives any containers that run within the Pod, and the data is preserved across container restarts. But if the Pod getskilled, the volume is automatically removed.
Persistent storage volumes
In a persistent storage, as the name suggests, the data lifetime is independent of the Pod’s lifetime. So, even when the Pod dies or is moved to another node, that data will still persist until it is explicitly deleted by the user. In those kinds of volumes, the data is typically stored remotely.
We are looking forward for Kubernetes to support Local Persistent Storages as it will definitely be the best fit for running databases, but in the meantime, we use ephemeral storages by default for Couchbase Server. At this point, you might wonder why we are using ephemeral storages instead of the persistent ones. Not surprisingly, there are many reasons for that:
Ephemeral storages are faster and cheaper than persistent; it would require more infrastructure/networking to use persistent storages as you need to send the data back and forth
K8s 1.9 introduced Raw Block Support, which allows you to access physical disks in your VM instance to use it in your application
Maintain networked storage systems is not trivial
You can always try to reboot the container first instead of killing the whole Pod: Ex (kubectl exec POD_NAME -c CONTAINER_NAME reboot)
You can configure the database to automatically replicate your data, so even if N Pods dies, no data will be lost
Part of K8s job is to run Pods in different racks to avoid massive failures
However, there are a few scenarios where using Remote Persistent Storages would be worth the extra latency cost, like in massive databases for instance, when the rebalancing process takes several minutes to finish. That is why we also will add support for Remote Persistent Storages for Couchbase Server.
One of the downsides of Statefulsets is the limited management. This is why we decided to extend the Kubernetes API through the use of a Custom Resource Definition (CRD), which allows us to create a custom native resource in Kubernetes similar to a StatefulSet or a Deployment, but designed specifically for managing Couchbase instances.
Great! So, with StatefulSets/CRDs we have all the hardware operations arranged, but there is just a “small” thing missing here: what about the state of the application itself? In a database, for instance, adding a new node to the cluster is not nearly enough. You would still be required to trigger some processes, such as rebalancing to move/replicate some of the data to the newly added node to make it fully operational. That is exactly why K8s Operators joined the game.
Kubernetes Operators
Kubernetes 1.7 has added an important feature called Custom Controllers. In summary, it enables developers to extend and add new functionalities, replace existing ones (like replacing kube-proxy for instance), and of course, automate administration tasks as if they were a native Kubernetes component.
An Operator is nothing more than a set of application-specific custom controllers. So, why is it a game changer? Well, controllers have direct access to Kubernetes API, which means they can monitor the cluster, change pods/services, scale up/down, and call endpoints of the running applications, all according to custom rules written inside those controllers.
To illustrate this behavior, let’s see how Couchbase’s Operator works when a Pod gets killed:
As you can see in the figure above, the Operator monitors and analyzes the cluster, and based on a set of parameters, trigger a series of actions to achieve a desired state. This reconciliation process is all over the place in K8s. But not all actions are equal; in our example, we have two distinct categories:
Infrastructure – add a new node to the cluster: The operator requests via Kubernetes API to launch a new Pod running Couchbase Server.
Domain Specific – add node to cluster/ trigger data rebalancing:The operator knows how Couchbase works and calls the correct rest endpoint to add the new node to the cluster and trigger data rebalancing.
That is the real power of Operators: they allow you to write an application to fully manage another, and guess which kind stateful applications are the hardest to manage? You are right: Databases.
Developers have always expected databases to work out-of-the-box, when in fact, they historically are exactly the opposite. We even have a specific name for the person responsible for taking care of the database: our beloved DBAs.
Couchbase’s Operator was created as an effort change this scenario and make databases easy to manage without locking you to a specific cloud vendor. Currently, it supports automated cluster provisioning, elastic scalability, auto recovery, logging and access to the web console, but many more features are coming in the future. If you want to read more about it, please check out this article or refer to Couchbase’s official documentation here.
I also have to mention that It is the very first official operator launched for a database, although there are already some small community projects trying to build operators for MySQL, Postgres and other databases.
The Operator’s ecosystem is growing quickly; rook for example, lets you deploy something very similar to AWS S3. The Apache Kafka operator is coming soon, and with so many other initiatives out there, we expect a major boost in the number of operators in the upcoming months now that all major cloud providers supports K8s.
Finally, Kubernetes provides a cloud-agnostic application deployment and management. It is so powerful that it might lead us to treat cloud providers almost like a commodity, as you will be able to migrate freely between them.
In the future, choosing a cloud provider could be just a matter of which one offers the best performance/cost.
Anil Kumar
As Director of Product Management at Couchbase, Anil Kumar is responsible for product strategy, development, and delivery of Couchbase Data Platform offerings. Prior to joining Couchbase, Anil spent several years working at Microsoft in the Entertainment division and most recently in the Windows and Windows Live division.
For similar topics on Kubernetes, consider attending KubeCon + CloudNativeCon EU, May 2-4, 2018 in Copenhagen, Denmark.
Everyone uses %CPU to measure performance, but everyone is wrong, says Netflix’s Brendan Gregg in his UpSCALE Lightning Talk.
CPU utilization is the metric everyone uses to measure a processor’s performance. But %CPU is a misleading measure of how busy your processor really is, says Brendan Gregg, senior performance architect at Netflix, in what he calls a “five-minute public service announcement,” at the 16th annual Southern California Linux Expo (SCALE).
Watch Brendan’s talk to learn how you can use Netflix’s methods to determine what your CPUs are really doing to impact performance.
There’s a nifty feature that comes with VirtualBox that allows you to create a desktop shortcut for virtual machines. This, however, doesn’t do you much good if you’re running VirtualBox on a GUI-less server. If that’s the case, you don’t always want to have to issue the command to start a VM every time it’s needed. To that end, what do you do? If you’re using Linux to host VirtualBox VMs, it’s really quite simple—you create bash scripts to manage the starting, stopping, and resuming of those virtual machines.
I’m going to show you how to do just that. I’ll assume you already have VirtualBox installed along with all the virtual machines you need. With that said, let’s see how this is done.
As part of preparing my last two talks at LCA on the kernel community, “Burning Down the Castle”and “Maintainers Don’t Scale”, I have looked into how the Kernel’s maintainer structure can be measured. One very interesting approach is looking at the pull request flows, for example done in the LWN article “How 4.4’s patches got to the mainline”. Note that in the linux kernel process, pull requests are only used to submit development from entire subsystems, not individual contributions. What I’m trying to work out here isn’t so much the overall patch flow, but focusing on how maintainers work, and how that’s different in different subsystems.
Methodology
In my presentations I claimed that the kernel community is suffering from too steep hierarchies. And worse, the people in power don’t bother to apply the same rules to themselves as anyone else, especially around purported quality enforcement tools like code reviews.
For our purposes a contributor is someone who submits a patch to a mailing list, but needs a maintainer to apply it for them, to get the patch merged. A maintainer on the other hand can directly apply a patch to a subsystem tree, and will then send pull requests up the maintainer hierarchy until the patch lands in Linus’ tree. This is relatively easy to measure accurately in git: If the recorded patch author and committer match, it’s a maintainer self-commit, if they don’t match it’s a contributor commit.
As we move forward, it’s becoming increasingly clear (to me at least) that the future will be containerized and those containers will run on serverless infrastructure.
In this context, then, the obvious question is: “What becomes of orchestration in this serverless future?”
Kubernetes is a technology developed to provide a serverless-experience of running containers. But the truth is that at the low level, the Kubernetes architecture itself is deeply aware individual machines, and components from the scheduler to the controller manager assume that the containers in Kubernetes are living on machines that are visible to Kubernetes….
For these serverless platforms, it might have been tempting to develop an entirely new orchestrator, but the truth is that the world is consolidating around the Kubernetes orchestration API, and the value of seamless integration with existing Kubernetes tooling is very attractive.