Home Blog Page 411

What is Software Defined Storage?

The concept of “software defined storage” (SDS) seems to be everywhere, if you read about the data storage industry or explore storage products.  However, the software defined storage definition remains a little vague – or perhaps more than a little vague.

Most people seem to agree that at first, SDS was little more than a marketing buzzword. It first came into vogue after the OpenFlow project introduced the idea of software defined networking (SDN) around 2011. As vendors like VMware began to embrace the idea of the software defined data center (SDDC), storage vendors saw an opportunity to gain traction for their products with the “software defined storage” label.

But while SDS may have originated as basically a marketing gimmick, the technology that underlies it truly is different than traditional storage hardware. 

Read more at Enterprise Storage Forum

How the Public Cloud Drives Emerging Technologies

Cloud computing is, to be sure, today’s leading driver of emerging tech.The next big battles among the public cloud vendors will center around emerging technologies like artificial intelligence, the Internet of Thingsvirtual reality and blockchain.

By now, most enterprise leaders understand the value of cloud computing. They have experimented with software as a service (SaaS)infrastructure as a service (IaaS) and platform as a service (PaaS), and now they are looking to expand their use of the cloud. Synergy Research recently found that the public cloud market is growing 40 percent per year. And IDC has predicted that by 2020, 67 percent of IT infrastructure and software will be based in the cloud.

But as organizations expand their use of the public cloud, they are asking for more than just the traditional SaaS, IaaS and PaaS offerings.

Read more at Datamation

Windows Subsystem for Linux: A Bridge Between Two Platforms

Windows 10 accounts for roughly 42 percent of market share, according to the latest figures from StatCounter. It’s also the the most commonly used platform by developers, followed by Linux. That’s a huge market.

On the other side of the spectrum are data centers, servers, private and public clouds. These are dominated by Linux. In fact, more than 50 percent of Microsoft Azure machines run Linux. Windows dominates the developer system market, and Linux dominates the cloud and datacenter. Two different worlds. And, imagine the life of a developer who uses Windows 10 machines to manage their Linux workloads on cloud.

In the past these developers, especially web developers, who worked on servers running Linux had a few choices: run a Linux distro inside a VM on their Windows 10 machines or use workarounds like Cygwin. Both solutions had limitations and neither was ideal. Additionally, they caused additional headaches for the IT teams who manage developer systems across organizations.

Microsoft needed a native solution and turned to Linux vendor Canonical to build Linux command-line capability in Windows 10. In 2016, Microsoft announced a beta project called Bash on Windows that aimed at bringing Ubuntu Bash to Windows. The project enabled developers to run many Linux command-line tools in Windows. By the end of 2017, the project was out of beta and was renamed to Windows Subsystem for Linux (WSL).

Tara Raj of Microsoft explained the reason of this name change and said that WSL referred to “the Microsoft-side of the technology stack, including the kernel and Windows tools that enable Linux binaries to run on Windows. The distros will simply be known by their own names – Ubuntu, openSUSE, SUSE Linux Enterprise Server, etc.”

With the arrival of Windows 10 Fall Creators Update (FCU), Microsoft introduced Linux command-line tools and utilities to the mass market. Anyone running Windows 10 can now enable WSL on their systems.

“I think it will actually increase the reach of Linux as now those users who would have never installed Linux will be able to use these tools. Windows has a much larger market share than Linux and these users will now have access to Linux tools,” said openSUSE Board Chairman Richard Brown in an interview. Ubuntu founder and CEO, Mark Shuttleworth displayed similar sentiments and said that it will expose Linux to an even wider audience.

Who is the audience?

Anyone who needs Linux tools and utilities on Windows is the target audience of WSL. The primary audience are certainly web developers and those IT professionals (sysadmins) who use Linux platform on their production systems.

“This is primarily a tool for developers — especially web developers and those who work on or with open source projects. This allows those who want/need to use Bash, common Linux tools (sed, awk, etc.) and many Linux-first tools (Ruby, Python, etc.) to use their toolchain on Windows,” says a community maintained FaQ by Microsoft.

Many languages and libraries are available only on Linux. Some are ported to Windows 10 but lack some features and functionalities. WSL allows the use of languages like Ruby or node natively, without making compromises.

To be clear, WSL doesn’t use the Linux kernel, it still uses the Windows kernel (read more about how WSL works here). You can think of it as command-line Linux distro, without the kernel.

Multiple distributions

With the latest update, Microsoft made it easier to run multiple Linux distros inside Windows 10. All you need to do is enable the WSL, using Turn Windows Features On and Off, and then install any supported distribution from the Windows Store. You can run multiple distributions simultaneously, isolated from each other.

Why are all these distributions needed? Each Linux distribution has its own set of commands and utilities. You can’t run CentOS or openSUSE specific commands on Ubuntu. If you are running any of these distributions on your cloud, access to these distributions on your Windows machine allows you to use native command at both places.

Microsoft continues to add more capabilities to WSL. Now you can even mount drives and run commands like rsync locally. You can use it to manage your local systems with all those great Linux command-line tools.

Does that mean you can also run Linux desktop apps on Windows 10? Yes, theoretically, there are workarounds so you can run GUI Linux apps in Windows 10 via WLS, but that’s not the intended goal of the WSL project. The primary goal is to enable developers to run the command-line tools they need.

If you are a developer who develops for both Windows and Linux, you no longer have to resort to virtual machines, Cygwin, or dual-booting. Now you have the best of both worlds. PowerShell and Bash can be used at the same time, from the same machine. If you manage your Linux machines in Azure cloud, WSL is a huge improvement. The company has succeeded in building a fine bridge between these two platforms and creating an even playing field for developers. It’s a win-win situation.

In the next article in this series, I will show how to get started with WSL on Windows 10 systems.

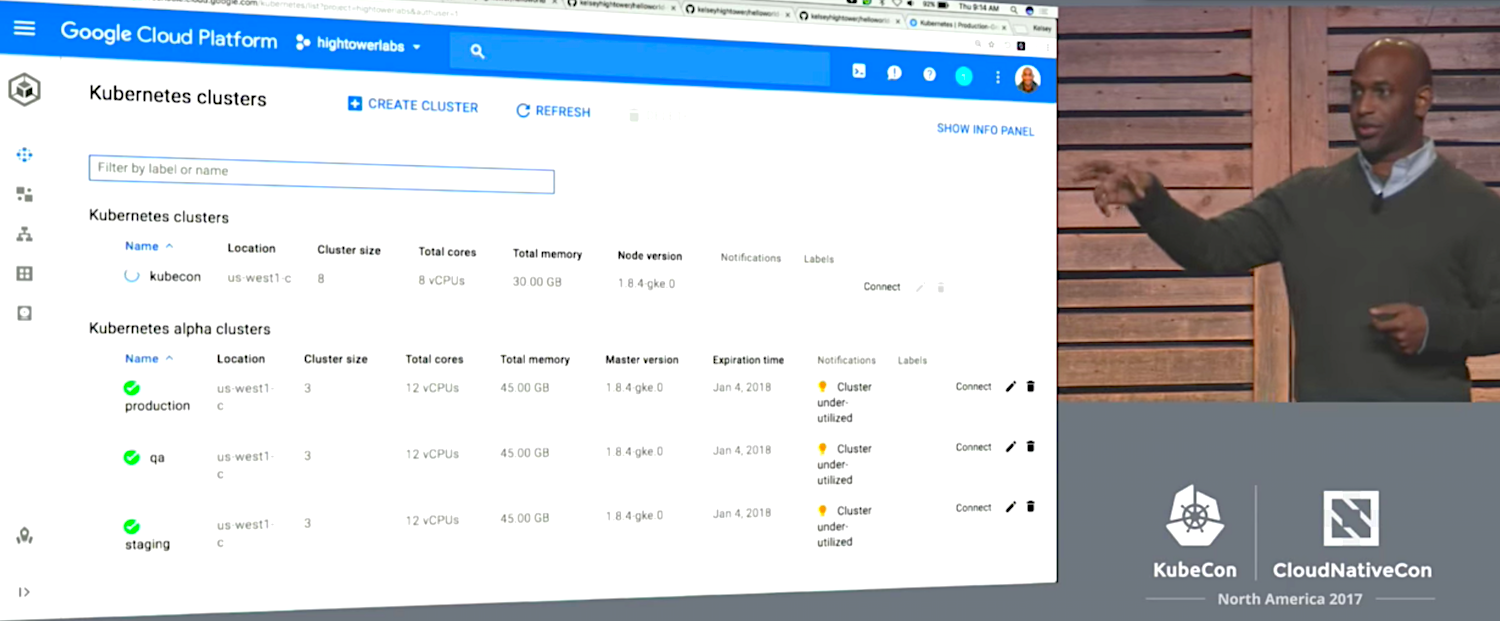
Kubernetes Monitoring with Prometheus

Kubernetes makes management of complex environments easy, but to ensure availability it’s crucial to have operational insight into the Kubernetes components and all applications running on the cluster. I believe monitoring is the backbone of a good production environment.

Applications running in containers and orchestrated by Kubernetes are highly automated and dynamic, and so, when it comes to monitoring applications in these environments, traditional server-based monitoring tools designed for static services are not sufficient.

This is where Prometheus comes in. Prometheus is an open-source systems monitoring and alerting toolkit. It’s written in Go, open source, and is incubated under the Cloud Native Computing Foundation. Prometheus has rapidly gained popularity for infrastructure and application monitoring. It was built and designed specially to monitor microservices that run in containers. 

To monitor services using Prometheus, services need to expose a Prometheus endpoint itself or via plugins called exporters . This endpoint is an HTTP interface that exposes a list of metrics and the current value of the metrics. Data is scraped from running services at time intervals and saved to a time-series database where it can be queried via the PromQL language. Because the data is stored as a time series, it allows you to explore those time intervals to diagnose problems when they occurred and to also analyze long-term monitoring trends with your infrastructure — two awesomely powerful features of Prometheus.

Prometheus uses service discovery, which is nicely integrated with Kubernetes, to find all your services. Once it has found all services, it will gather metrics for all those services by polling their Prometheus metrics endpoint. The strong points for the pull approach are that there is no need to install an agent and that the metrics can be pulled by multiple Prometheus instances.

It has a powerful query language(PromQL) to inspect that database, create alerts, and plot basic graphs. Those graphs can then be used to detect anomalies or trends for (possibly automated) resource provisioning. In the Prometheus UI, you can write queries in the PromQL language to extract metric information.

The platform also includes client libraries and a series of exporters for specific functions and components, see at https://prometheus.io/docs/instrumenting/exporters/

Prometheus also included an alert manager, which can handle alerts generated from thresholds or triggers on time series data collected by Prometheus. Alerts can be configured in the alertmanager, again using the PromQL language. 

Most Prometheus deployments generally use Grafana to render the results using custom-built dashboards. This gives much better results, and allows graphing multiple machines separately. By adding Grafana to Prometheus as a visualization layer, you can easily set up a monitoring stack for your monitoring stack.

To deploy prometheus on k8s cluster, follow steps mentioned at https://github.com/pawankkamboj/k8s-custom-metrics.git

It also included a prometheus-adaptor, you can skip it.

Open Source Audits in Merger and Acquisition Transactions: Get the Free Ebook

The influence of open source software on every aspect of business has been on the rise for years, and it should come as no surprise that its influence during merger and acquisition (M&A) transactions has grown as well. In particular, open source audits are part of required due diligence in M&A or initial public offering (IPO) processes. Not only do such audits highlight potential instances of copyright infringement, but they give buyers and investors a landscape view of important open source components in their target’s technology stack.

These issues and more are covered in-depth in a new ebook, Open Source Audits in Merger and Acquisition Transactions, from Ibrahim Haddad and The Linux Foundation…

Read more at The Linux Foundation

Virtualized GPU Access: Implementing OpenGL ES 2.0 Support

Virtualized GPU access is becoming common in the containerized and virtualized application space. Let’s have a look at why and how.

By Robert Foss, Senior Software Engineer at Collabora.

For the past few years a clear trend of containerization of applications and services has emerged. Having processes containerized is beneficial in a number of ways. It both improves portability and strengthens security, and if done properly the performance penalty can be low.

In order to further improve security containers are commonly run in virtualized environments. This provides some new challenges in terms of supporting the accelerated graphics usecase.

OpenGL ES implementation

Currently Collabora and Google are implementing OpenGL ES 2.0 support. OpenGL ES 2.0 is the lowest common denominator for many mobile platforms and as such is a requirement for Virgil3D to be viable on the those platforms.

That is is the motivation for making Virgil3D work on OpenGL ES hosts.

How does this work?

This stack is commonly referred to as Virgil3D, since all of the parts originated from a project with that name.

Collabora - Virtualized OpenGL Stack

There are a few parts to this implementation.

QEMU, virglrenderer and virtio-gpu. They way it works is by letting the guest applications speak unmodified OpenGL to the Mesa. But instead of Mesa handing commands over to the hardware it is channeled through virtio-gpu on the guest to QEMU on the host.

QEMU then receives the raw graphics stack state (Gallium state) and interprets it using virglrenderer from the raw state into an OpenGL form, which can be executed as entirely normal OpenGL on the host machine.

The host OpenGL stack does not even have to be Mesa, and could for example be the proprietary nvidia stack.

Continue reading on Collabora’s blog.


The Full-Time Job of Keeping Up with Kubernetes

There is no such thing as Kubernetes LTS (and that’s fantastic).

TL;DR – Unabated 1.xx major “minor” releases of “vanilla” upstream Kubernetes every three months could continue forever. You have to keep up, while also paying close attention to Kubernetes API object versioning. This relentless pace is the key ingredient in Kubernetes’ domination of the distributed infrastructure world.

What is the Kubernetes Release Cycle?

One of the questions we encounter when talking to those looking to leverage Kubernetes, especially for DIY deployments, is simply “How do you stay up-to-date?”

This leads to a Kubistential awakening:

Read more at Gravitational Blog

Correctly Integrating Containers

If you run microservices in containers, they are forced to communicate with each other – and with the outside world. We explain how to network pods and nodes in Kubernetes.

Kubernetes supports different ways of making containers and microservices contact each other, from connections with the hardware in the data center to the configuration of load balancers. To ensure communication, the Kubernetes [1] network model does not use Network Address Translation (NAT). All containers receive an IP address for communication with nodes and with each other, without the use of NAT.

Therefore, you cannot simply set up two Docker hosts with Kubernetes: The network is a distinct layer that you need to configure for Kubernetes. Several solutions currently undergoing rapid development, like Kubernetes itself, are candidates for this job. In addition to bandwidth and latency, integration with existing solutions and security also play a central role. Kubernetes pulls out all stops with the protocols and solutions implemented in Linux.

Read more at ADMIN Magazine

KPTI/KAISER Meltdown Initial Performance Regressions

The recently revealed Meltdown and Spectre bugs are not just extraordinary issues of security, but also performance. The patches that workaround Meltdown introduce the largest kernel performance regressions I’ve ever seen. Many thanks to the engineers working hard to develop workarounds to these processor bugs.

In this post I’ll look at the Linux kernel page table isolation (KPTI) patches that workaround Meltdown: what overheads to expect, and ways to tune them. Much of my testing was on Linux 4.14.11 and 4.14.12 a month ago, before we deployed in production. Some older kernels have the KAISER patches for Meltdown, and so far the performance overheads look similar. These results aren’t final, since more changes are still being developed, such as for Spectre.

Note that there are potentially four layers of overhead for Meltdown/Spectre, this is just one. They are:

Read more at Brendan Gregg’s blog

MX Linux 17: An Upgraded Distro Made for Beginners

This powerful operating system’s efficient performance, intuitive interface, and exceptional collection of apps make it a top choice for all users.

MX-17 changes the base to Debian 9 (Stretch) and provides upgraded artwork, fresh MX tools, and better live operation courtesy of antiX. Users get persistence (a whopping 20GB) and remaster along with a full suite of updated MX-apps including mx-tweakmx-conky, and NVidia.

Here’s why MX-17 is a worthy distro, and what you stand to gain from this midweight Linux operating system and its antiX components.

Read more at OpenSource.com