Linux. It’s powerful, flexible, stable, secure, user-friendly… the list goes on and on. There are so many reasons why people have adopted the open source operating system. One of those reasons which particularly stands out is its flexibility. Linux can be and do almost anything. In fact, it will (in most cases) go well above what most platforms can. Just ask any enterprise business why they use Linux and open source.
But once you’ve deployed those servers and desktops, you need to be able to keep track of them. What’s going on? How are they performing? Is something afoot? In other words, you need to be able to monitor your Linux machines. “How?” you ask. That’s a great question, and one with many answers. I want to introduce you to a few such tools—from command line, to GUI, to full-blown web interfaces (with plenty of bells and whistles). From this collection of tools, you can gather just about any kind of information you need. I will stick only with tools that are open source, which will exempt some high-quality, proprietary solutions. But it’s always best to start with open source, and, chances are, you’ll find everything you need to monitor your desktops and servers. So, let’s take a look at four such tools.
Top
We’ll first start with the obvious. The top command is a great place to start, when you need to monitor what processes are consuming resources. The top command has been around for a very long time and has, for years, been the first tool I turn to when something is amiss. What top does is provide a real-time view of all running systems on a Linux machine. The top command not only displays dynamic information about each running process (as well as the necessary information to manage those processes), but also gives you an overview of the machine (such as, how many CPUs are found, and how much RAM and swap space is available). When I feel something is going wrong with a machine, I immediately turn to top to see what processes are gobbling up the most CPU and MEM (Figure 1). From there, I can act accordingly.
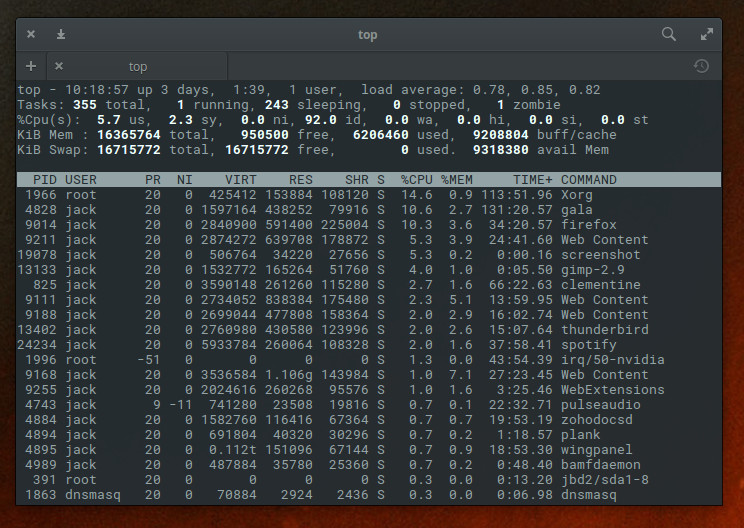
There is no need to install anything to use the top command, because it is installed on almost every Linux distribution by default. For more information on top, issue the command man top.
Glances
If you thought the top command offered up plenty of information, you’ve yet to experience Glances. Glances is another text-based monitoring tool. In similar fashion to top, glances offers a real-time listing of more information about your system than nearly any other monitor of its kind. You’ll see disk/network I/O, thermal readouts, fan speeds, disk usage by hardware device and logical volume, processes, warnings, alerts, and much more. Glances also includes a handy sidebar that displays information about disk, filesystem, network, sensors, and even Docker stats. To enable the sidebar, hit the 2 key (while glances is running). You’ll then see the added information (Figure 2).
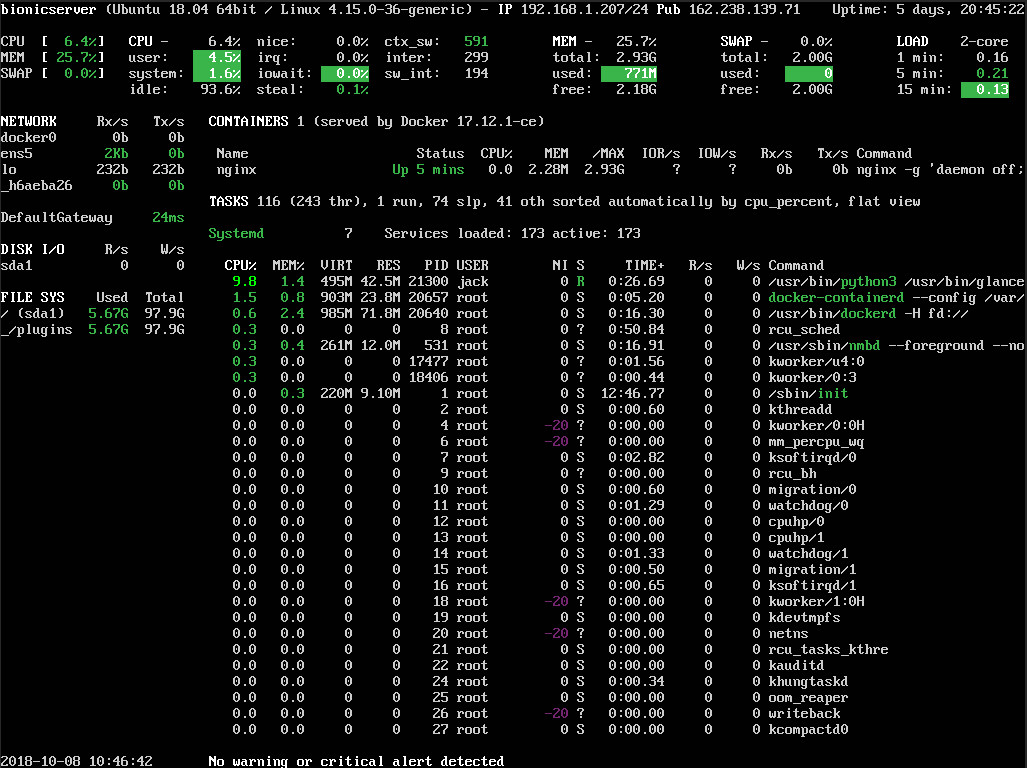
You won’t find glances installed by default. However, the tool is available in most standard repositories, so it can be installed from the command line or your distribution’s app store, without having to add a third-party repository.
GNOME System Monitor
If you’re not a fan of the command line, there are plenty of tools to make your monitoring life a bit easier. One such tool is GNOME System Monitor, which is a front-end for the top tool. But if you prefer a GUI, you can’t beat this app.
With GNOME System Monitor, you can scroll through the listing of running apps (Figure 3), select an app, and then either end the process (by clicking End Process) or view more details about said process (by clicking the gear icon).
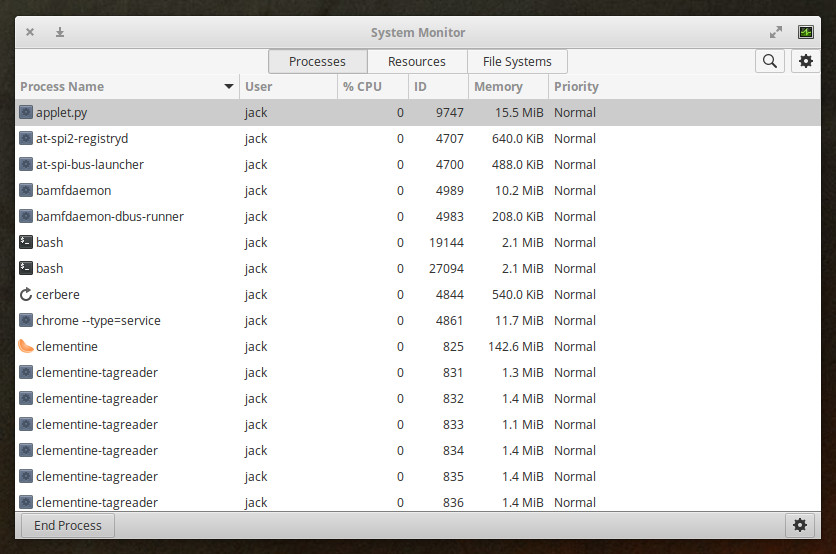
You can also click any one of the tabs at the top of the window to get even more information about your system. The Resources tab is a very handy way to get real-time data on CPU, Memory, Swap, and Network (Figure 4).
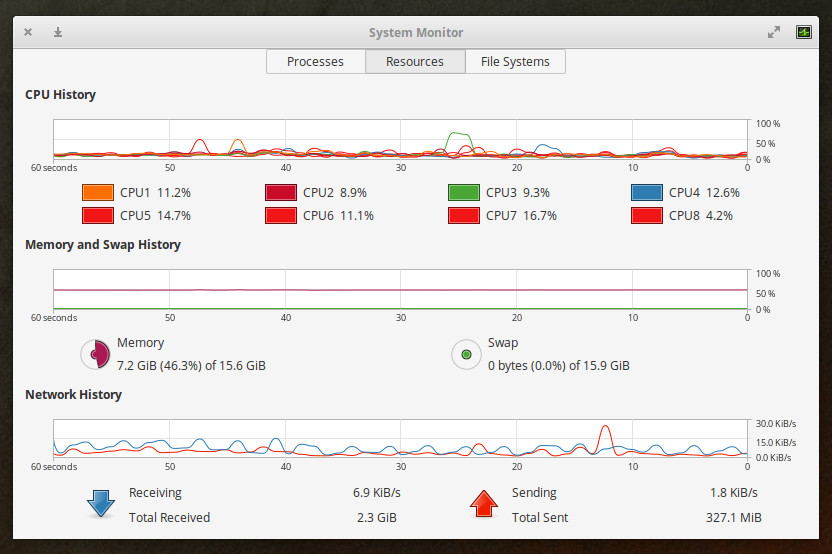
If you don’t find GNOME System Monitor installed by default, it can be found in the standard repositories, so it’s very simple to add to your system.
Nagios
If you’re looking for an enterprise-grade networking monitoring system, look no further than Nagios. But don’t think Nagios is limited to only monitoring network traffic. This system has over 5,000 different add-ons that can be added to expand the system to perfectly meet (and exceed your needs). The Nagios monitor doesn’t come pre-installed on your Linux distribution and although the install isn’t quite as difficult as some similar tools, it does have some complications. And, because the Nagios version found in many of the default repositories is out of date, you’ll definitely want to install from source. Once installed, you can log into the Nagios web GUI and start monitoring (Figure 5).
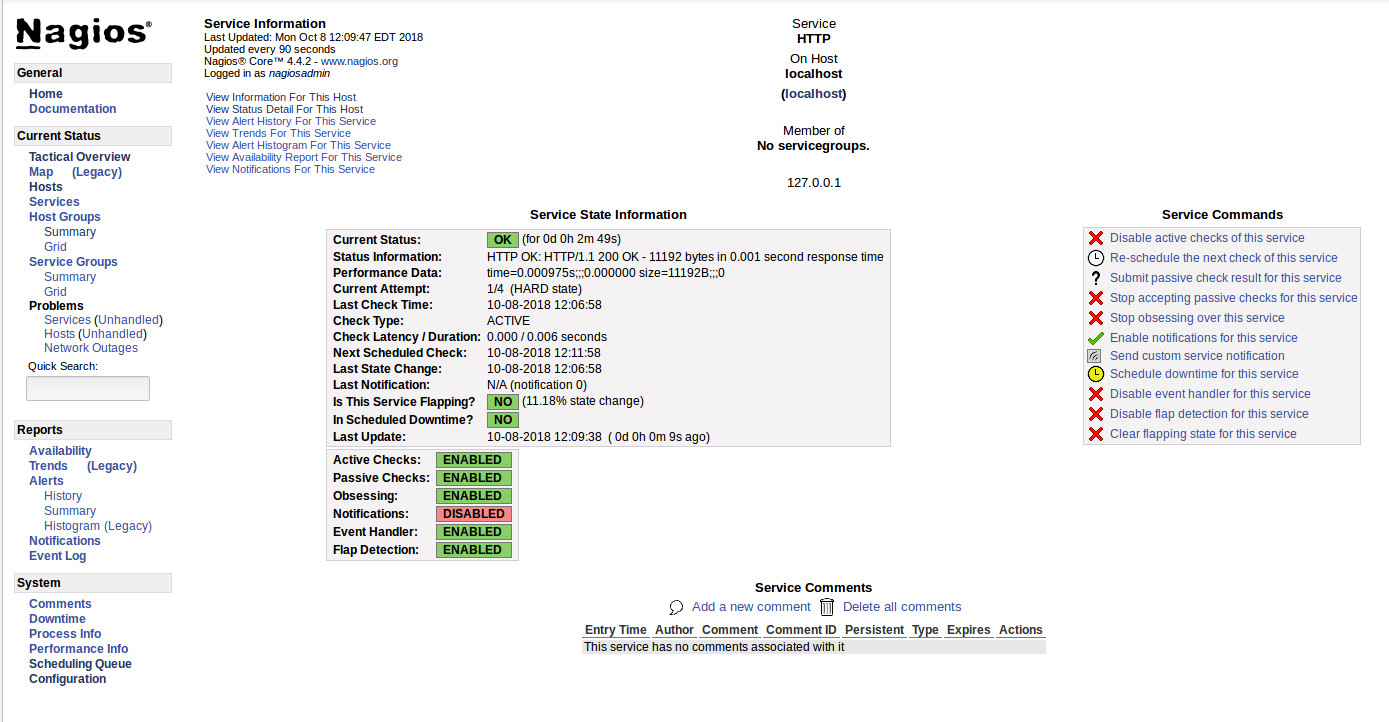
Of course, at this point, you’ve only installed the core and will also need to walk through the process of installing the plugins. Trust me when I say it’s worth the extra time.
The one caveat with Nagios is that you must manually install any remote hosts to be monitored (outside of the host the system is installed on) via text files. Fortunately, the installation will include sample configuration files (found in /usr/local/nagios/etc/objects) which you can use to create configuration files for remote servers (which are placed in /usr/local/nagios/etc/servers).
Although Nagios can be a challenge to install, it is very much worth the time, as you will wind up with an enterprise-ready monitoring system capable of handling nearly anything you throw at it.
There’s More Where That Came From
We’ve barely scratched the surface in terms of monitoring tools that are available for the Linux platform. No matter whether you’re looking for a general system monitor or something very specific, a command line or GUI application, you’ll find what you need. These four tools offer an outstanding starting point for any Linux administrator. Give them a try and see if you don’t find exactly the information you need.


