
One of the great things about open source is that (most of the time), source code repositories are easily accessible. They can be great sources of diagnostic data, enabling you to understand who is contributing and committing code to your critical upstream projects. However, acquiring this data can be a labor-intensive process when monitoring a bunch of repos at once. This is particularly true if you want to monitor how contributions to a project change over time.
My background is in math, and I love digging into numbers to understand how and why things are happening in a certain way. Over the past few years I realized that generating summary statistics is the most time-consuming part of analyzing contributor stats. There are tools out there which can generate excellent summaries for single repos (and particularly for the kernel; gitdm is fantastic at this).
However, I regularly found myself doing substantial post-processing to generate consolidated views of the data. Unfortunately, this meant hours in Excel monkeying around with pivot tables. And, if you discover you got something wrong or need to map a domain name to a corporate affiliation, it’s back to square one… and when you want to see how things have changed, it happens all over again.
This is not a good way to keep yourself sane. So, in the spirit of “scratch your own itch,” I wrote a tool to analyze groups of git repos, aggregate the stats, and produce summary reports.
The FOSS Anomaly Detector, aka “Facade”
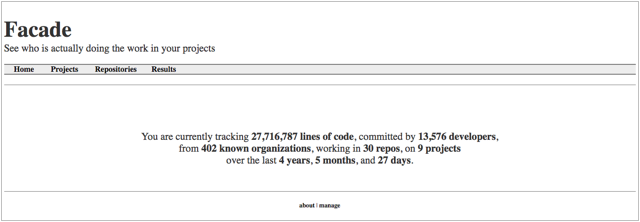
I call the project Facade (Figure 1). The meaning is twofold: First, this was originally conceived as a “FOSS Anomaly Detector” (F.O.S.S.A.D.), which would allow you to see how contribution patterns changed over time. Second, it allows you to see behind your speculations about the project, and get an informed view of who is doing the development work, based upon real data.
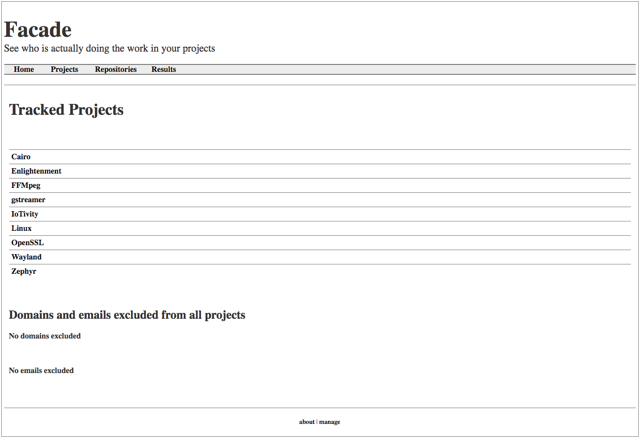
Facade is built around the idea of “projects,” which are groups of repositories (Figure 2). Statistics are aggregated by project and for individual repos. Most interactions with it are web-based, and it can run more or less unattended and continuously. Creating reports requires little more than copying and pasting, but if you really want to dive in, it can produce a CSV of raw contributor data. If you’re handy with Python and MySQL, you can also create customized summary reports as Excel files each time the dataset is updated.
Facade gets its data by mining the git log. First, it calculates the list of parent commits for HEAD, and figures out which it hasn’t yet parsed. For each commit, it stores the author info, the committer info, the files that were changed, and stats about the patch itself. Then once the analysis is complete, it summarizes these stats by repo or project:
-
Lines of code added (minus whitespace changes)
-
Lines of code removed
-
Number of whitespace changes (changes to indentation, blank lines, etc)
-
Number of patches
-
Number of unique contributors
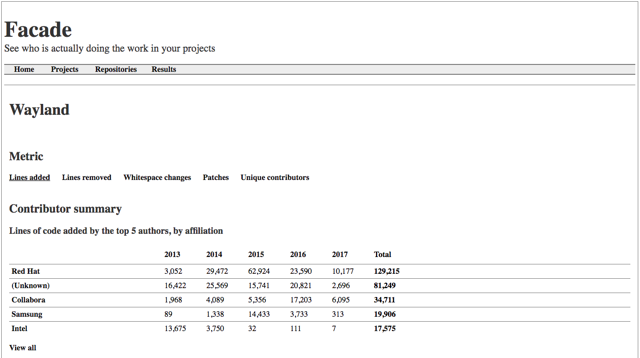
Facade attempts to associate email addresses with companies (Figure 3). These mappings can be added in the web interface, so you can gradually increase the accuracy of Facade over time.
Facade also includes the ability to tag email addresses, for identifying teams of contributors within the data.
All of the info is stored in a database, so if you want to get really granular (for example, “who authored the most non-whitespace changes to a certain file between 2011 and 2014?”) you have the raw data you need. I designed it to store pretty much everything, so for every commit it records:
-
The commit hash
-
The author’s name
-
The author’s email
-
The author’s canonical email, if they used an alias
-
The author’s affiliation (if known)
-
The date the patch was generated
-
The committer’s name
-
The committer’s email
-
The committer’s canonical email, if they used an alias
-
The committer’s affiliation (if known)
-
The date the patch was committed
-
The filename
-
Lines of code added
-
Lines of code removed
-
Number of whitespace changes
Getting started
The Facade source code can be found at https://github.com/brianwarner/facade.
The best way to get started is to clone Facade into your web root, and then follow the README. You will probably need to resolve a few dependencies.
Next you’ll run python utilities/setup.py. By and large, it should do everything for you unless you want to customize things. If you already have a MySQL database that supports utf8mb4, Facade can use that. Or you can just mash the Enter key a bunch of times, enter the root database password, and Facade will create the database, user, and tables for you. Once you set up your username and password for the website, you’re ready to go.
The first thing to do is log into the website, using the “manage” link at the bottom. This will allow you to configure projects, add repos, create tags, update aliases and affiliations, and set global configurations.
Once you’ve added a few repos, it’s back to the command line. Run utilities/Facade-worker.py, and when it’s complete project and repo stats will appear on the website.
Chances are pretty good that almost all will be categorized as (Unknown) affiliations. Don’t panic, that’s expected. Go to the People tab, fill in a few domain mappings, and re-run Facade-worker.py. The results should make a bit more sense.
Facade is intended to be run on a regular basis, so I recommend setting up a daily cron job. Just remember, if you make changes using the web interface, run the facade-worker.py script to see their effects.
So how does this compare with gitdm?
Gitdm is a fantastic tool, and it’s used for different things than Facade. In particular, it’s really well designed for gathering Linux kernel statistics, and it enables much finer-grained control over the range of commits. It also is a little easier to get up and running, as it doesn’t require a database or web server. gitdm also works on a single repository, and produces a single aggregate report.
On the other hand, Facade is meant to be run continuously, and data is stored so it doesn’t have to be recalculated each time. The statistics are grouped by date, which allows different views of the data. Facade will also yield slightly different results because it attempts to break out whitespace contributions separately.
So while both tools do gather summary stats, there are different (and very good) reasons to use one or the other.
“Dammit Jim, I’m a manager, not an engineer!”
I’ll just close with a preemptive apology — I write code for fun, not for a living, and am the first to admit I have lots more to learn. There may be rough edges, corner cases, and things which can be improved. So if you look at Facade and something about it makes you cringe, I would love to see your patches. Or if you’d like to make it do something new and cool, I would also love to see your patches. I am maintaining a list of things I’d like to add, and welcome both ideas and contributors.
You can find the code on GitHub, and me on Twitter.


