Home Blog Page 299

cregit: Token-Level Blame Information for the Linux Kernel

Who wrote this code? Why? What changes led to this function’s current implementation?

These are typical questions that developers (and sometimes lawyers) ask during their work. Most software development projects use version control software (such as Git or Subversion) to track changes and use the “blame” feature of these systems to answer these questions.

Unfortunately, version control systems are only capable of tracking full lines of code. Imagine the following scenario: A simple file is created by developer A; later, it is changed by Developer B, and finally, by Developer C. The following figure depicts the contents of the files after each modification. The source code has been colored according to the developer who introduced it (blue for Developer A, green for Developer B, and red for Developer C; note that Developer B only changed whitespace –including merging some lines).

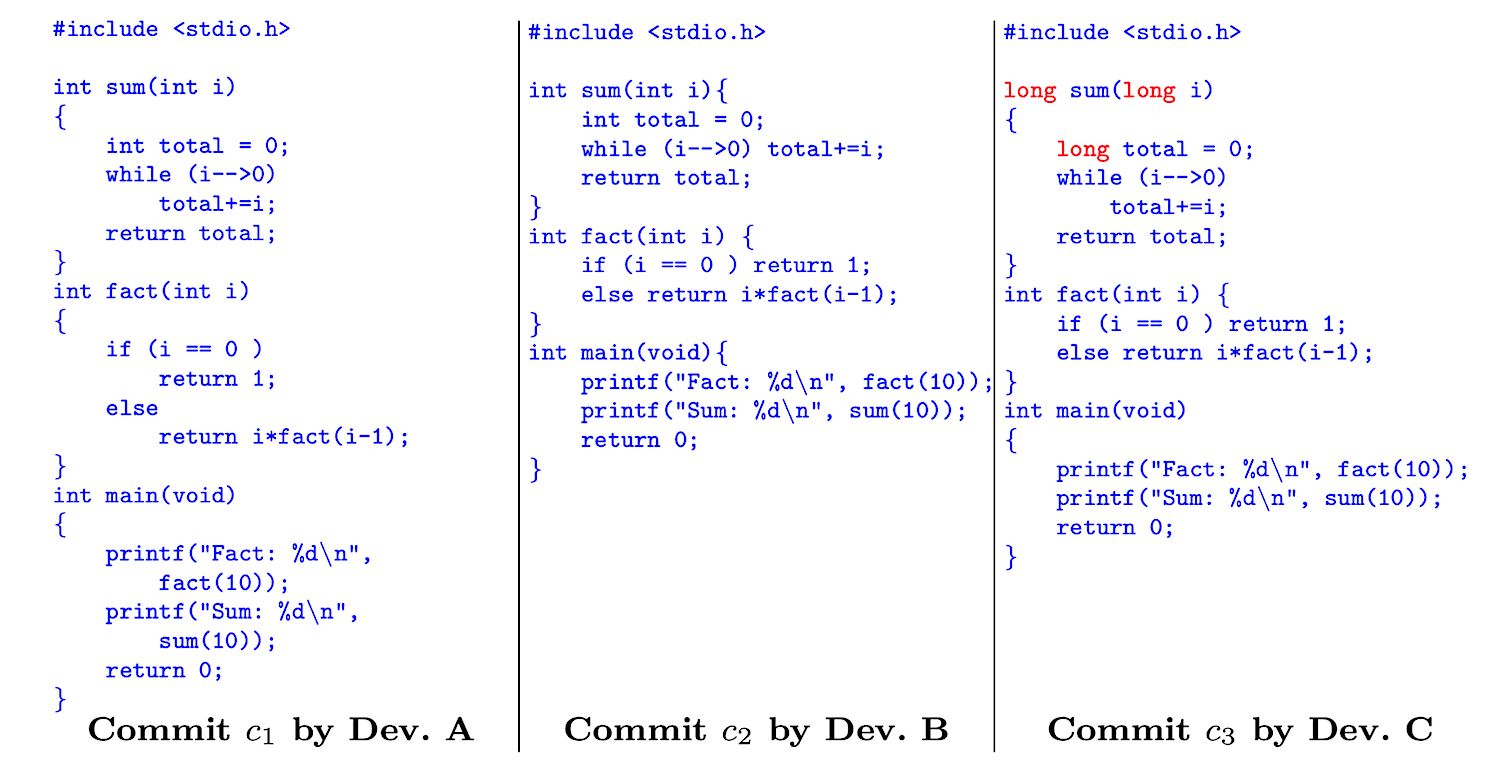
Blame tracks lines not tokens

If we were to use git to track these changes, and use git-blame with default parameters, its output will show that Developer B and C are mostly responsible for the contents of the file. However, if we were to instruct blame to ignore changes to whitespace, the results would be:

In general, one would expect to always ask blame to ignore whitespace. Unfortunately, this is not always possible (such as the “blame” view of GitHub, which is computed without ignoring whitespace).

Note that, even if we run blame with the ignore-whitespace option, the “blame” is incorrect. First, lines merged or split are not addressed properly by blame (the ignore-whitespace option does not ignore them). Second, lines that were mostly authored by Developer A are now assigned to Developer C because she was the last one to modify them.

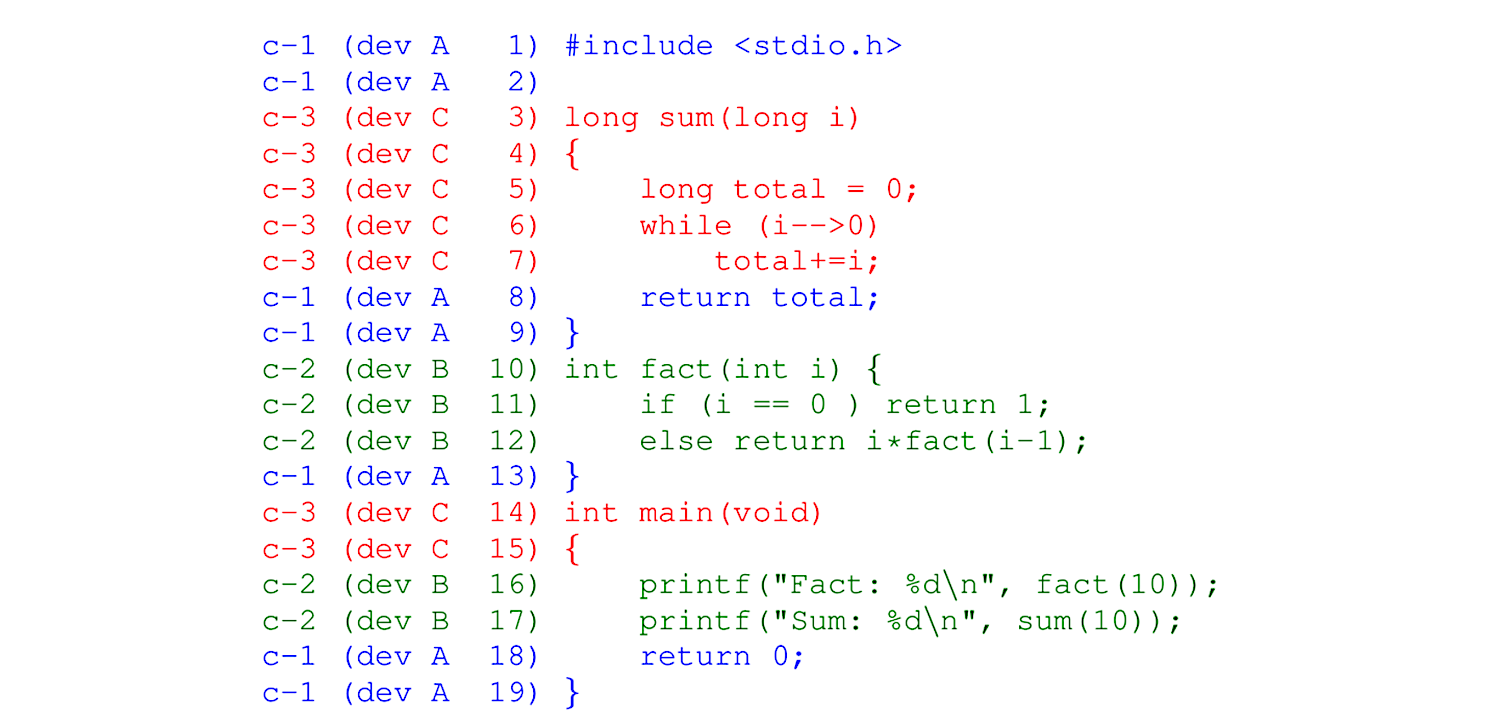
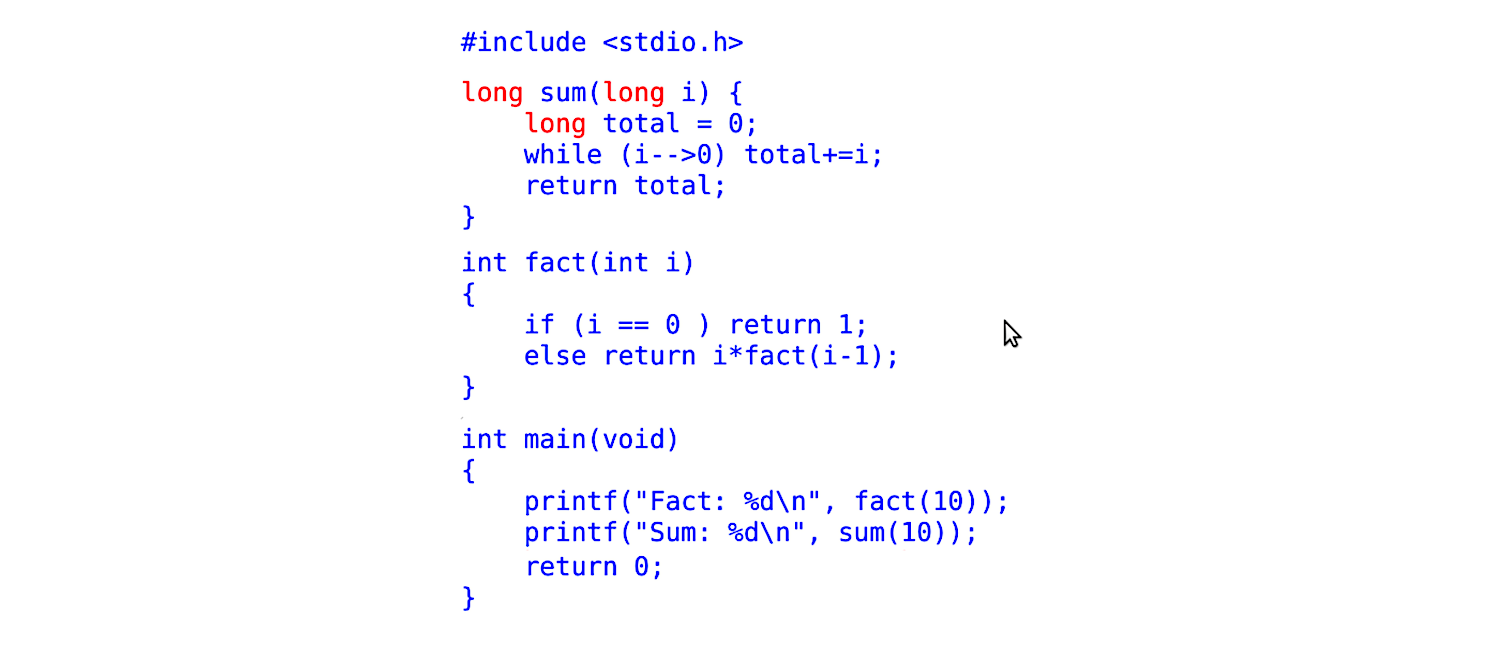
If we consider the token as the indivisible unit of source code (i.e., a token cannot be modified, it can only be removed or inserted), then what we really want is to know who is responsible for introducing each token to the source code base. A blame-per-token for the file in our example would look like the figure below. Note how it correctly shows that the only changes made by C to the source code were the replacement of int with long in three places, and that B made no changes to the code:

cregit: improving blame of source code

We created cregit to do exactly this. The goal of cregit is to provide token-level blame for a software system whose history has been recorded using git. The details of cregit’s implementation can be found in this Working Paper (currently under review).

We have empirically evaluated cregit on several mature software systems. In our experiments, we found that blame-per-line tends to be accurate between 70% and 80% of the time. This highly depends on how much the code has been modified. The more modifications to existing code, the less likely that blame-per-line will be accurate. Cregit on the other hand is able to increase this accuracy to 95% (please see the paper mentioned above for details).

For the last two years, we have been running cregit on the source code of the Linux kernel. The results can be found at: https://cregit.linuxsources.org/code/4.19/.

Blame-per-line is easy to implement, just put the blame information to the side; however, blame-per-token is significantly more complex, as its tokens might have different authors and/or commits responsible for them. Hence, we are currently rolling out an improved view of blame-per-token for kernel release 4.19 of Linux (older versions use an old view, and most of the information here does not apply).

cregit views: inspecting who changed what/when

Below is an example of the blame-per-token views of Linux 4.19, specifically for the file audit.c.html.

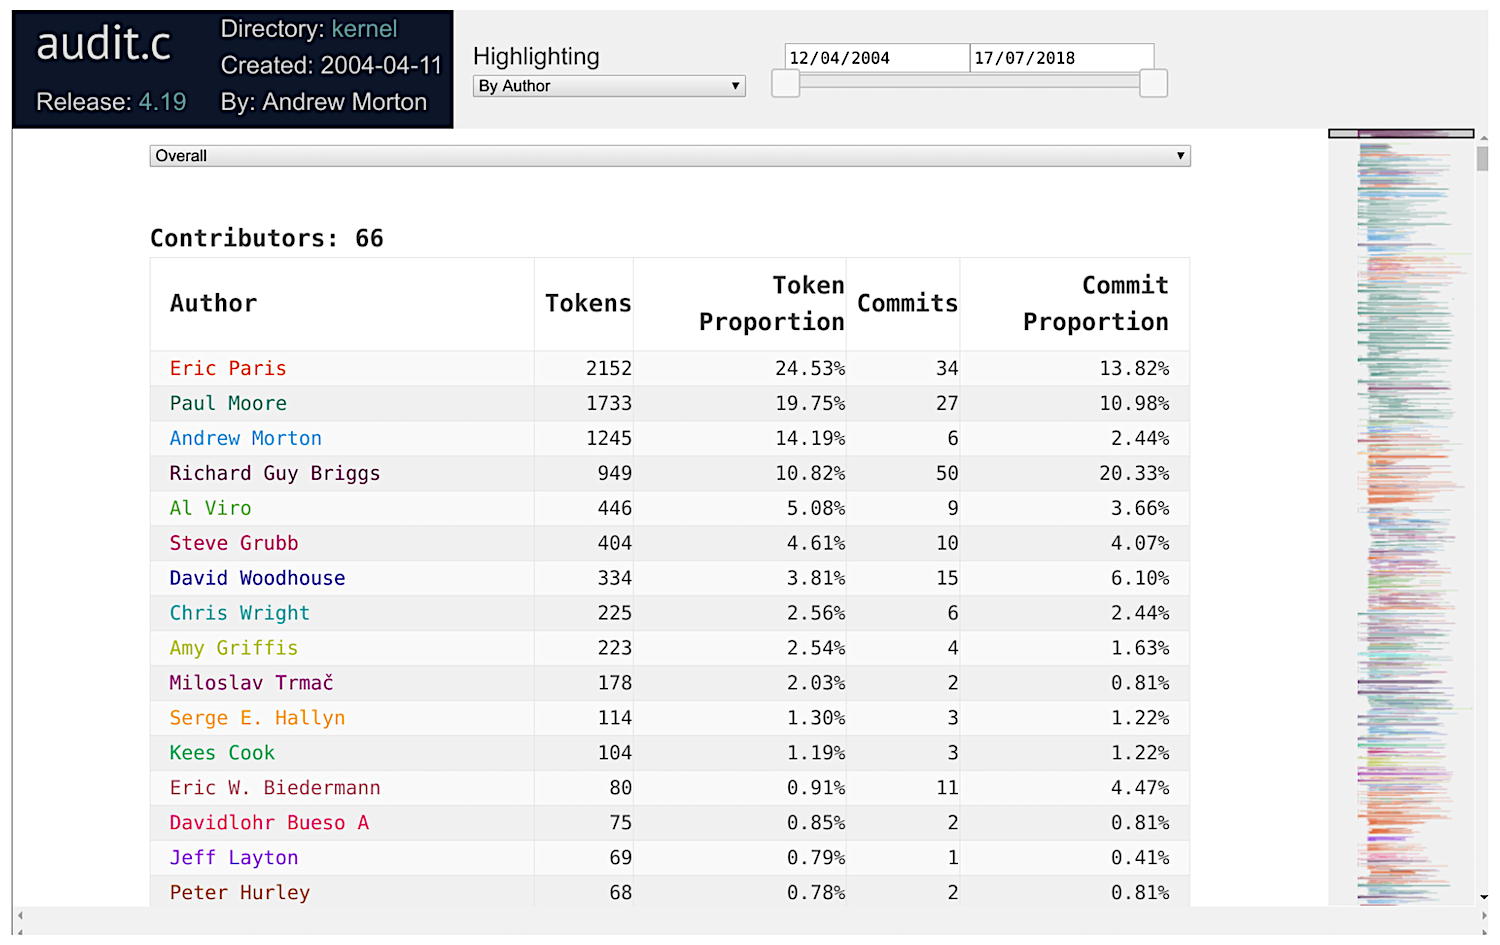
The top part gives us an overview of who the authors of the file are. The first 50 authors are individually colored. The source code is colored according to the person who last added the token. The right-hand side of the view shows an overview of the “ownership” of the source code.

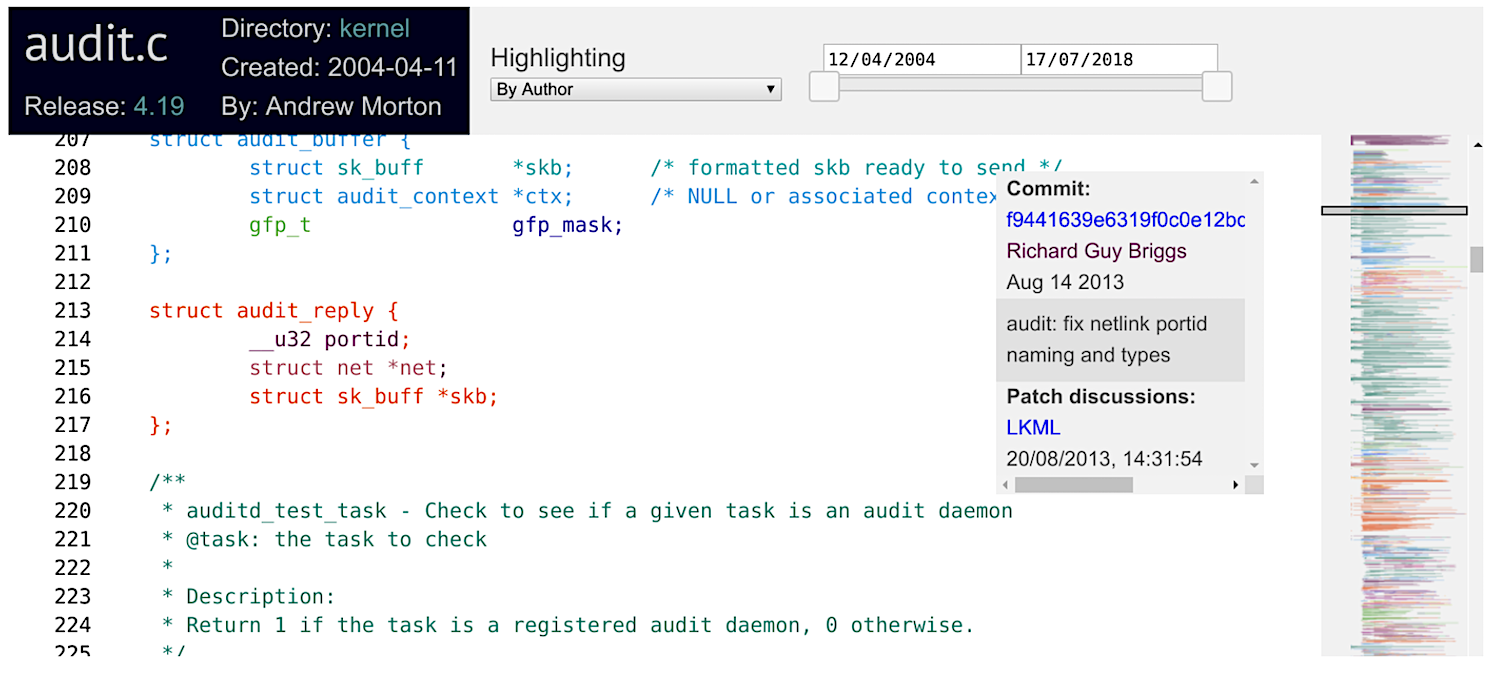
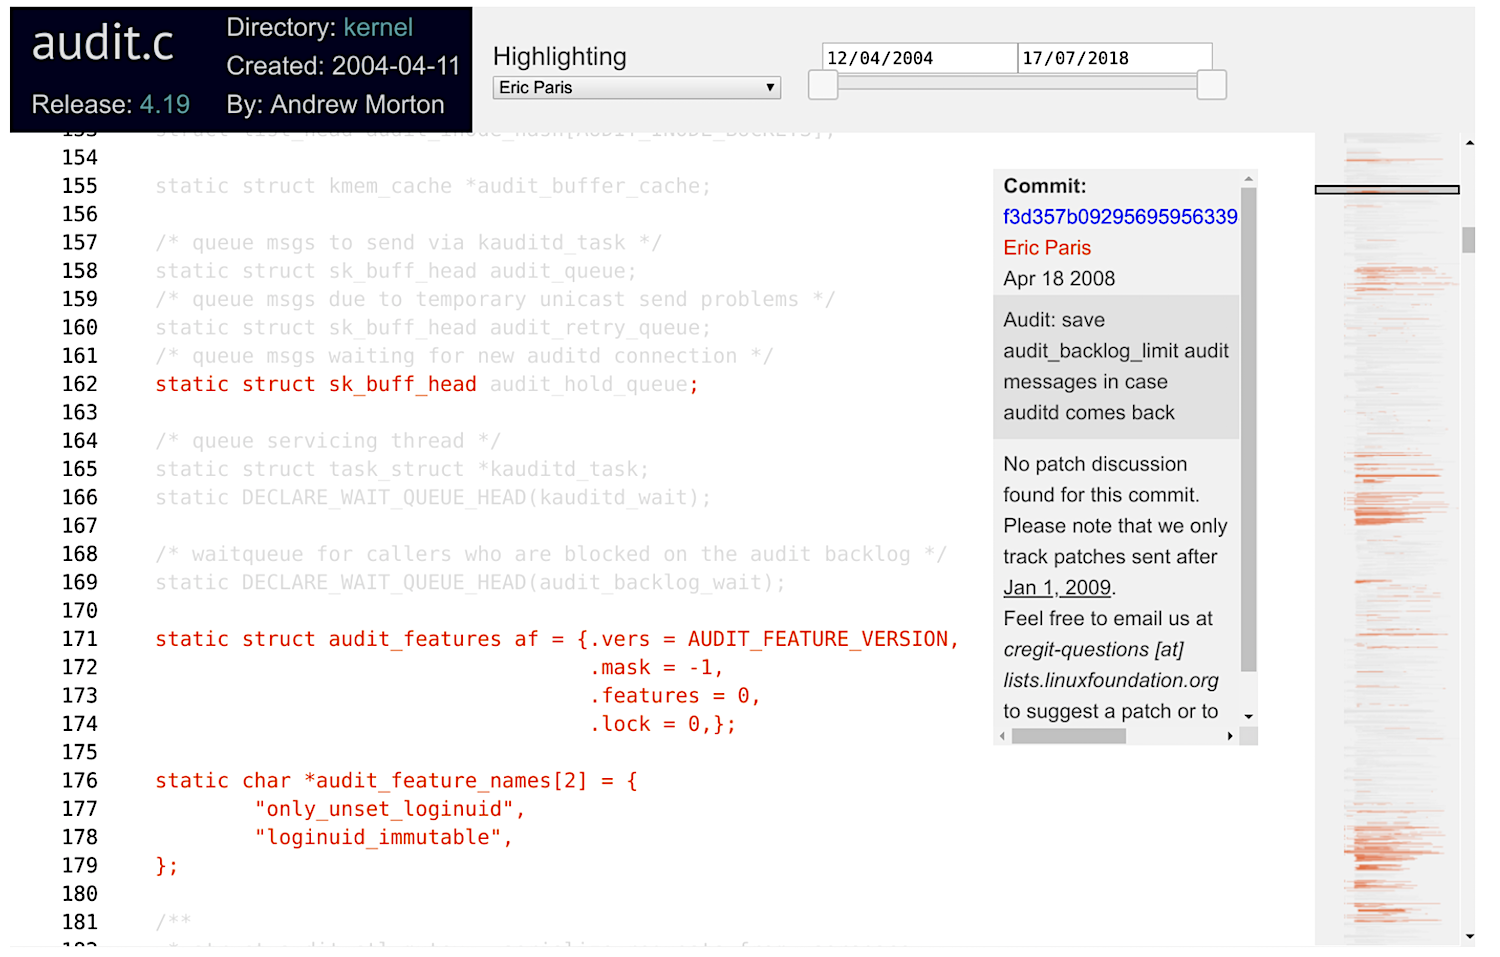
While hovering over the source code, you will see a box displaying information about how that token got into the source code: the commit id, its author, and its commit timestamp and summary. If you click on the token, this information is enhanced with a link to the email thread that corresponds to the code review of the commit that inserted that token, as shown below:

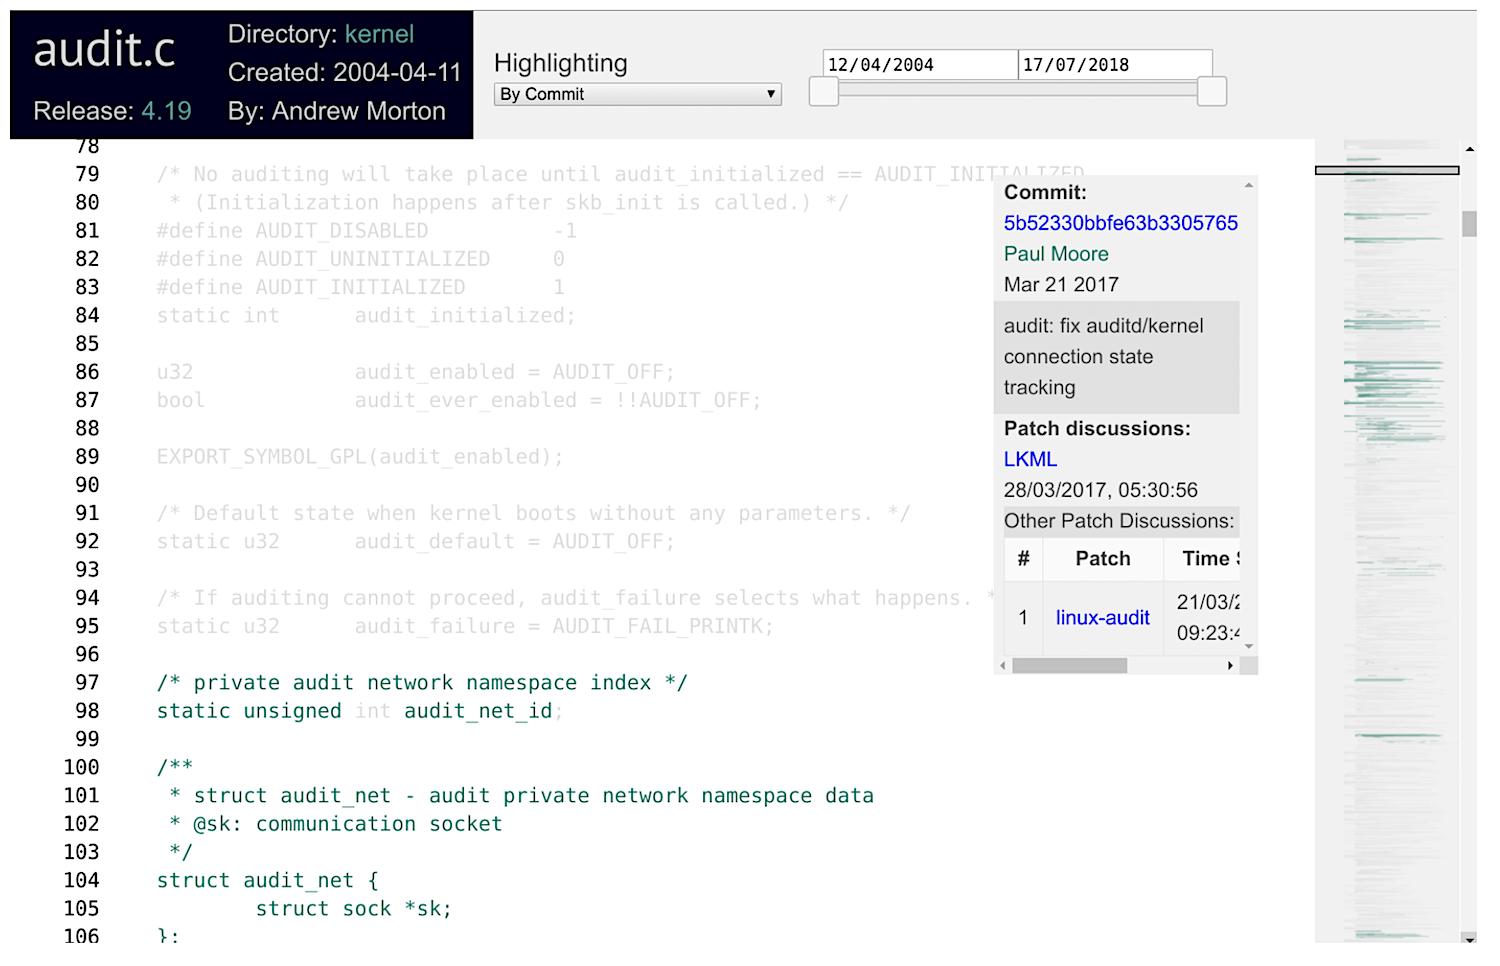
The views are highly interactive. For example, one can select to highlight a commit (top middle combo box). In this case, all the code is grayed out, except for the tokens that were added by that commit, as shown below.

You can also click on an author’s name, and only that author’s code will be highlighted. For example, in the image below I have highlighted Eric Paris’s contributions.

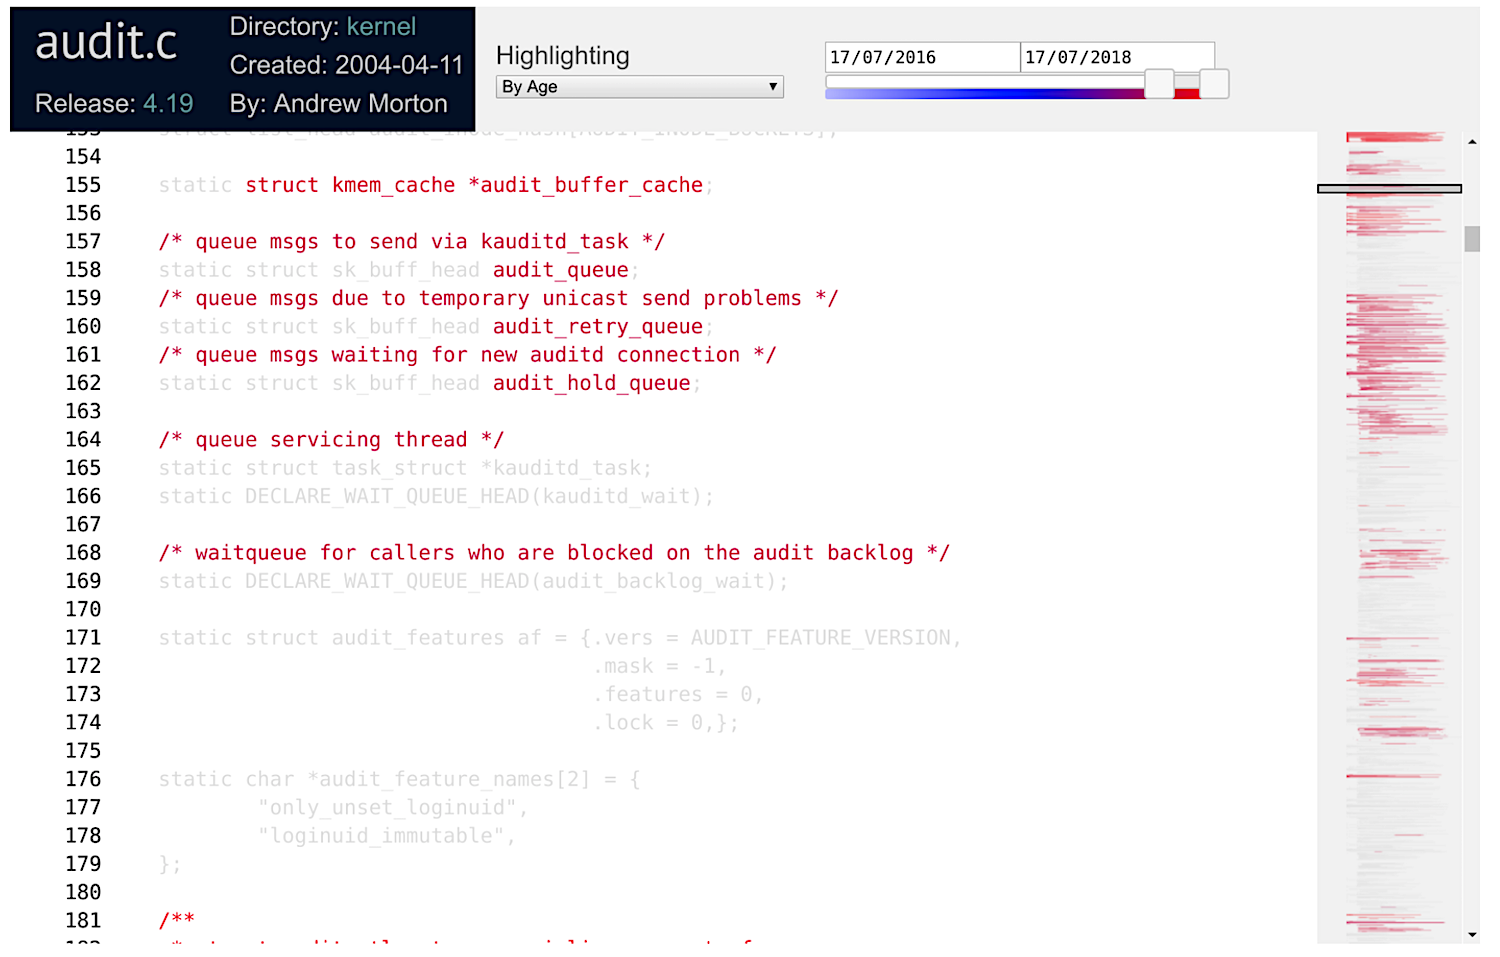
cregit is also capable of highlighting the age of the code. The sliding bar at the top right allows to narrow the period of interest. Below I have selected to show changes during the last two years (note that the file was last modified in July 17, 2018.

It is also possible to focus on a specific function, which can be selected with the Functions combo box at the top of the source code. In the example below I have selected the function audit_set_failure. The rest of the code has been hidden.

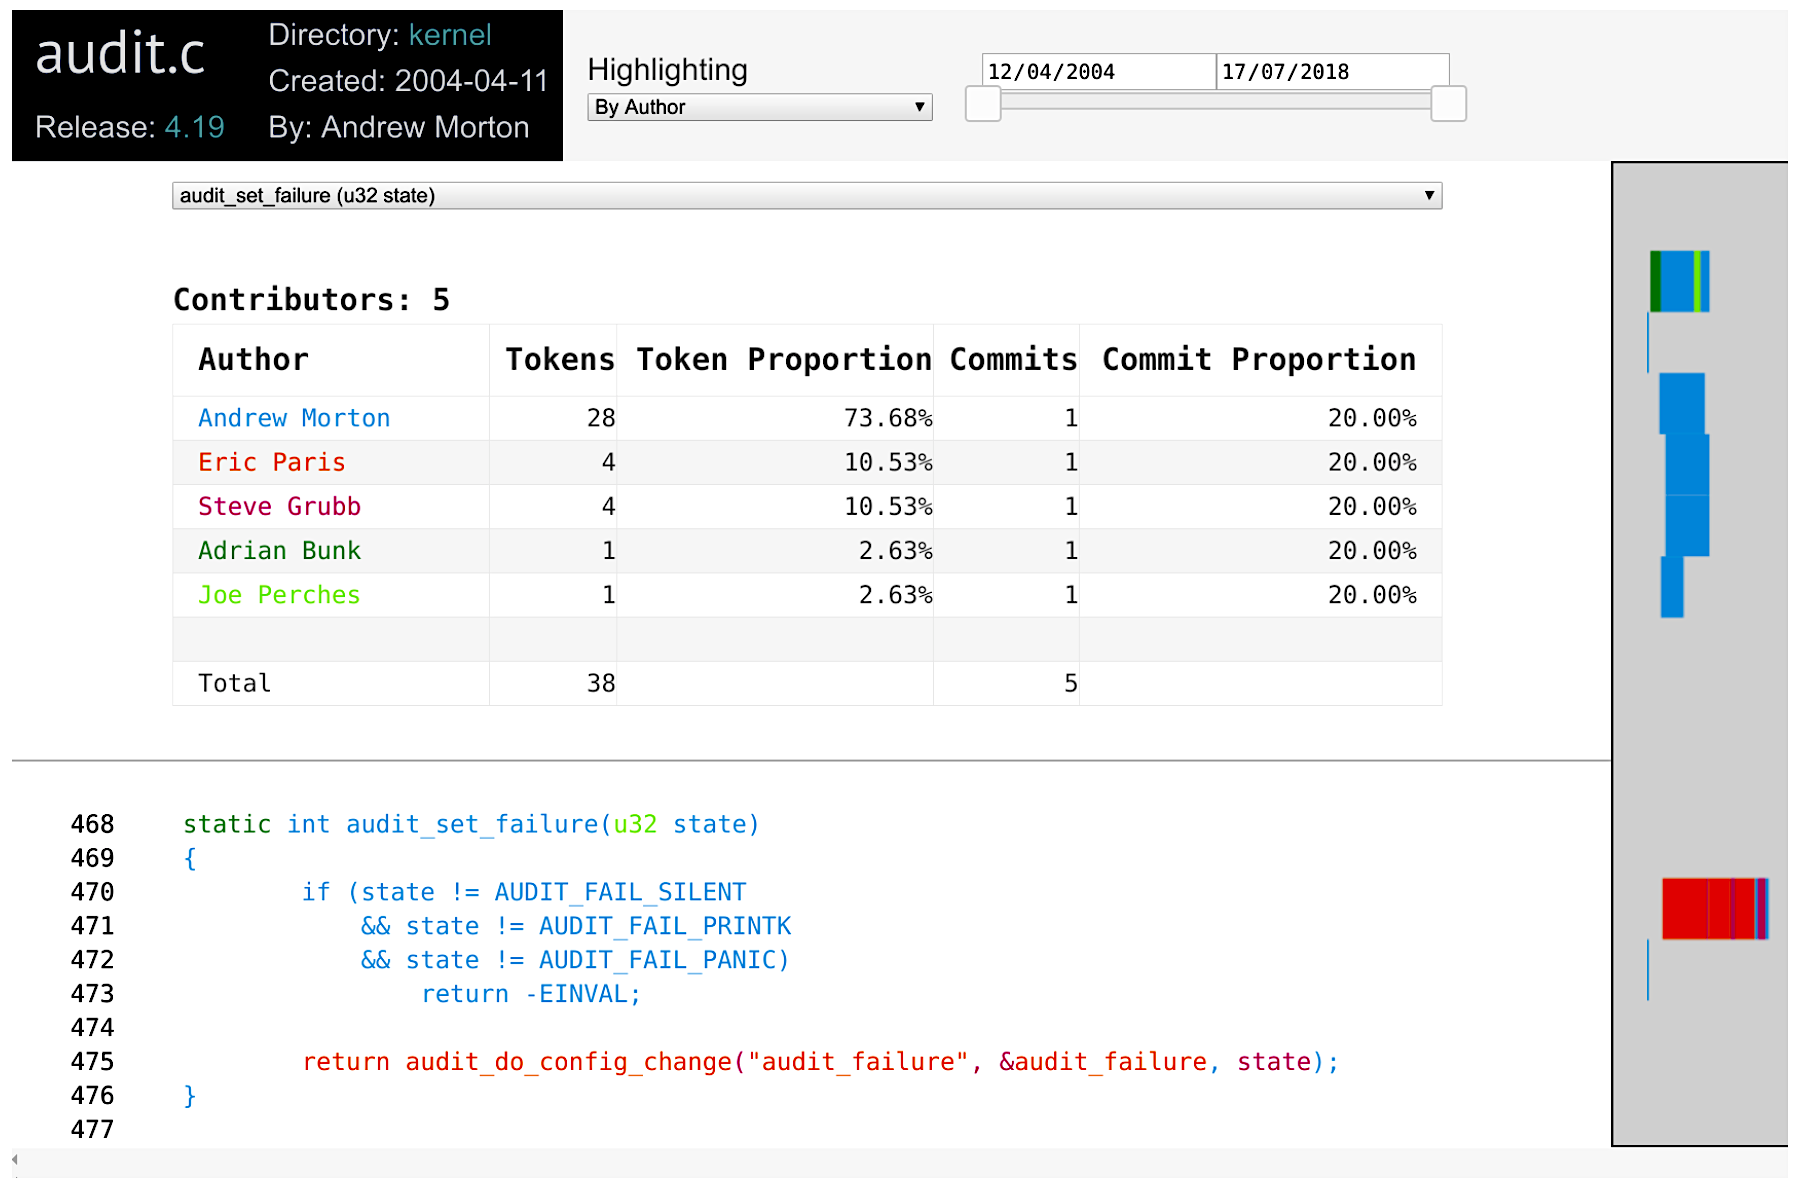
These features can be easily combined. You can select the age of the code by a specific author. And narrow it to a given function!

cregit views: improving the linkage of email code reviews

We are going to keep expanding the information shown in the commit panel. Currently, in addition to the metadata of the commit that is responsible for the token, it provides hyperlinks to the commit patch, and to any email discussions we have been able to find regarding this commit. We are working to match more and more commits.

cregit: where to get it

cregit is open source, and is accessible from https://github.com/cregit/cregit. It is capable of processing C, C++, Java, and go. We can probably add support for perl and python fairly easily. All we need to support a new language is a tokenizer.

cregit’s input is a git repository, and its output is another git repository that tracks the source code by token (see paper for details). From this repository we construct the blame views shown above. If you are interested to have your repository processed with cregit, email me.

Finally, I would like to acknowledge several people for their contributions:

  • Bram Adams. Bram and I are the creators of cregit.
  • Jason Lim. As part of his coursework at UVic he implemented the new cregit views, which have greatly improved their usefulness.
  • Alex Courouble. As part of his master’s at the Poly of Montreal he implemented the matching algorithms of commits to email discussions, based on earlier work of Yujuan Jiang during her PhD.
  • Kate Stewart. She has been instrumental to gather user requirements and to evaluate cregit and its views.
  • Isabella Ferreira. She is picking up where Alex left and continues to improve the matching of commits to emails.

This article was written by Daniel German (dmg@turingmachine.org) and originally appeared on GitHub.

How to Install fail2ban on Ubuntu Server 18.04

If you’re looking to secure your Ubuntu Server, one of the first things you should do is install the fail2ban intrusion detection system. What fail2ban does is monitor specific log files (in /var/log) for failed login attempts or automated attacks on your server. When an attempted compromise is discovered from an IP address, fail2ban then blocks the IP address (by adding a new chain to iptables) from gaining entry (or attempting to further attack) the server.

Believe it or not, fail2ban is so easy to install and use, it should be considered a no-brainer for all Linux servers.

I want to walk you through the process of installing fail2ban on Ubuntu Server 18.04. I’ll then show you how to add a jail to monitor for failed SSH login attempts.

Read more at TechRepublic

Linus Torvalds: After Big Linux Performance Hit, Spectre v2 Patch Needs Curbs

Major slowdowns caused by the new Linux 4.20 kernel have been traced to a mitigation for Spectre variant 2 that Linux founder Linus Torvalds now wants restricted.

As noted by Linux news site Phoronix, the sudden slowdowns have been caused by a newly implemented mitigation called Single Thread Indirect Branch Predictors (STIBP), which is on by default in the Linux 4.20 kernel for Intel systems with up-to-date microcode.

STIBP is one of three possible mitigations Intel added to its firmware updates in response to the Spectre v2 attacks. Others included Indirect Branch Restricted Speculation (IBRS), and Indirect Branch Predictor Barrier (IBPB), which could be enabled by operating-system makers.

Read more at ZDNet

Get Cyber Monday Savings on Linux Foundation Training and Certification

It’s time for our biggest sale of the year. The Linux Foundation’s annual Cyber Monday event means you can get trained and get certified at a huge discount.

And, you’ll get a free T-shirt with every purchase!

Through the limited-time Cyber Monday training sale, we’re offering prep course and certification exam bundles for just $179.

This offer includes the prep course and exam for the following certification options:

  • Linux Foundation Certified SysAdmin (LFCS) This training is ideal for candidates looking to validate their Linux system administration skill set.

  • Linux Foundation Certified Engineer (LFCE) This option is designed for the Linux engineer looking to demonstrate a more advanced level of Linux administration and engineering skill.

  • Cloud Foundry Certified Developer (CFCD)This program will verify your expertise in using the Cloud Foundry platform and building cloud-native applications

  • Certified Kubernetes Administrator (CKA)This program assures you have the skills and knowledge to perform the responsibilities of Kubernetes administrator.

  • Certified Kubernetes Application Developer (CKAD) This option certifies that you can design, build, configure, and expose cloud native applications for Kubernetes.

  • Certified OpenStack Administrator (COA) This program provides essential OpenStack and cloud infrastructure skills.

Sign up now to take advantage of this special training offer from The Linux Foundation.


Taming the Rate of Change

Change frequency is an indicator of time to create business value. In order to create value in a given amount of time, you need to be able to release your code a certain number of times and learn from those changes. The less frequently you release, the longer it can take to create value. Increase in rate of change shows that you’re reducing the time to create value, thus increasing team performance. Conversely, low change frequency indicates high time to create value and low team performance.

As the 2018 State of DevOps report says,

Those that develop and deliver quickly are better able to experiment with ways to increase customer adoption and satisfaction, pivot when necessary, and keep up with compliance and regulatory demands.

However, change frequency alone is not a sufficient measure of team performance. As the same State of DevOps report aptly captures, production stability is an equally important measure of team performance. What good is high change frequency if the production environment is falling apart often for long periods of time? 

Read more at Medium

Why Should You Use Microservices and Containers?

What to expect when you’re working with microservices and containers.

First of all, what are microservices? Microservices is a type of architecture that splits your application into multiple services that does a fine-grained function that’s a part of your application as a whole. Each of your microservices will have a different logical function for your application. Microservices is a more modern approach in an application’s architecture compared to a monolithic architecture where all your application’s components and functions are in a single instance. You can refer to a comparison of a monolithic to a microservices architecture on the diagram below.

Monoliths vs microservices

Read more at IBM Developer

The alias And unalias Commands Explained With Examples

You may forget the complex and lengthy Linux commands after certain period of time unless you’re a heavy command line user. Sure, there are a few ways to recall the forgotten commands. You could simply save the frequently used commands and use them on demand. Also, you can bookmark the important commands in your Terminal and use whenever you want. And, of course there is already a built-in “history” command available to help you to remember the commands. Another easiest way to remember such long commands is to simply create an alias (shortcut) to them. Not just long commands, you can create alias to any frequently used Linux commands for easier repeated invocation. By this approach, you don’t need to memorize those commands anymore. In this guide, we are going to learn about alias and unalias commands with examples in Linux.

The alias command

The alias command is used to run any command or set of commands (inclusive of many options, arguments) with a user-defined string. The string could be a simple name or abbreviations for the commands regardless of how complex the original commands are. You can use the aliases as the way you use the normal Linux commands. The alias command comes preinstalled in shells, including BASH, Csh, Ksh and Zsh etc.

Read more at OS Technix

Three SSH GUI Tools for Linux

At some point in your career as a Linux administrator, you’re going to use Secure Shell (SSH) to remote into a Linux server or desktop. Chances are, you already have. In some instances, you’ll be SSH’ing into multiple Linux servers at once. In fact, Secure Shell might well be one of the most-used tools in your Linux toolbox. Because of this, you’ll want to make the experience as efficient as possible. For many admins, nothing is as efficient as the command line. However, there are users out there who do prefer a GUI tool, especially when working from a desktop machine to remote into and work on a server.

If you happen to prefer a good GUI tool, you’ll be happy to know there are a couple of outstanding graphical tools for SSH on Linux. Couple that with a unique terminal window that allows you to remote into multiple machines from the same window, and you have everything you need to work efficiently. Let’s take a look at these three tools and find out if one (or more) of them is perfectly apt to meet your needs.

I’ll be demonstrating these tools on Elementary OS, but they are all available for most major distributions.

PuTTY

Anyone that’s been around long enough knows about PuTTY. In fact, PuTTY is the de facto standard tool for connecting, via SSH, to Linux servers from the Windows environment. But PuTTY isn’t just for Windows. In fact, from withing the standard repositories, PuTTY can also be installed on Linux. PuTTY’s feature list includes:

  • Saved sessions.

  • Connect via IP address or hostname.

  • Define alternative SSH port.

  • Connection type definition.

  • Logging.

  • Options for keyboard, bell, appearance, connection, and more.

  • Local and remote tunnel configuration

  • Proxy support

  • X11 tunneling support

The PuTTY GUI is mostly a way to save SSH sessions, so it’s easier to manage all of those various Linux servers and desktops you need to constantly remote into and out of. Once you’ve connected, from PuTTY to the Linux server, you will have a terminal window in which to work. At this point, you may be asking yourself, why not just work from the terminal window? For some, the convenience of saving sessions does make PuTTY worth using.

Installing PuTTY on Linux is simple. For example, you could issue the command on a Debian-based distribution:

sudo apt-get install -y putty

Once installed, you can either run the PuTTY GUI from your desktop menu or issue the command putty. In the PuTTY Configuration window (Figure 1), type the hostname or IP address in the HostName (or IP address) section, configure the port (if not the default 22), select SSH from the connection type, and click Open.

Figure 1: The PuTTY Connection Configuration Window.

Once the connection is made, you’ll then be prompted for the user credentials on the remote server (Figure 2).

Figure 2: Logging into a remote server with PuTTY.

To save a session (so you don’t have to always type the remote server information), fill out the IP address (or hostname), configure the port and connection type, and then (before you click Open), type a name for the connection in the top text area of the Saved Sessions section, and click Save. This will then save the configuration for the session. To then connect to a saved session, select it from the saved sessions window, click Load, and then click Open. You should then be prompted for the remote credentials on the remote server.

EasySSH

Although EasySSH doesn’t offer the amount of configuration options found in PuTTY, it’s (as the name implies) incredibly easy to use. One of the best features of EasySSH is that it offers a tabbed interface, so you can have multiple SSH connections open and quickly switch between them. Other EasySSH features include:

  • Groups (so you can group tabs for an even more efficient experience).

  • Username/password save.

  • Appearance options.

  • Local and remote tunnel support.

Install EasySSH on a Linux desktop is simple, as the app can be installed via flatpak (which does mean you must have Flatpak installed on your system). Once flatpak is installed, add EasySSH with the commands:

sudo flatpak remote-add --if-not-exists flathub https://flathub.org/repo/flathub.flatpakrepo

sudo flatpak install flathub com.github.muriloventuroso.easyssh

Run EasySSH with the command:

flatpak run com.github.muriloventuroso.easyssh

The EasySSH app will open, where you can click the + button in the upper left corner. In the resulting window (Figure 3), configure your SSH connection as required.

Figure 3: Adding a connection in EasySSH is simple.

Once you’ve added the connection, it will appear in the left navigation of the main window (Figure 4).

Figure 4: The EasySSH main window.

To connect to a remote server in EasySSH, select it from the left navigation and then click the Connect button (Figure 5).

Figure 5: Connecting to a remote server with EasySSH.

The one caveat with EasySSH is that you must save the username and password in the connection configuration (otherwise the connection will fail). This means anyone with access to the desktop running EasySSH can remote into your servers without knowing the passwords. Because of this, you must always remember to lock your desktop screen any time you are away (and make sure to use a strong password). The last thing you want is to have a server vulnerable to unwanted logins.

Terminator

Terminator is not actually an SSH GUI. Instead, Terminator functions as a single window that allows you to run multiple terminals (and even groups of terminals) at once. Effectively you can open Terminator, split the window vertical and horizontally (until you have all the terminals you want), and then connect to all of your remote Linux servers by way of the standard SSH command (Figure 6).

Figure 6: Terminator split into three different windows, each connecting to a different Linux server.

To install Terminator, issue a command like:

sudo apt-get install -y terminator

Once installed, open the tool either from your desktop menu or from the command terminator. With the window opened, you can right-click inside Terminator and select either Split Horizontally or Split Vertically. Continue splitting the terminal until you have exactly the number of terminals you need, and then start remoting into those servers.
The caveat to using Terminator is that it is not a standard SSH GUI tool, in that it won’t save your sessions or give you quick access to those servers. In other words, you will always have to manually log into your remote Linux servers. However, being able to see your remote Secure Shell sessions side by side does make administering multiple remote machines quite a bit easier.

Few (But Worthwhile) Options

There aren’t a lot of SSH GUI tools available for Linux. Why? Because most administrators prefer to simply open a terminal window and use the standard command-line tools to remotely access their servers. However, if you have a need for a GUI tool, you have two solid options and one terminal that makes logging into multiple machines slightly easier. Although there are only a few options for those looking for an SSH GUI tool, those that are available are certainly worth your time. Give one of these a try and see for yourself.

Kubernetes in Production vs. Kubernetes in Development: 4 Myths

We recently cleared up some of the common misunderstandings people have about Kubernetes as they start experimenting with it. One of the biggest misunderstandings, though, deserves its own story: Running Kubernetes in production is pretty much the same as running Kubernetes in a dev or test environment.

Hint: It’s not.

“When it comes to Kubernetes, and containers and microservices in general, there’s a big gap between what it takes to run in the ‘lab’ and what it takes to run in full production,” says Ranga Rajagopalan, cofounder and CTO of Avi Networks. “It’s the difference between simply running, and running securely and reliably.”

There’s an important starting point in Rajagopalan’s comment: This isn’t just a Kubernetes issue, per se, but rather more widely applicable to containers and microservices. It is relatively “easy” to deploy a container; operating and scaling containers (and containerized microservices) in production is what introduces complexity.

Read more at Enteprisers

Dell XPS 13: The Best Linux Laptop of 2018

There’s this persistent fake news story that you can’t buy a computer with Linux pre-installed on it. It’s nonsense. Dell has been selling Ubuntu-Linux powered computers since 2007. What’s also true is that, Dell, like Linux-specific desktop companies such as System76, sells high-end systems like its Precision mobile workstations. At the top end of Dell’s Ubuntu Linux line, you’ll find the Dell XPS 13 Developer Edition laptops.

What makes it a “Developer Edition” besides the top-of-the-line hardware is its software configuration. CanonicalUbuntu‘s parent company, and Dell worked together to certify Ubuntu 18.04 LTS on the XPS 13 9370. This worked flawlessly on my review system.

Read more at ZDNet