Linux containers are gaining significant ground in the enterprise, which is not surprising, since they make so much sense in today’s business environment. With that said, container technology as we know it today is relatively new, and companies are still in the process of understanding the different ways in which containers can be leveraged.
In a nutshell, Linux containers enable companies to package up and isolate applications with all of the files necessary for each to run. This makes it easy to move containerized applications among environments while retaining their full functionality.
With the Internet of Things, the realms of embedded Linux and enterprise computing are increasingly intertwined, and serverless computing is the latest enterprise development paradigm that device developers should tune into. This event-driven variation on Platforms-as-a-Service (PaaS) can ease application development using ephemeral Docker containers, auto-scaling, and pay-per execution in the cloud. Serverless is seeing growing traction in enterprise applications that need fast deployment and don’t require extremely high performance or low latency, including many cloud-connected IoT applications.
At the recent Embedded Linux Conference, IBM IoT/Mobile software engineer Kalonji Bankole and IBM Cloud & Watson developer Prashant Khanal detailed Big Blue’s spin on serverless, called IBM Bluemix OpenWhisk. Their presentation — built around a demo of a DIY, voice-enabled Raspberry Pi home automation gizmo that activates a WeMo smart light switch — shows how OpenWhisk integrates with IBM Watson, and discusses Watson interactions with MQTT and IFTTT (see video below).
Like commercial serverless frameworks such as Amazon’s AWS Lambda, Microsoft’s Azure Functions, and Google Functions, the open source OpenWhisk provides a “function as a service” approach to app development. The most immediate benefit of serverless is that it frees developers from the hassles of managing a server.
The term serverless is something of a misnomer, as there are still servers processing the code. However, the developer doesn’t need to worry about it.
“Serverless saves you from spending all your time firefighting and fixing a lot of DevOps issues like dealing with crashes, scaling, updates, and networking issues,” said Bankole, who covered the serverless part of the presentation. “Instead you can just focus on your code.”
PaaS platforms such as Cloud Foundry and Heroku promise something similar, but with a key difference. “PaaS platforms can also handle all the dependencies, scaling, and hosting, but once the application is deployed, it’s always up and waiting for requests — and charging your account for that uptime,” said Bankole. “By contrast, serverless allows us to spin up portions of an application on demand in an ephemeral Docker container, and the contents are deleted when you’re done. This supports a microservices approach where you only get charged based on when the code is running.”
With serverless platforms, the developer writes a series of stateless decoupled functions and uploads them to a serverless engine. “The function can then be called by an HTTP request or a change in a service such as a database or social networking service,” said Bankole.
OpenWhisk, which is also available as Apache OpenWhisk, is currently the only open source serverless platform, said Bankole. “That means you can run it at home or in your own data center,” he added. The modular, event-driven framework makes it easier for teams to work on different pieces of code simultaneously and to dynamically respond to the rapid scaling that is typical of many mobile end-user scenarios.
OpenWhisk comprises triggers, actions, rules, and packages, which are combined as services. Developers associate actions to handle events via rules, and packages are used to bundle and distribute sets of actions. All these components can be published publicly or privately.
Triggers “define which events OpenWhisk should pay attention to,” said Bankole. “They can be a web hook, changes to a database, incoming tweets, or a change of hash tags to social media account. Triggers can be data coming in from IoT devices or messages coming in to specific MQTT channels.”
The logic that responds to the triggers is called an action. These snippets of code, which can also be considered as “functions,” are “uploaded to the OpenWhisk action pool,” explained Bankole. OpenWhisk currently supports Node.js, Python, and Apple’s Swift, which Bankole singled out for praise. Other platforms will be added in the future.
Actions are executed in Docker containers, and the results are returned to the user. They can also be forwarded to other actions in a process called chaining. “This lets you reuse pieces of code and combine them in different sequences,” said Bankole.
Rules define a relationship between triggers and actions. A single trigger can set off multiple actions, or a single action can be triggered by multiple rules. This flexibility is well suited to IoT applications, such as home automation and security. For example, a rule can be set up so that when a trigger goes off based on a sensor, the action sends out several alert texts. The trigger could also be set up to kick off multiple actions in parallel, such as locking doors, flashing lights, and activating a siren.
Each function presented to the system is run as a customized REST implant. This in turn initiates an HTTP request that can be emitted by any device with Internet connectivity.
As an alternative to HTTP/REST requests, you can use “feeds,” which monitor services such as a database or message bus like MQTT. “If a message comes in to a certain topic on a MQTT broker or a new record is added to a database, the action can be triggered in response,” said Bankole.
Watson, MQTT, and IFTTT
The OpenWhisk IoT demo integrated the IBM Watson cognitive SaaS platform. For the demo, Bankole and Khanal specifically tapped Watson’s speech-to-text and natural language classifier services. Joined together, these provide a voice agent technology much like that of Alexa or Google Assistant.
In the IoT demo, Watson’s natural language classifier interpreted the speech-to-text output to find the intent. “Watson can tell us what device the request is trying to control, and what kind of control command is being sent,” said Khanal. The speech-to-text service, which supports eight languages, uses either HTTP or WebSocket interfaces to transcribe speech.
Like other Watson cognitive services such as machine learning and visual recognition, these voice services are configurable to run on a customer’s training model. For example, once you train the natural language classifier, it can identify the classes from text, from which you can then determine intent. You can automate the training process with REST and CLI.
To communicate with various devices, Bankole and Khanal used the Watson IoT Platform, which is an MQTT broker for Watson. Watson can integrate with other MQTT brokers, as well.
“Watson IoT provides REST and real-time APIs, mostly to communicate with devices,” said Khanal. “But Watson IoT can also be extended to read and store the state and device events so you can add analytics.”
Khanal also explained how you could connect the serverless/Watson based application to other home automation and smart appliance devices using IFTTT (If This Then That). IFTTT “makes it easier to connect to the many IFTTT-registered services and devices already out there,” said Khanal.
IFTTT combines triggers and actions to control devices or web services. “If you receive a tweet that says shut down the fan, you can use that trigger to connect to vendor devices registered in IFTTT cloud,” said Khanal. “It’s easy to use IFTTT to extend your architecture to connect to devices like smart dishwashers and refrigerators.”
Connect with the Linux community at Open Source Summit North America on September 11-13. Linux.com readers can register now with the discount code, LINUXRD5, for 5% off the all-access attendee registration price. Register now to save over $300!
So, you want to stuff your Linux laptop or PC full of virtual machines and perform all manner of mad experiments. And so you shall, and a fine time you will have. Come with me and learn how to do this with KVM.
KVM, kernel-based virtual machine, was originally developed by Qumranet. Red Hat bought Qumranet in 2008, re-licensed KVM to the GPL, and then it became part of the mainline kernel. KVM is a type 2 hypervisor, which means it runs on a host operating system. VirtualBox and Hyper-V are type 2 hypervisors. In contrast, type 1 hypervisors run on the bare metal and don’t need host operating systems, like Xen and VMware ESX.
“Hypervisor” is a old term from the early days of computing. It has taken various meanings over the decades; I’m satisfied with thinking of it as a virtual machine manager that has control over hardware, hardware emulation, and the virtual machines.
Prerequisites
KVM runs unmodified guest operating systems, including Linux, Unix, Max OS X, and Windows. You need a CPU with virtualization support, and while it is unlikely that your CPU does not have this, it takes just a second to check.
vmx means Intel, and svm is AMD. That is a quad-core Intel CPU with eight logical cores, and it is ready to do the virtualization rock. (Intel Core i7-4770K 3.50GHz, a most satifying little powerhouse that handles everything I throw at it, including running great thundering herds of VMs.)
Download a few Linux .isos for creating virtual machines.
Create two new directories, one to hold your .isos, and one for your storage pools. You want a lot of disk space, so put these in your home directory to make testing easier, or any directory with a few hundred gigabytes of free space. In the following examples, my directories are ~/kvm-isos and ~/kvm-pool.
Installing KVM
Remember back in the olden days, when how-tos like this were bogged down with multiple installation instructions? We had to tell how to install from source code, from dependency-resolving package managers like apt and yum, and non-dependency-resolving package managers like RPM and dpkg. If we wanted to be thorough we included pkgtool, pacman, and various graphical installers.
Happy I am to not have to do that anymore. KVM on Ubuntu and CentOS 7 consists of qemu-kvm, libvirt-bin, virt-manager, and bridge-utils. openSUSE includes patterns-openSUSE_KVM_server, which installs everything, and on Fedora install virt-manager, libvirt, libvirt-python, and python-virtinst. You probably want to review the instructions for your particular flavor of Linux in case there are quirks or special steps to follow.
After installation, add yourself to the libvirt or libvirtd group, whichever one you have, and then log out and log back in. This allows you to run commands without root privileges. Then run this virsh command to check that the installation is successful:
$ virsh -c qemu:///system list
 Id Name                 State
--------------------------------
When you see this it’s ready to go to work.
Starting the Virtual Machine Manager
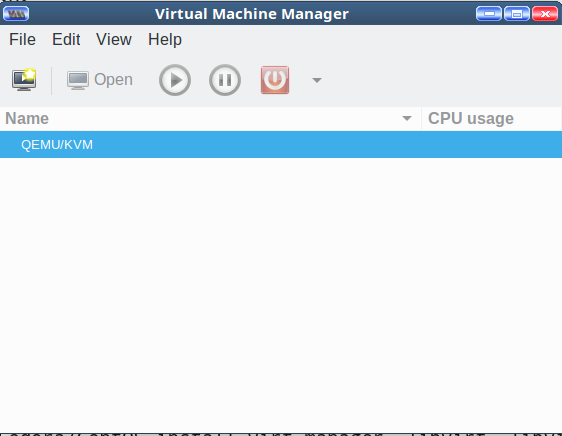
Look in your applications menu for Virtual Machine Manager and open it. In Ubuntu and openSUSE it’s under System. If you can’t find it then run the virt-manager command with no options. You will see something like Figure 1.
Figure 1: Virtual Machine Manager.
It’s not much to look at yet. Cruise through the menus, and double-click QEMU/KVM to start it, and to see the Connection Details window. Again, not much to see, just idle status monitors and various configuration tabs.
Create a Virtual Machine
Now create a new virtual machine with one of those .isos you downloaded. I’ll use Fedora 25.
Go to File > New Virtual Machine. You get a nice dialog that offers several choices for your source medium. Select Local Install Media (ISO image or CDROM), then click Forward.
On the next screen check Use ISO Image:, and click the Browse button. This opens the Choose Storage Volume screen. The default storage volume of around 24GB in /var/lib/libvirt/images is too small, so you want to use your nice new kvm-pool directory. The interface is a little confusing; first, you create your nice large kvm-pool in the left pane, and then create individual storage pools for your VMs in the right pane each time you create a new VM.
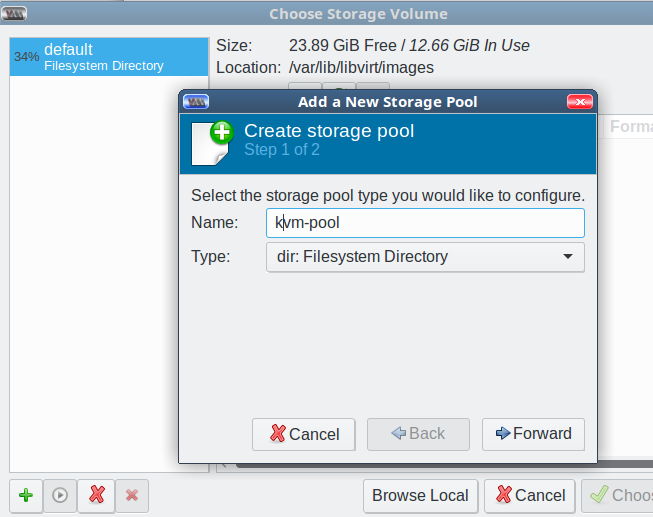
Start by clicking the green add button at the bottom left to add your new large storage pool. This opens the Add a New Storage Pool screen. Select the dir: Filesystem Directory type, type a name for your storage pool, and click Forward (Figure 2).
Figure 2: Create storage pool.
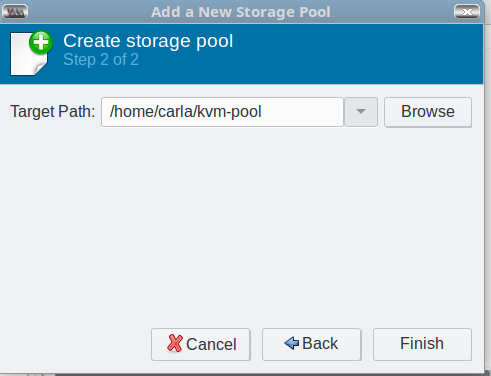
In the next screen, click the Browse button to browse to the pool directory you created back in the Prequisites section; this becomes the Target Path, and then click Finish (Figure 3).
Figure 3: Choose a target path.
Now you’re back at the Choose Storage Volume screen. You should see the default and your new storage pool in the left pane.
Click the Browse Local button at the bottom of the right pane to find the .iso you want to use. Select one and click Forward. This automatically adds your .iso directory to the left pane.
In the next screen, set your CPU and memory allocations, then click Forward. For Fedora I want two CPUs and 8096MB RAM.
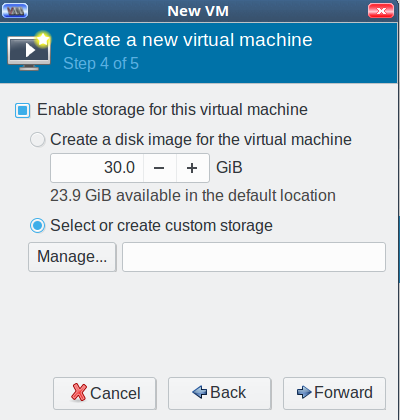
Click Forward, and enable storage for your new VM. Check Select or create custom storage, and click the Manage button (Figure 4).
Figure 4: Create new virtual machine.
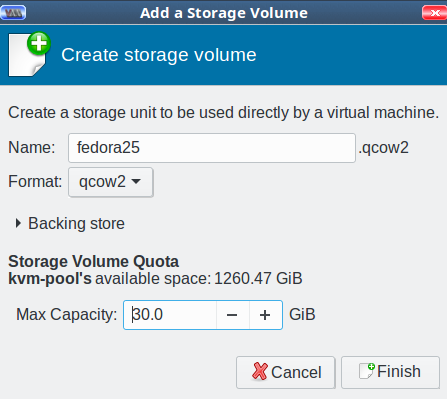
Now you’re back at the Choose Storage Volume screen. Click the green create new volume button next to Volumes in the right pane. Give your new storage volume a name and size, then click Finish (Figure 5). (We’ll get into the various format types later; for now go with qcow2.)
Figure 5: Name your storage volume.
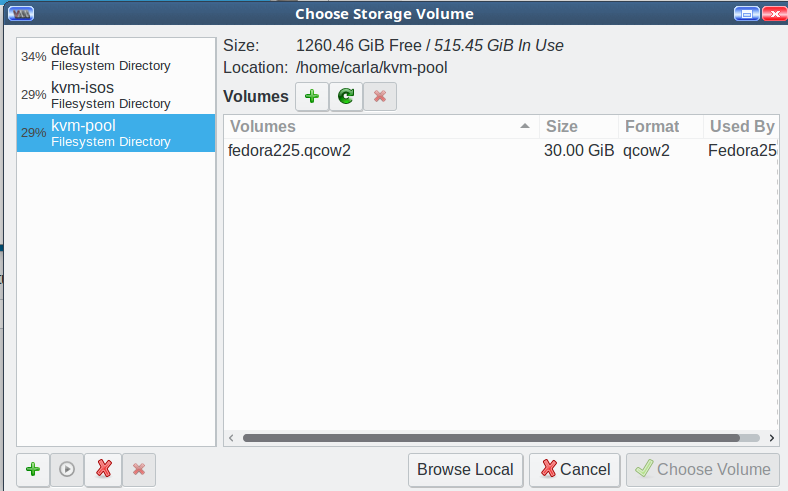
This brings you back to Choose Storage Volume. It should look like Figure 6.
Figure 6: Choose Storage Volume
Select your new storage pool, highlight your new storage volume, and click Choose Volume. Now you’re back at Step 4 of 5, Create a new virtual machine. Click Forward. In Step 5, type the name of your new VM, then click Finish and watch your new virtual machine start. As this is an installation .iso, the final step is to go through the usual installation steps to finish creating your VM.
When you create more VMs, the process will be more streamlined because you will use the .iso and storage pools you created on the first run. Don’t worry about getting things exactly right because you can delete everything and start over as many times as you want.
Come back next week to learn about networking and configurations.
Learn more about Linux through the free “Introduction to Linux” course from The Linux Foundation and edX.
Open-sourcing is more than throwing code over the wall and hoping somebody uses it. I knew this in theory, but being part of the TensorFlow team at Google has opened my eyes to how many different elements you need to build a community around a piece of software.
Community service
When a new project releases into the world, the sole experts on that project are the people who wrote it. They’re the only ones who can write documentation and answer questions, and they are most effective at improving the software. As a result, those of us on the core team of TensorFlow became the bottlenecks to growing our project: we couldn’t do everything at once.
With machine learning, big data, cloud, and networking functions virtualization (NFV) initiatives invading the data center, there are implications for data center networking performance.
Large cloud services providers such as Amazon, Google, Baidu, and Tencent have reinvented the way in which IT services can be delivered, with capabilities that go beyond scale in terms of sheer size to also include scale as it pertains to speed and agility. That’s put traditional carriers on notice: John Donovan, chief strategy officer and group president at AT&T technology and operations, for instance, said last year that AT&T wants to be the “most aggressive IT company in the world.” He noted that in a world where over-the-top (OTT) offerings have become commonplace, application and services development can no longer be defined by legacy processes.
“People that were suppliers are now competitors,” he said. “People that were competitors are now partners in areas such as open source development. The way the whole industry worked is changing. …”
Also, each of them is an immigrant to the U.S., child of an immigrant or a non-U.S. national.
“Linux, the largest cooperatively developed software project in history, is created by thousands of people from around the world and made available to anyone to use for free,” noted Jim Zemlin, the executive director of the Linux Foundation in a blog post earlier this year…
Let’s take a look at what the mainframe really is, and consider its use cases.
Mainframe Workloads
What do you use a mainframe for? Complex, data-intensive workloads, both batch and high-volume online transaction processing (OLTP). For example, banks do a lot of both. When customers access their accounts online that is OLTP. It is real-time and interactive. After hours banks typically run batch jobs: sending out customer statements, billing, daily totals, interest calculations, reminders, marketing emails, and reporting. This may mean processing terabytes of data in a short time, and that is what mainframes excel at. Health care, schools, government agencies, electric utilities, factory operations, enterprise resource planning, and delivering online entertainment are all good candidates for mainframes. The Internet of Things–PCs, laptops, smartphones, vehicles, security systems, “smart” appliances, and utility grids–are all well-served by mainframes.
On Thursday, June 1, The Linux Foundation will continue its series of Twitter chats entitled #AskLF featuring leaders at the organization. Previous chats were hosted by The Linux Foundation’s Arpit Joshipura, GM of Networking & Orchestration and Clyde Seepersad, Manager of Training and Certifications. June’s #AskLF host is CTO of Cloud Foundry Foundation, Chip Childers.
#AskLF, was created to broaden access to thought leaders, community organizers, and expertise within The Linux Foundation. While there are many opportunities to interact with staff at Linux Foundation global events, which bring together over 25,000 open source influencers, a live Twitter Q&A will give participants a direct line of communication to designated hosts.
Chip Childers, Cloud Foundry CTO.
Chip Childers is an open source and large-scale computing veteran, having spent 18 years in the field. He co-founded Cloud Foundry Foundation as Technology Chief of Staff in 2015, coming from a VP of Product Strategy role at Cumulogic. Before that, he was the inaugural VP of Apache Cloudstack while leading Enterprise Cloud Services at SunGard. Childers led the rebuild of pivotal applications for organizations such as IRS.gov, USMint.gov, and Merrill Lync.
What is the Cloud Foundry Foundation Developer Training and Certification Program and how do I get started?
Why do developers choose Cloud Foundry over other platforms and competitors?
How does The Cloud Foundry Foundation grow its community of contributors? How can I get involved?
What will I get out of attending Cloud Foundry Summit?
Here’s how you can participate in the first #AskLF:
Follow @linuxfoundation on Twitter: Hosts will take over The Linux Foundation’s account during the session.
Save the date: June 1, 2017 at 10 a.m. PT.
Use the hashtag #AskLF: To ask Childers your questions while he hosts, simply tweet it with the hashtag #AskLF on 6/1 between 10 am & 10:45 am PDT. We can’t guarantee that he will have time to answer every inquiry, but every attempt will be made!
Consider attending Open Networking Summit in Santa Clara next month: This #AskLF session will prepare you to engage in the topics at Cloud Foundry Summit and you’ll get a chance to hear Childers speak live. Click here for registration and schedule details.
More dates and details for future #AskLF sessions to come! We’ll see you on Twitter, June 1 at 10 a.m. PT.
*Note: Unlike Reddit-style AMAs, #AskLF is not focused around general topics that might pertain to the host’s personal life. To participate, please focus your questions around open source networking and Chip Childers’s career.
Google is not only one of the biggest contributors to the open source community but also has a strong track record of delivering open source tools and platforms that give birth to robust technology ecosystems. Just witness the momentum that Android and Kubernetes now have. Recently, Google launcheda new home for its open source projects, processes, and initiatives. The site runs deep and has several avenues worth investigating. Here is a tour and some highlights worth noting.
Will Norris, a software engineer at Google’s Open Source Programs Office,writes: “One of the tenets of our philosophy towards releasing open source code is that ‘more is better.’ We don’t know which projects will find an audience, so we help teams release code whenever possible. As a result, we have released thousands of projects under open source licenses ranging from larger products like TensorFlow, Go, and Kubernetes to smaller projects such as Light My Piano, Neuroglancer, and Periph.io. Some are fully supported while others are experimental or just for fun. With so many projects spread across 100 GitHub organizations and our self-hosted Git service, it can be difficult to see the scope and scale of our open source footprint.”
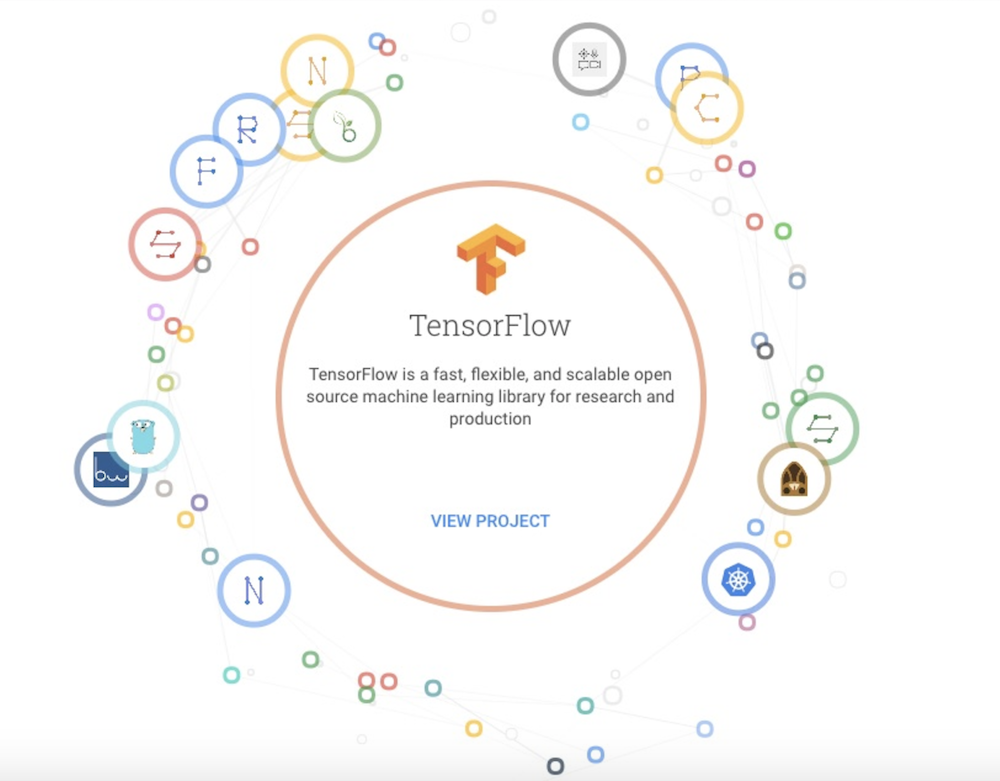
Projects.The newdirectory of open source projects, which is rapidly expanding, is one of the richest parts of the Google Open Source site. If you investigate many of the projects, you can find out how they are used at Google. A pull-down menu conveniently categorizes the many projects, so that you can investigate, for example, cloud, mobile or artificial intelligence tools. Animated graphics also shuffle between projects that you may not be aware of but might be interested in. Here is an example of one of these graphics:
Docs.One of the most compelling components of Google’s new home for all things open source is a section calledDocs, which is billed as “our internal documentation forhow we do open source at Google.” From open source contributors and developers to companies implementing open source programs, this section of Google’s site has a motherlode of tested and hardened information. There are three primary sections of the docs:
Creatingcovers how Google developers release code that they’ve written, either in the form of a new project or as a patch to an external project.
Usingexplains how Google brings open source code into the company and uses it. It delves into maintaining license compliance, and more.
Growingdescribes some of the programs Google runs inside and outside the company to support open source communities.
Blog.The Google Open Source site also includes a tab for theGoogle Open Source blog, which has steadily remained a good avenue for finding new tools and open source news. The site houses blog posts from people all around Google, and includes collections of links that can take you to other useful blogs, such as theGoogle Developers Blog and the officialGoogle Blog.
Community. Not only does Google run open outreach programs such as Google Summer of Code and Google Code-in, it also sponsors and contributes projects to organizations like the Apache Software Foundation. TheCommunity section on the Google Open Source site is dedicated to outreach programs and is also a good place to look in on if you want to get involved with Google’s programs. Here are just a few of thecommunity-centric affiliations Google has that you may not know about.
It’s no accident that Google is evolving and improving its home for all things open source. The company’s CEO Sundar Pichai came up at Google as chief of products, and helped drive the success of open source-centric tools ranging from Chrome to Android. Pichai knows that these tools have improved enormously as a result of community involvement. Now, more than ever, Google’s own success is tied to the success of open source.
Are you interested in how organizations are bootstrapping their own open source programs internally? You can learn more in the Fundamentals of Professional Open Source Management training course from The Linux Foundation. Download a sample chapter now.
Illustrating the huge diversity of topics covered at WWW, following yesterday’s look at recovering mobile user trajectories from aggregate data, today’s choice studies usage variation and pricing models in the public cloud. The basis for the study is data from ‘a major provider’s public cloud datacenters.’ Unless Google or Amazon are sending their data to three researchers from Microsoft, it’s a fair bet we’re looking at Azure.
Research in economics and operations management posits that dynamic pricing is critically important when capacity is fixed (at least in the short run) and fixed costs represent a substantial fraction of total costs.