Home Blog Page 572

Docker Tutorial — Getting Started with Python, Redis, and Nginx

What is Docker?

Docker is an open source tool that automates the deployment of the application inside software container. 
The easiest way to get the idea behind Docker is to compare it to, well… standard shipping containers.

Back in the days, transportation companies faced the following challenges:

  • How to transport different (incompatible) types of goods side by side (like food and chemicals or glass and bricks).
  • How to handle packages of the various sizes by the same vehicle.

With the introduction of containers, bricks can be put over glass, and chemicals can be stored next to food. Cargo of the various size can be put inside a standardized container that can be loaded/unloaded by the same vehicle.

Note: the code samples may be displayed improperly because of markdown. I recommend to continue reading the original article on our blog to make sure all the examples are displayed properly.

Let’s go back to containers in software development.

When you develop an application, you need to provide your code alongside with all possible dependencies like libraries, web server, databases, etc. You may end up in a situation when the application is working on your computer but won’t even start on stage server, dev or a QA’s machine.

This challenge can be addressed by isolating the app to make it independent of the system.

What is the difference from virtualization?

Traditionally virtual machines were used to avoid this unexpected behavior. The main problem with VM is that “extra OS” on top of the host operating system adds gigabytes of space to the project. Most of the time your server will host several VMs that will take even more space. And by the way, at the moment most cloud-based server providers will charge you for that extra space. Another significant drawback of VM is a slow boot.

Docker eliminates all the above by simply sharing OS kernel across all the containers that are running as separate processes of the host OS.

Keep in mind that Docker is not the first and not the only containerization platform. However, at the moment Docker is the biggest and the most powerful player on the market.

Why do we need Docker?

The list of benefits is the following:

  • Faster development process. There is no need to install 3rd parties like PostgreSQL, Redis, Elasticsearch. Those can be run in containers.
  • Handy application encapsulation (you can deliver your application in one piece).
  • Same behaviour on local machine / dev / stage / production servers.
  • Easy and clear monitoring.
  • Easy to scale (if you’ve done your application right it will be ready to scaling not only in Docker).

Supported platforms

Docker’s native platform is Linux, as it’s based on features provided by Linux kernel. However, you can still run it on macOS and Windows. The only difference is that on macOS and Windows Docker is encapsulated into a tiny virtual machine. At the moment Docker for macOS and Windows has reached a significant level of usability and feels more like a native app.

Moreover, there a lot of supplementary apps such as 
Kitematic or Docker Machine which help to install and operate Docker on non Linux platforms.

Installation

You can check the installation instructions here
If you’re running Docker on Linux you need to run all the following commands as root or you can add your user to docker group and re-login:

sudo usermod -aG docker $(whoami)  

Terminology

  • Container — running instance that encapsulates required software. Containers are always created from images. 
    Container can expose ports and volumes to interact with other containers or/and outer world. 
    Container can be easily killed / removed and re-created again in a very short time.

  • Image — basic element for every container. When you create an image every step is cached and can be reused (Copy On Write model). Depending on the image it can take some time to build it. Containers, on the other hand can be started from images right away.

  • Port — a TCP/UDP port in its original meaning. To keep things simple let’s assume that ports can be exposed to the outer world (accessible from host OS) or connected to other containers — accessible only from those containers and invisible to the outer world.

  • Volume — can be described as a shared folder. Volumes are initialized when a container is created. Volumes are designed to persist data, independent of the container’s lifecycle.

  • Registry — the server that stores Docker images. It can be compared to Github — you can pull an image from the registry to deploy it locally, and you can push locally built images to the registry.

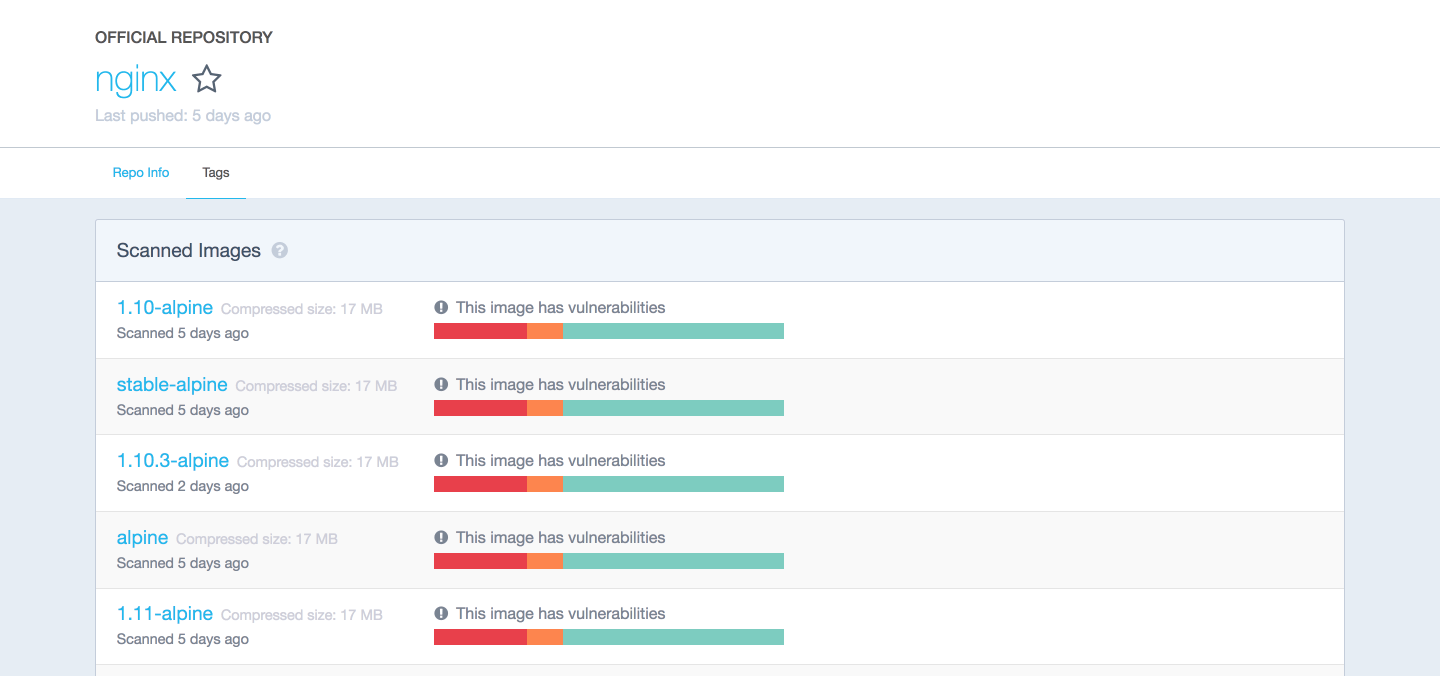
  • Docker hub — a registry with web-interface provided by Docker Inc. It stores a lot of Docker images with different software. Docker hub is a source of the “official” Docker images made by Docker team or made in cooperation with the original software manufacturer (it doesn’t necessary mean that these “original” images are from official software manufacturers). Official images list their potential vulnerabilities. This information is available for any logged in user. There are both free and paid accounts available. You can have one private image per account and an infinite amount of public images for free.

Example 1: hello world

It’s time to run your first container:

docker run ubuntu /bin/echo 'Hello world'  

Console output:

Unable to find image 'ubuntu:latest' locally  
latest: Pulling from library/ubuntu  
d54efb8db41d: Pull complete  
f8b845f45a87: Pull complete  
e8db7bf7c39f: Pull complete  
9654c40e9079: Pull complete  
6d9ef359eaaa: Pull complete  
Digest: sha256:dd7808d8792c9841d0b460122f1acf0a2dd1f56404f8d1e56298048885e45535  
Status: Downloaded newer image for ubuntu:latest  
Hello world  
  • docker run is a command to run a container.
  • ubuntu is the image you run, for example, the Ubuntu operating system image. When you specify an image, Docker looks first for the image on your Docker host. If the image does not exist locally, then the image is pulled from the public image registry — Docker Hub.
  • /bin/echo ‘Hello world’ is the command that will run inside a new container. This container simply prints Hello world and stops the execution.

Let’s try to create an interactive shell inside Docker container:

docker run -i -t --rm ubuntu /bin/bash  
  • -t flag assigns a pseudo-tty or terminal inside the new container.
  • -i flag allows you to make an interactive connection by grabbing the standard input (STDIN) of the container.
  • –rm flag to automatically remove the container when the process exits. By default, containers are not deleted. This container exists until we keep the shell session and terminates when we exit from the session (like SSH session to a remote server).

If you want to keep container running after the end of the session, you need to daemonize it:

docker run --name daemon -d ubuntu /bin/sh -c "while true; do echo hello world; sleep 1; done"  
  • –name daemon assigns daemon name to a new container. If you don’t specify a name explicitly, Docker will generate and assign it automatically.
  • -d flag runs the container in the background (daemonize it).

Let’s see what containers we have at the moment:

docker ps -a  

Console output:

CONTAINER ID  IMAGE   COMMAND                 CREATED             STATUS                         PORTS  NAMES  
1fc8cee64ec2  ubuntu  "/bin/sh -c 'while..."  32 seconds ago      Up 30 seconds                         daemon  
c006f1a02edf  ubuntu  "/bin/echo 'Hello ..."  About a minute ago  Exited (0) About a minute ago         gifted_nobel  
  • docker ps is a command to list containers.
  • -a shows all containers (without -a flag ps will show only running containers).

The ps shows us that we have two containers:

  • gifted_nobel (name for this container was generated automatically – it will be different on your machine) – it’s the first container we’ve created which printed ‘Hello world’ once.
  • daemon — it’s the third container we’ve created which runs as a daemon.

Note: there is no second container (the one with interactive shell) because we set –rm option. As a result, this container is automatically deleted right after execution.

Let’s check the logs and see what daemon container is doing right now:

docker logs -f daemon  

Console output:

...
hello world  
hello world  
hello world  
  • docker logs fetches the logs of a container.
  • -f flag to follow the log output (works actually like tail -f).

Now let’s stop daemon container:

docker stop daemon  

Let’s make sure that the container has stopped.

docker ps -a  

Console output:

CONTAINER ID  IMAGE   COMMAND                 CREATED        STATUS                      PORTS  NAMES  
1fc8cee64ec2  ubuntu  "/bin/sh -c 'while..."  5 minutes ago  Exited (137) 5 seconds ago         daemon  
c006f1a02edf  ubuntu  "/bin/echo 'Hello ..."  6 minutes ago  Exited (0) 6 minutes ago           gifted_nobel  

The container is stopped. We can start it again:

docker start daemon  

Let’s ensure that it is running:

docker ps -a  

Console output:

CONTAINER ID  IMAGE   COMMAND                 CREATED        STATUS                    PORTS  NAMES  
1fc8cee64ec2  ubuntu  "/bin/sh -c 'while..."  5 minutes ago  Up 3 seconds                     daemon  
c006f1a02edf  ubuntu  "/bin/echo 'Hello ..."  6 minutes ago  Exited (0) 7 minutes ago         gifted_nobel  

Now let’s stop it again and remove all the containers manually:

docker stop daemon  
docker rm <your first container name>  
docker rm daemon  

To remove all containers we can use the following command:

docker rm -f $(docker ps -aq)  
  • docker rm is command to remove container.
  • -f flag (for rm) is to stop container if it’s running (force deletion).
  • -q flag (for ps) is to print only container IDs.

Example 2: Nginx

Starting from this example you’ll need several additional files you can find on my GitHub repo
You can clone my repo or simply use the following link to download the sample files.

It is time to create and run more meaningful container like Nginx.

Change the directory to examples/nginx.

docker run -d --name test-nginx -p 80:80 -v $(pwd):/usr/share/nginx/html:ro nginx:latest  

Console output:

Unable to find image 'nginx:latest' locally  
latest: Pulling from library/nginx  
693502eb7dfb: Pull complete  
6decb850d2bc: Pull complete  
c3e19f087ed6: Pull complete  
Digest: sha256:52a189e49c0c797cfc5cbfe578c68c225d160fb13a42954144b29af3fe4fe335  
Status: Downloaded newer image for nginx:latest  
436a602273b0ca687c61cc843ab28163c720a1810b09005a36ea06f005b0c971  
  • -p is a ports mapping HOST PORT:CONTAINER PORT.
  • -v is a volume mounting HOST DIRECTORY:CONTAINER DIRECTORY.

Important: run command accepts only absolute paths. In our example we’ve used $(pwd) to set current directory absolute path.

Now you can check this url in your web browser.

We can try to change /example/nginx/index.html (which is mounted as a volume to/usr/share/nginx/html directory inside the container) and refresh the page.

Let’s get the information about test-nginx container:

docker inspect test-nginx  

This command displays system wide information about the Docker installation. This information includes the kernel version, number of containers and images, exposed ports, mounted volumes, etc.

Example 3: writing Dockerfile

To build a Docker image you need to create a Dockerfile. It is a plain text file with instructions and arguments. Here is the description of the instructions we’re going to use in our next example:

  • FROM — set base image
  • RUN — execute command in container
  • ENV — set environment variable
  • WORKDIR — set working directory
  • VOLUME — create mount-point for a volume
  • CMD — set executable for container

You can check Dockerfile reference for more details.

Let’s create an image that will get the contents of the website with curl and store it to the text file. We need to pass website url via environment variable SITE_URL. Resulting file will be placed in a directory mounted as a volume.

FROM ubuntu:latest  
RUN apt-get update  
RUN apt-get install --no-install-recommends --no-install-suggests -y curl  
ENV SITE_URL https://google.com/  
WORKDIR /data  
VOLUME /data  
CMD sh -c "curl -L $SITE_URL > /data/results"

Dockerfile is ready, it’s time to build the actual image.

Go to examples/curl and execute the following command to build an image:

docker build . -t test-curl  

Console output:

Sending build context to Docker daemon 3.584 kB  
Step 1/7 : FROM ubuntu:latest  
 ---> 0ef2e08ed3fa
Step 2/7 : RUN apt-get update  
 ---> Running in 4aa839bb46ec
Get:1 http://archive.ubuntu.com/ubuntu xenial InRelease [247 kB]  
Get:2 http://archive.ubuntu.com/ubuntu xenial-updates InRelease [102 kB]  
...
Fetched 24.9 MB in 4s (5208 kB/s)  
Reading package lists...  
 ---> 35ac5017c794
Removing intermediate container 4aa839bb46ec  
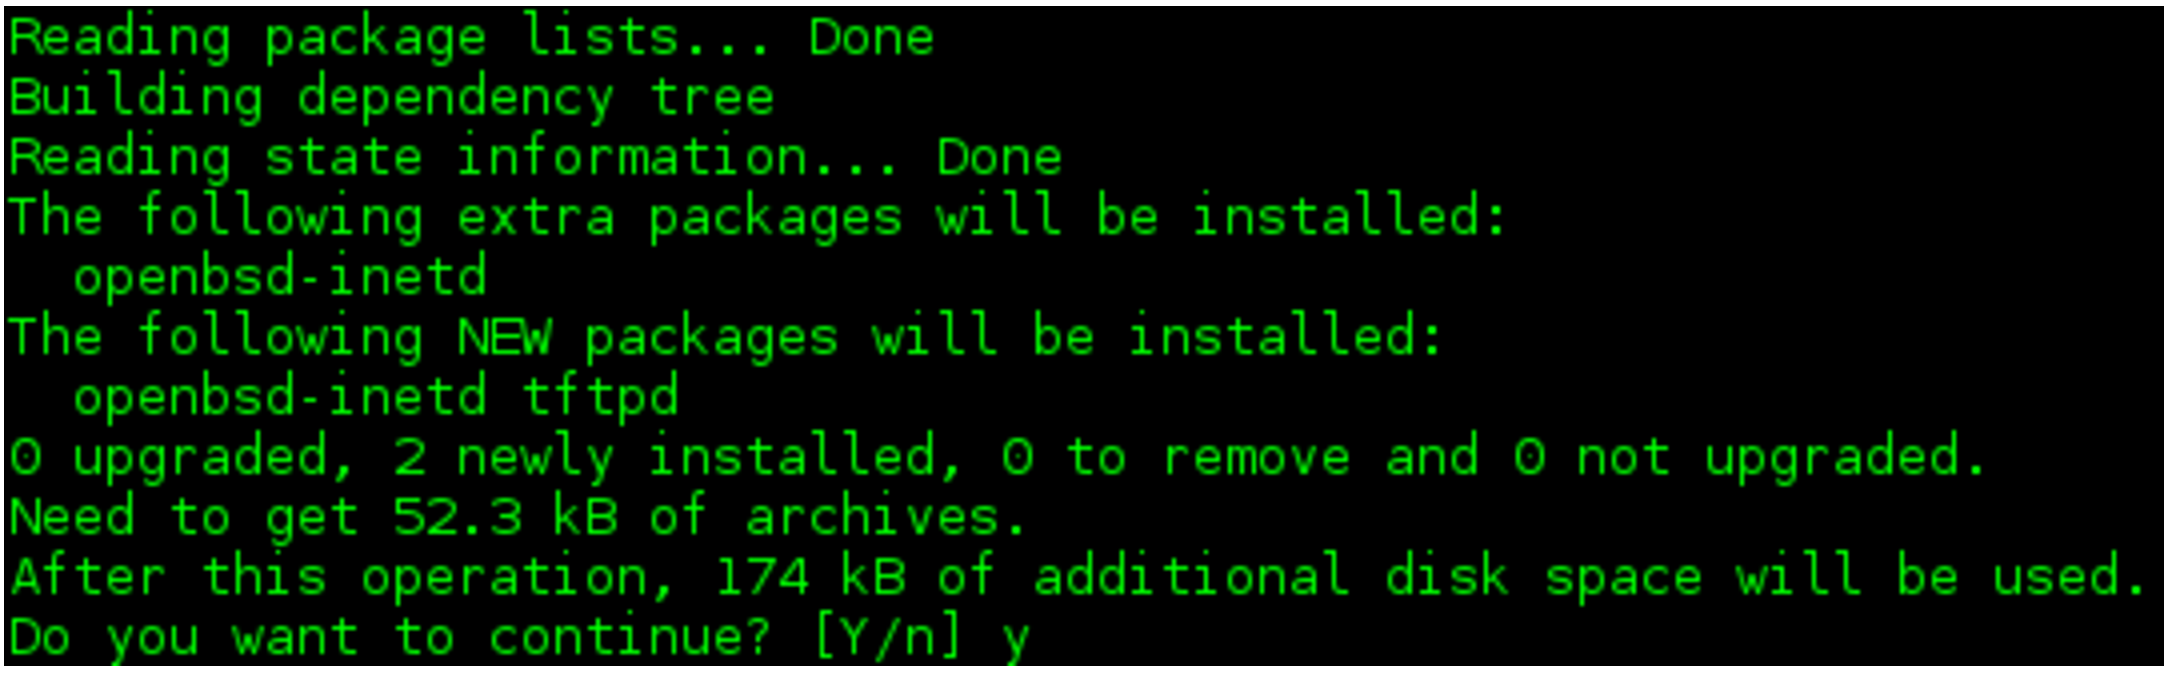
Step 3/7 : RUN apt-get install --no-install-recommends --no-install-suggests -y curl  
 ---> Running in 3ca9384ecf8d
Reading package lists...  
Building dependency tree...  
Reading state information...  
The following additional packages will be installed...  
 ---> f3c6d26b95e6
Removing intermediate container 3ca9384ecf8d  
Step 4/7 : ENV SITE_URL https://google.com/  
 ---> Running in 21b0022b260f
 ---> 9a733ee39a46
Removing intermediate container 21b0022b260f  
Step 5/7 : WORKDIR /data  
 ---> c024301ddfb8
Removing intermediate container 3bc973e5584c  
Step 6/7 : VOLUME /data  
 ---> Running in a9594a8958fe
 ---> 6802707a7114
Removing intermediate container a9594a8958fe  
Step 7/7 : CMD sh -c "curl -L $SITE_URL > /data/results"  
 ---> Running in 37503bc4e386
 ---> 5ebb2a65d771
Removing intermediate container 37503bc4e386  
Successfully built 5ebb2a65d771  
  • docker build builds a new image locally.
  • -t flag sets the name tag to an image.

Now we have the new image and we can see it in the list of existing images:

docker images  

Console output:

REPOSITORY  TAG     IMAGE ID      CREATED         SIZE  
test-curl   latest  5ebb2a65d771  37 minutes ago  180 MB  
nginx       latest  6b914bbcb89e  7 days ago      182 MB  
ubuntu      latest  0ef2e08ed3fa  8 days ago      130 MB  

We can create and run container from the image. Let’s try it with default parameters:

docker run --rm -v $(pwd)/vol:/data/:rw test-curl  

To see results saved to file run:

cat ./vol/results  

Let’s try with facebook.com:

docker run --rm -e SITE_URL=https://facebook.com/ -v $(pwd)/vol:/data/:rw test-curl  

To see results saved to file run:

cat ./vol/results  

Best practices of creating images

  • Include only necessary context — use a .dockerignore file (like .gitignore in git)
  • Avoid installing unnecessary packages — it will consume extra disk space
  • Use cache. Add context which changes a lot (for example source code of your project) at the end of Dockerfile — it will utilize Docker cache effectively.
  • Be careful with volumes. You should remember what data is in volumes. Because volumes are persistent and don’t die with the containers – next container will use data from volume which was created by previous container.
  • Use environment variables (in RUN, EXPOSE, VOLUME). It will make your Dockerfile more flexible.

Connection between containers

Docker compose — is the only right way to connect containers with each other.

Example 4: docker-compose Python + Redis

In this example, I am going to connect Python and Redis containers.

version: '2'  
services:  
  app:
    build:
      context: ./app
    depends_on:
      - redis
    environment:
      - REDIS_HOST=redis
    ports:
      - "5000:5000"
  redis:
    image: redis:3.2-alpine
    volumes:
      - redis_data:/data
volumes:  
  redis_data:

Go to examples/compose and execute the following command:

docker-compose --project-name app-test -f docker-compose.yml up  

Console output:

Creating network "apptest_default" with the default driver  
Creating volume "apptest_redis_data" with default driver  
Pulling redis (redis:3.2-alpine)...  
3.2-alpine: Pulling from library/redis  
627beaf3eaaf: Pull complete  
a503a4771a4a: Pull complete  
72c5d910c683: Pull complete  
6aadd3a49c30: Pull complete  
adf925aa1ad1: Pull complete  
0565da0f872e: Pull complete  
Digest: sha256:9cd405cd1ec1410eaab064a1383d0d8854d1eef74a54e1e4a92fb4ec7bdc3ee7  
Status: Downloaded newer image for redis:3.2-alpine  
Building app  
Step 1/9 : FROM python:3.5.2-alpine  
3.5.2-alpine: Pulling from library/python  
b7f33cc0b48e: Pull complete  
8eda8bb6fee4: Pull complete  
4613e2ad30ef: Pull complete  
f344c00ca799: Pull complete  
Digest: sha256:8efcb12747ff958de32b32424813708f949c472ae48ca28691078475b3373e7c  
Status: Downloaded newer image for python:3.5.2-alpine  
 ---> e70a322afafb
Step 2/9 : ENV BIND_PORT 5000  
 ---> Running in 8518936700b3
 ---> 0f652cdd2cee
Removing intermediate container 8518936700b3  
Step 3/9 : ENV REDIS_HOST localhost  
 ---> Running in 027286e90699
 ---> 6da3674f79fa
Removing intermediate container 027286e90699  
Step 4/9 : ENV REDIS_PORT 6379  
 ---> Running in 0ef17cb512ed
 ---> c4c514aa3008
Removing intermediate container 0ef17cb512ed  
Step 5/9 : COPY ./requirements.txt /requirements.txt  
 ---> fd523d64faae
Removing intermediate container 8c94c82e0aa8  
Step 6/9 : COPY ./app.py /app.py  
 ---> be61f59b3cd5
Removing intermediate container 93e38cd0b487  
Step 7/9 : RUN pip install -r /requirements.txt  
 ---> Running in 49aabce07bbd
Collecting flask==0.12 (from -r /requirements.txt (line 1))  
  Downloading Flask-0.12-py2.py3-none-any.whl (82kB)
Collecting redis==2.10.5 (from -r /requirements.txt (line 2))  
  Downloading redis-2.10.5-py2.py3-none-any.whl (60kB)
Collecting itsdangerous>=0.21 (from flask==0.12->-r /requirements.txt (line 1))  
  Downloading itsdangerous-0.24.tar.gz (46kB)
Collecting Werkzeug>=0.7 (from flask==0.12->-r /requirements.txt (line 1))  
  Downloading Werkzeug-0.11.15-py2.py3-none-any.whl (307kB)
Collecting Jinja2>=2.4 (from flask==0.12->-r /requirements.txt (line 1))  
  Downloading Jinja2-2.9.5-py2.py3-none-any.whl (340kB)
Collecting click>=2.0 (from flask==0.12->-r /requirements.txt (line 1))  
  Downloading click-6.7-py2.py3-none-any.whl (71kB)
Collecting MarkupSafe>=0.23 (from Jinja2>=2.4->flask==0.12->-r /requirements.txt (line 1))  
  Downloading MarkupSafe-1.0.tar.gz
Installing collected packages: itsdangerous, Werkzeug, MarkupSafe, Jinja2, click, flask, redis  
  Running setup.py install for itsdangerous: started
    Running setup.py install for itsdangerous: finished with status 'done'
  Running setup.py install for MarkupSafe: started
    Running setup.py install for MarkupSafe: finished with status 'done'
Successfully installed Jinja2-2.9.5 MarkupSafe-1.0 Werkzeug-0.11.15 click-6.7 flask-0.12 itsdangerous-0.24 redis-2.10.5  
 ---> 18c5d1bc8804
Removing intermediate container 49aabce07bbd  
Step 8/9 : EXPOSE $BIND_PORT  
 ---> Running in f277fa7dfcd5
 ---> 9f9bec2abf2e
Removing intermediate container f277fa7dfcd5  
Step 9/9 : CMD python /app.py  
 ---> Running in a2babc256093
 ---> 2dcc3b299859
Removing intermediate container a2babc256093  
Successfully built 2dcc3b299859  
WARNING: Image for service app was built because it did not already exist. To rebuild this image you must use `docker-compose build` or `docker-compose up --build`.  
Creating apptest_redis_1  
Creating apptest_app_1  
Attaching to apptest_redis_1, apptest_app_1  
redis_1  | 1:C 08 Mar 09:56:55.765 # Warning: no config file specified, using the default config. In order to specify a config file use redis-server /path/to/redis.conf  
redis_1  |                 _._  
redis_1  |            _.-``__ ''-._  
redis_1  |       _.-``    `.  `_.  ''-._           Redis 3.2.8 (00000000/0) 64 bit  
redis_1  |   .-`` .-```.  ```/    _.,_ ''-._  
redis_1  |  (    '      ,       .-`  | `,    )     Running in standalone mode  
redis_1  |  |`-._`-...-` __...-.``-._|'` _.-'|     Port: 6379  
redis_1  |  |    `-._   `._    /     _.-'    |     PID: 1  
redis_1  |   `-._    `-._  `-./  _.-'    _.-'  
redis_1  |  |`-._`-._    `-.__.-'    _.-'_.-'|  
redis_1  |  |    `-._`-._        _.-'_.-'    |           http://redis.io  
redis_1  |   `-._    `-._`-.__.-'_.-'    _.-'  
redis_1  |  |`-._`-._    `-.__.-'    _.-'_.-'|  
redis_1  |  |    `-._`-._        _.-'_.-'    |  
redis_1  |   `-._    `-._`-.__.-'_.-'    _.-'  
redis_1  |       `-._    `-.__.-'    _.-'  
redis_1  |           `-._        _.-'  
redis_1  |               `-.__.-'  
redis_1  |  
redis_1  | 1:M 08 Mar 09:56:55.767 # WARNING: The TCP backlog setting of 511 cannot be enforced because /proc/sys/net/core/somaxconn is set to the lower value of 128.  
redis_1  | 1:M 08 Mar 09:56:55.767 # Server started, Redis version 3.2.8  
redis_1  | 1:M 08 Mar 09:56:55.767 # WARNING overcommit_memory is set to 0! Background save may fail under low memory condition. To fix this issue add 'vm.overcommit_memory = 1' to /etc/sysctl.conf and then reboot or run the command 'sysctl vm.overcommit_memory=1' for this to take effect.  
redis_1  | 1:M 08 Mar 09:56:55.767 # WARNING you have Transparent Huge Pages (THP) support enabled in your kernel. This will create latency and memory usage issues with Redis. To fix this issue run the command 'echo never > /sys/kernel/mm/transparent_hugepage/enabled' as root, and add it to your /etc/rc.local in order to retain the setting after a reboot. Redis must be restarted after THP is disabled.  
redis_1  | 1:M 08 Mar 09:56:55.767 * The server is now ready to accept connections on port 6379  
app_1    |  * Running on http://0.0.0.0:5000/ (Press CTRL+C to quit)  
app_1    |  * Restarting with stat  
app_1    |  * Debugger is active!  
app_1    |  * Debugger pin code: 299-635-701  

Current example will increment view counter in Redis. Open the following url in your web browser and check it.

Using docker-compose is a topic for a separate article. To get started you can play with some images from Docker Hub or if you want to create your own images – follow best practices listed above. The only thing I can add in terms of using docker-compose: always give explicit names to your volumes in docker-compose.yml (if image has volumes). This simple rule will save you from issue in the future when you’ll be inspecting your volumes.

version: '2'  
services:  
  ...
  redis:
    image: redis:3.2-alpine
    volumes:
      - redis_data:/data
volumes:  
  redis_data:

In this case redis_data will be the name inside docker-compose.yml file, for the real volume name it will be prepended with project name prefix.

To see volumes run:

docker volume ls  

Console output:

DRIVER              VOLUME NAME  
local               apptest_redis_data  

Without explicit volume name there will be UUID. And here is an example from my local machine:

DRIVER              VOLUME NAME  
local               ec1a5ac0a2106963c2129151b27cb032ea5bb7c4bd6fe94d9dd22d3e72b2a41b  
local               f3a664ce353ba24dd43d8f104871594de6024ed847054422bbdd362c5033fc4c  
local               f81a397776458e62022610f38a1bfe50dd388628e2badc3d3a2553bb08a5467f  
local               f84228acbf9c5c06da7be2197db37f2e3da34b7e8277942b10900f77f78c9e64  
local               f9958475a011982b4dc8d8d8209899474ea4ec2c27f68d1a430c94bcc1eb0227  
local               ff14e0e20d70aa57e62db0b813db08577703ff1405b2a90ec88f48eb4cdc7c19  
local               polls_pg_data  
local               polls_public_files  
local               polls_redis_data  
local               projectdev_pg_data  
local               projectdev_redis_data  

Docker way

Docker has some restrictions and requirements depending on the architecture of your system (applications that you pack into containers). You can ignore these requirements or find some workarounds, but in this case, you won’t get all the benefits from using Docker. My strong advice is to follow these recommendations:

  • 1 application = 1 container
  • Run process in foreground (don’t use systemd, upstart or any other similar tools)
  • Keep data out of container — use volumes
  • Do not use SSH (if you need to step into container you can use docker exec command)
  • Avoid manual configurations (or actions) inside container

Conclusion

To summarize all the above, alongside with IDE and Git, Docker has become one of the must-have developer tools.

We at Django Stars have successfully implemented Docker in numerous projects. Stay tuned if you are interested in such advanced tutorials — “How to set up Django app in Docker?” and “How to use Docker and CircleCI?”.

This tutorial was originally posted in Django Stars Blog. Join the discussion if you have any questions

Have you already used Docker on your project? Leave us a comment or ask questions below!


A New Home for Google Open Source

Free and open source software has been part of our technical and organizational foundation since Google’s early beginnings. From servers running the Linux kernel to an internal culture of being able to patch any other team’s code, open source is part of everything we do. In return, we’ve released millions of lines of open source code, run programs like Google Summer of Code and Google Code-in, and sponsor open source projects and communities through organizations like Software Freedom Conservancy, the Apache Software Foundation, and many others.


Today, we’re launching opensource.google.com, a new website for Google Open Source that ties together all of our initiatives with information on how we use, release, and support open source.

Read more at Google

Security Orchestration and Incident Response

Last month at the RSA Conference, I saw a lot of companies selling security incident response automation. Their promise was to replace people with computers ­– sometimes with the addition of machine learning or other artificial intelligence techniques ­– and to respond to attacks at computer speeds.

While this is a laudable goal, there’s a fundamental problem with doing this in the short term. You can only automate what you’re certain about, and there is still an enormous amount of uncertainty in cybersecurity. Automation has its place in incident response, but the focus needs to be on making the people effective, not on replacing them ­ security orchestration, not automation.

This isn’t just a choice of words ­– it’s a difference in philosophy. The US military went through this in the 1990s. What was called the Revolution in Military Affairs (RMA) was supposed to change how warfare was fought. Satellites, drones and battlefield sensors were supposed to give commanders unprecedented information about what was going on, while networked soldiers and weaponry would enable troops to coordinate to a degree never before possible. In short, the traditional fog of war would be replaced by perfect information, providing certainty instead of uncertainty. They, too, believed certainty would fuel automation and, in many circumstances, allow technology to replace people.

Read more at Schneier on Security

Containerization Leaders Explore Possible Standardized Data Storage Interface

A group of engineers from every leading container orchestrator maker have gathered together, virtually, around an initiative to explore a common lexicon for container-based data storage. Initially proposed by Mesosphere’s Benjamin Hindman, the Container Storage Interface initiative — which, for now, is essentially a GitHub document — is exploring the issue of whether the community at large, and their users, would benefit from a standardized API for addressing and managing storage volumes.

“The goal of this standard is to have a single, cluster-level volumes plugin API that is shared by all orchestrators,” Goelzer writes in the group’s preamble. “So, for example, conformant storage plugins written for Docker would run unmodified in Kubernetes (and vice-versa).”

Read more at The New Stack

The Zephyr Project: An RTOS for IoT

How do you develop and sustain an operating system primed for the continuously evolving nature of the internet of things? You model it, in part, on the highly successful Linux platform, which is exactly the tactic of the Zephyr Project, an open, real-time operating system overseen by the nonprofit Linux Foundation along with a variety of other big-name industry players.

The Zephyr Project, which celebrated its one-year anniversary in February 2017, is a modular, scalable platform designed for connected, resource-strained devices. The open source RTOS — which, in fact, includes no Linux code, but rather is based on the Wind River Rocket IoT OS technology acquired by Intel — is able to integrate with myriad third-party libraries and embedded devices, regardless of architecture, and was built with security in mind, according to project members.

Read more at TechTarget

Becoming an Agile Leader, Part 5: Learning to Learn

To summarize: your Agile transformation is stuck. You’ve thought about your why, as in Becoming an Agile Leader, Part 1: Define Your Why. You’ve started to measure possibilities. You have an idea of who you might talk with as in Becoming an Agile Leader, Part 2: Who to Approach. You’ve considered who you need as allies and how to enlist them in Becoming an Agile Leader, Part 3: How to Create Allies. In Becoming an Agile Leader, Part 4: Determining Next Steps, you thought about creating win-wins with influence. Now, it’s time to think about how you and the people involved (or not involved!) learn.

Read more at DZone

OpenSDS at CloudNativeCon + KubeCon: Moving Forward with SDS and Cloud Computing

CloudNativeCon + KubeCon Europe 2017 has begun and is bringing together the world’s top experts in open source cloud computing. Their goal is to maintain and promote the development of integrated open source technologies to better deploy and implement cloud computing.

OpenSDS, a Silver sponsor of CloudNativeCon + KubeCon, has gathered the community at the conference and is demonstrating its open and flexible Software-Defined Storage (SDS) architecture solution in the exhibit hall. Project contributors are demonstrating the latest in code developments, including both northbound and southbound API definitions and microservice architecture design.

OpenSDS recently demonstrated an integrated test for clusters in the Cloud Native Computing Foundation (CNCF) community lab. This demonstration provided dynamic storage support for pod failure recovery and business expansion in Kubernetes and showed OpenSDS on OpenStack, CoprHD, Ceph, and other different back-end storage access support.

OpenSDS is an open source project community established under The Linux Foundation. To move enterprises into the era of cloud storage and provide them with on-demand data storage, the OpenSDS community is creating open source SDS solutions for cloud, container, virtualization, and other environments. OpenSDS includes leaders in storage equipment manufacturing as well as world-renowned enterprise users. The project also collaborates with global heavyweights of open source, such as CNCF.

We invite you to learn more about our mission and participants at https://www.opensds.io/.

Linux Block I/O Tracing

Written by Gabriel Krisman Bertazi, Software Engineer at Collabora.

Like starting a car with the hood open, sometimes you need to run your program with certain analysis tools attached to get a full sense of what is going wrong – or right. Be it to debug an issue, or simply to learn how that program works, these probing tools can provide a clear picture of what is going on inside the CPU at a given time.

In kernel space, the challenge of debugging a subsystem is greatly increased. It is not always that you can insert a breakpoint, step through each instruction, print values and de-reference structures to understand the problem, like you would do with GDB in userspace. Sometimes, attaching a debugger may require additional hardware, or you may not be able to stop at a specific region at all, because of the overhead created. Like the rule of not trying to printk() inside the printk code, debugging at early boot time or analyzing very low-level code pose challenges on itself, and more often than not, you may find yourself with a locked system and no meaningful debug data.

With that in mind, the kernel includes a variety of tools to trace general execution, as well as very specialized mechanisms, which allow the user to understand what is happening on specific subsystems. From tracing I/O requests to snooping network packets, these mechanisms provide developers with a deep insight of the system once an unexpected event occurs, allowing them to better understand issues without relying on the very primitive printk() debug method.

So large is the variety of tools specialized to each subsystem, that discussing them all in a single post is counter-productive. The challenges and design choices behind each part of the Linux kernel are so diverse, that we eventually need to focus our efforts on specific subsystems to fully understand the code, instead of looking for a one-size-fits-all kind of tool. In this article, we explore the Linux block I/O subsystem, in a attempt to understand what kind of information is available, and what tools we can use to retrieve them.

iostat

iostat is a tool for monitoring and reporting statistics about the I/O operations happening on the system. It generates a device utilization report in real-time, which includes throughput and latency information split by Reads and Writes, as well as accounting of request sizes. The reports generated by iostat are a fast way to verify if the device is behaving as expected performance-wise, or if a specific kind of operation is misbehaving.

iostat can be configured to run periodically, printing reports at a specific frequency. The first report generated provides the accumulated I/O statistics since the system booted, while each of the subsequent reports will print the operations that occured since the last report.

The tool is packaged in all major distros. In Debian, you can install the sysstat package, which includes iostat and many other tools for I/O monitoring.

sudo apt install sysstat

The output below exemplifies the execution of iostat, which prints a report every two seconds. The first report has the accumulated statistics, while the next has only the delta from the last report. In this case, I started a dd from /dev/sdb at the same time I ran iostat, which explains the sudden increase of Read data in the sdb row.

[krisman@dilma]$ iostat 2
Linux 4.9.0-2-amd64 (dilma)     03/24/2017      _x86_64_        (4 CPU)

avg-cpu:  %user   %nice %system %iowait  %steal   %idle
	   6.50    0.01    1.06    0.08    0.00   92.34

Device:  tps  kB_read/s  kB_wrtn/s  kB_read   kB_wrtn
sda     5.64      35.28     158.58  9309088  41836483
dm-0    9.97      35.07     158.57  9251926  41836180
dm-1    0.98       8.70       3.55  2294873    936692
dm-2    0.16       0.15       0.50    38988    130968
dm-3    8.58      26.21     154.53  6915201  40768520
loop0   0.00       0.01       0.00     2125         0
sdb     0.00       0.16       0.00    42704         0

avg-cpu:  %user   %nice %system %iowait  %steal   %idle
	   3.75    0.00    7.13   20.03    0.00   69.09

Device:  tps  kB_read/s  kB_wrtn/s  kB_read   kB_wrtn
sda     1.00       0.00       6.00        0        12
dm-0    1.50       0.00       6.00        0        12
dm-1    1.50       0.00       6.00        0        12
dm-2    0.00       0.00       0.00        0         0
dm-3    0.00       0.00       0.00        0         0
loop0   0.00       0.00       0.00        0         0
sdb   680.50   43580.00       0.00    87160         0

In the output above, we have two utilization reports. If we left iostat running for longer, we would have reports like these printed every two seconds. The frequency of reports is defined by the number 2 in the command line.

With the default configuration, iostat will print the number of operations per second in the first column (tps), and the rate and total number of Reads and Writes, respectively, in the following columns for each device (rows) in the system. Some more advanced (and interesting) statistics can be obtained using the -x parameter.

In this case, the dd was copying data from sdb into a file in sda, which explains the large number of blocks read in the sdb column. But why the number of read blocks in sdb doesn’t match the data written to sda in the report above?

That’s most likely because the operating system does some caching of Write requests, in order to improve overall system responsiveness. In this case, it notifies dd that the write was completed long before the data is fully commited to the disk. In fact, if we look at reports generated later we will see matching numbers.

As an experiment to confirm this hypothesis, we can force the system to flush pending write requests using the sync() system call at the same time we execute the dd, for instance, by executing the sync command in the command line.

As a result, as show in the report below, once we issue sync calls, the transfer number start to carry a much better correlation between what is being read from sdb and what is being written to sda:

[krisman@dilma]$ iostat 2 /dev/sda /dev/sdb
avg-cpu:  %user   %nice %system %iowait  %steal   %idle
	   4.80    0.00    8.98   20.48    0.00   65.74

Device:   tps  kB_read/s   kB_wrtn/s  kB_read   kB_wrtn
sda     84.00       0.00    33490.00        0     66980
sdb    672.00   43008.00        0.00    86016         0

iostat gives us a good overview of statistics, but it doesn’t really do much on opening the hood of the kernel and showing what is going on. For that, we need other tools.

SCSI logs

Depending on what part of the block I/O stack you are interested in examining, tools will vary. Maybe a filesystem specific or a block layer tracer tool will be more helpful. If you are interested in taking a quick look at the execution and the result of a SCSI command, the SCSI layer exposes a simple logging system that doesn’t require any additional tools. It will trace the execution of SCSI commands and dump the data into dmesg.

The interface is exposed in /proc/sys/dev/scsi/logging_level, and you can simply echo hexadecimal values to enable and disable configuration options. Instead of doing that, and to make the feature discussion simpler, we’ll use the scsi_logging_level script, provided in Debian by the sg3-utils package, which is simply a wrapper around the procfs interface, to configure the logging mechanism.

First, install it using apt:

sudo apt install sg3-utils

One can use the command scsi_logging_level to enable and configure the log level of several tracepoints along the Linux SCSI stack. The example below enables maximum logging for incoming SCSI ioctls and then, after triggering a couple SG_IO commands, uses dmesg to print the kernel log.

[krisman@dilma]$ scsi_logging_level -s --ioctl=7; send_ioctls; dmesg
sd 1:0:0:0: [sda] sd_ioctl: disk=sda, cmd=0x2285

The disk and the cmd field identifies the destination block device and the actual IOCTL submitted. As a slightly more complex example, we can use the –midlevel parameter to track SCSI commands as they flow through the SCSI submission and completion path.

[krisman@dilma]$ scsi_logging_level -s --midlevel=7; dd_something; dmesg
sd 1:0:0:0: [sda] tag#23 Send: scmd 0xffff8aa7a056a080
sd 1:0:0:0: [sda] tag#23 CDB: Read(10) 2800 001d 4680 0000 0800
sd 1:0:0:0: [sda] tag#23 Done: SUCCESS Result: hostbyte=DID_OK driverbyte=DRIVER_OK
sd 1:0:0:0: [sda] tag#23 CDB: Read(10) 2800 001d 4680 0000 0800
sd 1:0:0:0: [sda] tag#23 scsi host busy 1 failed 0
sd 1:0:0:0: Notifying upper driver of completion (result 0)

SCSI logging is useful for tracing I/O requests submitted to SCSI devices, but it obviously cannot handle other kind of devices. It also can’t handle complex filtering options, and the amount of output can be overwhelming.

While SCSI logging gives an insight at the SCSI protocol layer, we can use other tools like blktrace to observe the flow of requests in the block layer.

Blktrace

blktrace explores the Linux kernel tracepoint infrastructure to track requests in-flight through the block I/O stack. It traces everything that goes through to block devices, while observing timing information. It is a great tool to debug I/O devices and the block subsystem, since it logs what happened at each step with each I/O request in the system, but it is also helpful to identify performance issues when issuing specific commands to devices.

Since it traces every request going to the device, an actual trace session can get very large very fast, making it harder to analyze, specially when running stress workloads. The output of blktrace is also read and stored in a binary format, requiring another tool to analyze it. That tool is blkparse, which crawls through a blktrace generated file and prints it in a human readable way.

A trace can be collected for late analysis or the output can be piped directly into blkparse, for a real-time debug session.

The blktrace suite is packaged for major distros. In Debian, for instance, you can install it by doing:

sudo apt install blktrace

Below is an example of the blktrace output, at the same time an sg_inq command is issued in userspace. The sg_inq, which is part of the sg3_utils package, is a simple tool to issue SCSI INQUIRY commands to devices through the SG_IO ioctl. Since this is a non-filesystem request, we only queried PC requests in the blktrace to reduce the noise from other requests that could have been issued at the same time.

The nice part of sg_inq is that it is a very simple tool, which will only issue a single SCSI request, being very easy to trace in the blkparse output. Let’s take a look at the results now:

[root@dilma blkt]$ ./blktrace /dev/sdb -a PC -o - | ./blkparse -i -
8,16  1  1  0.000000000 12285  I R 252 (12 01 00 00 fc 00 ..) [sg_inq]
8,16  1  2  0.000000836 12285  D R 252 (12 01 00 00 fc 00 ..) [sg_inq]
8,16  0  1  0.000199172     3  C R (12 01 00 00 fc 00 ..) [0]

In one terminal, we executed blktrace to trace PC (non-filesystem requests) on the /dev/sdb disk. We pipe the binary output to blkparse, that generates human-readable formatting.

The first column has the Major and Minor number of the device, unequivocally identifying the destination disk. This is followed by the CPU number that executed that function, the sequence number, and a timestamp of the moment it executed. The fifth column has the Process ID of the task that executed the request, and the sixth column has a character describing the action taken, in other words what part of the I/O execution process was logged.

The next fields will describe the type of the request, for instance, whether it was a Read or Write, and then, the payload data, which can be specific to the request executed. In the case above, we did a SCSI Inquiry command, and inside the parenthesis, one can see the CDB data.

In the example above, we can see the flow of the request across the block system. The first line, which has the action I, indicates the moment when the request entered the block layer. Next, the moment when the request was dispatched (D) and completed (C), respectively.

blktrace is the specialized tool that will provide you with the most information about what is happening inside the block layer. It is great for debugging hard problems, but the amount of information it produces can also be overwhelming. For an initial analysis, other tools may be better suited.

BCC tools

The BCC tools are a very flexible set of scripts that use BPF to implement live probepoints in the Linux kernel. You can either implement your own scripts to probe any specific function that interests you, or you can use one of the example scripts that come with the package, some of which are very useful for generic block I/O debugging.

Writing BPF scripts for tracing is a huge topic on itself and, obviously, not specific to block layer debugging. Still, some existing scripts can provide the user with a deep insight of what is happening at several levels of the block I/O stack.

These scripts are part of the IO visor project and they are not yet packaged for Debian, as far as I know. In Debian, you are better off by installing from source, as described here. Be aware that, because of what I believe is a bug in the Debian kernel, you may need to run with the unsigned kernel for now.

Trace

The first of these scripts is trace. It is a simple wrapper to trace the execution of specific functions. In the example below, I quickly caught calls to cache_type_store(), that I triggered writing to the cache_type sysfs file.

root@dilma:/usr/share/bcc/tools# ./trace 'cache_type_store "%s", arg3'
PID    TID    COMM  FUNC             -
29959  29959  tee   cache_type_store write through
29973  29973  tee   cache_type_store writeback

I asked it to print the third argument of cache_type_store which is a buffer (“%s”) that stores the value written to the cache_type file. For a quick understanding, the signature of the function cache_type_store is the as follows:

cache_type_store(struct device *dev, struct device_attribute *attr, const char *buf, size_t count)

Snooping on BIOs and Filesystem operations

Instead of reinventing the wheel and tracing individual functions to track the flow of data, the bcc suite provides scripts to track I/O at specific levels, like at the filesystem or at the block layer.

biosnoop and biotop are tools to track operations at the struct BIO and struct request level. The first one, biosnoop, traces requests in-flight, similarly to blktrace, though it only prints completed requests, instead of tracing them at each step of the block subsystem, like blktrace does. biotop provides a top-like interface, printing the processes that are using the disk and how much I/O each one is issuing, in a very familiar way for top users.

Below is an example output of running biosnoop on an almost idle disk. This tool provides an easy way to log what parts of the disk are being accessed and by whom.

root@dilma:/usr/share/bcc/tools# ./biosnoop
TIME(s)  COMM           PID  DISK  T  SECTOR    BYTES  LAT(ms)
0.000000 dmcrypt_write  224  sda   W  523419576 45056    1.89
0.002782 dmcrypt_write  224  sda   W  523419664 4096     0.06
0.941789 dmcrypt_write  224  sda   W  70282904  4096     1.77
5.000375 dmcrypt_write  224  sda   W  70264440  4096     1.80

At the filesystem level, one can use ext4slower to snoop at slow requests, in a similar way that is done by biosnoop. This tool only prints requests taking longer than a specified threshold. In my case, looks like syncing my Spam folder from Collabora takes a little longer than expected! 😛

root@dilma:/usr/share/bcc/tools# ./ext4slower
Tracing ext4 operations slower than 10 ms
TIME     COMM    PID  T BYTES OFF_KB LAT(ms) FILENAME
22:45:08 mbsync 1067  S 0     0      10.15   :collabora-remote:Spam:

Wrapping up

The goal of this post is to give a sense of what tools are available and what kind of information can be collected from the block layer. Opening the hood and checking out the system at run-time is not always easy. But, like we did when validating the iostat caching hypothesis, it is a great opportunity to learn how things work and how they can be improved.


VisionMobile Report Lays Out Developer Salaries by Skill, Software Sector, and Location

Developers earn higher salaries when their software skills are scarce and more complex, according to VisionMobile’s 12th annual report on developer economics released this week.

In 2017, that means skilled cloud and backend developers, as well as those who work in emerging technologies including Internet of Things (IoT), machine learning and augmented/virtual reality (AR/VR) can make more money — tens or sometimes hundreds of times more — than frontend web and mobile developers whose skills have become more commoditized.

“In Western Europe, for example, the median backend developer earns 12% more than the median web developer; a machine learning developer makes 28% more,” according to the report.

This is because in emerging tech markets like AR/VR and IoT, companies that are early adopters will pay top dollar for skilled developers who are scarce. The top 10 percent of salary earners in AR who live in North America earn a median salary of $219,000, compared with $169,000 for the top earning 10 percent of backend developers, according to the report.

Such high salaries are possible, however, only if you’re already a skilled developer. New, unskilled developers interested in emerging tech will have a harder time finding work, and earn less than their counterparts in more commoditized areas, due both to their lack of experience and fewer companies hiring in the early market.

Along with skill level and software sector, developer salaries also vary widely by where they live in the world. A web developer in North America earns a median income of $73,600 USD per year, compared with the same developer in Western Europe whose median income is $35,400 USD. Web developers in South Asia earn $11,700 in South Asia while those in Eastern Europe earn $20,800 per year.

“What’s a developer to do if you want to move up in the world, financially? Invest in your skills. Do difficult work. Improve your English. Look for opportunities internationally. Go for it. You deserve it!” VisionMobile says.

Based on a survey of more than 21,000 developers worldwide, VisionMobile’s “State of the Developer Nation” report includes a wealth of information on developer trends, from tools and programming languages, to career opportunities in AR/VR, web, IoT, data science, and cloud. This year for the first time the report also included developer salary information.  

For more information on developer salaries and other trends, download the full report.

Using the Valgrind Framework to Build a Persistent Memory Error Detector by Krzysztof Czurylo

Krzysztof Czurylo presents a new tool built on Valgrind – Pmemcheck – yet another memory error detector designed specifically to detect problems with Persistent Memory programming.