Home Blog Page 577

Performance Analysis in Linux

Written by Gabriel Krisman Bertazi, Software Engineer at Collabora.

Dynamic profilers are tools to collect data statistics about applications while they are running, with minimal intrusion on the application being observed.

The kind of data that can be collected by profilers varies deeply, depending on the requirements of the user. For instance, one may be interested in the amount of memory used by a specific application, or maybe the number of cycles the program executed, or even how long the CPU was stuck waiting for data to be fetched from the disks. All this information is valuable when tracking performance issues, allowing the programmer to identify bottlenecks in the code, or even to learn how to tune an application to a specific environment or workload.

In fact, maximizing performance or even understanding what is slowing down your application is a real challenge on modern computer systems. A modern CPU carries so many hardware techniques to optimize performance for the most common usage case, that if an application doesn’t intentionally exploit them, or worse, if it accidentally lies in the special uncommon case, it may end up experiencing terrible results without doing anything apparently wrong.

Let’s take a quite non-obvious way of how things can go wrong, as an example.

Forcing branch mispredictions

Based on the example from here.

The code below is a good example of how non-obvious performance assessment can be. In this function, the first for loop initializes a vector of size n with random values ranging from 0 to N. We can assume the values are well distributed enough for the vector elements to be completely unsorted.

The second part of the code has a for loop nested inside another one. The outer loop, going from 0 to K, is actually a measurement trick. By executing the inner loop many times, it stresses out the performance issues in that part of the code. In this case, it helps to reduce any external factor that may affect our measurement.

The inner loop is where things get interesting. This loop crawls over the vector and decides whether the value should be accumulated in another variable, depending on whether the element is higher than N/2 or not. This is done using an if clause, which gets compiled into a conditional branch instruction, which modifies the execution flow depending on the calculated value of the condition, in this case, if vec[i] >= N/2, it will enter the if leg, otherwise it will skip it entirely.

int rand_partsum(int n)
{
  int i,k;
  long sum = 0;
  int *vec = malloc(n * sizeof(int));

  for (i = 0; i < n; i++)
    vec[i] = rand()%n;

  for (k = 0; k < 1000000; k++)
    for (i = 0; i < n; i++)
      if (vec[i] > n/2)
	sum += n[i];

  return sum;
}

When executing the code above on an Intel Core i7-5500U, with a vector size of 5000 elements (N=5000), it takes an average of 29.97 seconds. Can we do any better?

One may notice that this vector is unsorted, since each element comes from a call to rand(). What if we sorted the vector before executing the second for loop? For the sake of the example, let’s say we add a call to the glibc implementation of QuickSort right after the initialization loop.

A naive guess would suggest that the algorithm got worse, because we just added a new sorting step, thus raising the complexity of the entire code. One should assume this would result on a higher execution time.

But, in fact, when executing the sorted version in the same machine, the average execution time drops to 13.20 seconds, which is a reduction of 56% in execution time. Why does adding a new step actually reduces the execution time? The fact is that pre-sorting the vector in this case, allows the cpu to do a much better job at internally optimizing the code during execution. In this case, the issue observed was a high number of branch mispredictions, which were triggered by the conditional branch that implements the if clause.

Modern CPUs have quite deep pipelines, meaning that the instruction being fetched on any given cycle is always a few instructions down the road than the instruction actually executed on that cycle. When there is a conditional branch along the way, there are two possible paths that can be followed, and the prefetch unit has no idea which one it should choose, until all the actual condition for that instruction is calculated.

The obvious choice for the Prefetch unit on such cases is to stall and wait until the execution unit decides the correct path to follow, but stalling the pipeline like this is very costly. Instead, a speculative approach can be taken by a unit called Branch Predictor, which tries to guess which path should be taken. After the condition is calculated, the CPU verifies the guessed path: if it got the prediction right, in other words, if a branch prediction hit occurs, the execution just continues without much performance impact, but if it got it wrong, the processor needs to flush the entire pipeline, go back, and restart executing the correct path. The later is called a branch prediction miss, and is also a costly operation.

In systems with a branch predictor, like any modern CPU, the predictor is usually based on the history of the particular branches. If a conditional branch usually goes a specific way, the next time it appears, the predictor will assume it will take the same route.

Back to our example code, that if condition inside the for loop does not have any specific pattern. Since the vector elements are completely random, sometimes it will enter the if leg, sometimes it will skip it entirely. That is a very hard situation for the branch predictor, who keeps guessing wrong and triggering flushes in the pipeline, which keeps delaying the application.

In the sorted version, instead, it is very easy to guess whether it should enter the if leg or not. For the first part of the vector, where the elements are mostly < N/2, the if leg will always be skipped, while for the second part, it will always enter the if leg. The branch predictor is capable of learning this pattern after a few iterations, and is able to do much better guesses about the flow, reducing the number of branch misses, thus increasing the overall performance.

Well, pointing specific issues like this is usually hard, even for a simple code like the example above. How could we be sure that the the program is hitting enough branch mispredictions to affect performance? In fact, there are always many things that could be the cause of slowness, even for a slightly more complex program.

Perf_events is an interface in the Linux kernel and a userspace tool to sample hardware and software performance counters. It allows, among many other things, to query the CPU register for the statistics of the branch predictor, i.e. the number of prediction hits and misses of a given application.

The userspace tool, known as the perf command, is available in the usual channels of common distros. In Debian, for instance, you can install it with:

sudo apt install linux-perf

We’ll dig deeper into the perf tool later on another post, but for now, let’s use the, perf record and perf annotate commands, which allow tracing the program and annotating the source code with the time spent on each instruction, and the perf stat command, which allows to run a program and display statistics about it:

At first, we can instruct perf to instrument the program and trace its execution:

[krisman@dilma bm]$ perf record ./branch-miss.unsorted
[ perf record: Woken up 19 times to write data ]
[ perf record: Captured and wrote 4.649 MB perf.data (121346 samples) ]

The perf record will execute the program passed as parameter and collect performance information into a new perf.data file. This file can then be passed to other perf commands. In this case, we pass it to the perf annotate command, which crawls over each address in the program and prints the number of samples that was collected while the program was executing each instruction. Instructions with a higher number of samples indicates that the program spent more time in that region, indicating that it is hot code, and a good part of the program to try to optimize. Notice that, for modern processors, the exact position is an estimation, so this information must be used with care. As a rule of thumb, one should be looking for hot regions, instead of single hot instructions.

Below is the output of perf annotate, when analyzing the function above. The output is truncated to display only the interesting parts.

[krisman@dilma bm]$ perf annotate

	:
	:      int rand_partsum()
	:      {
   0.00 :        74e:   push   %rbp
   0.00 :        74f:   mov    %rsp,%rbp
   0.00 :        752:   push   %rbx
   0.00 :        753:   sub    $0x38,%rsp
   0.00 :        757:   mov    %rsp,%rax
   0.00 :        75a:   mov    %rax,%rbx

   [...] 

   0.00 :        7ce:   mov    $0x0,%edi
   0.00 :        7d3:   callq  5d0 <time@plt>
   0.00 :        7d8:   mov    %eax,%edi
   0.00 :        7da:   callq  5c0 <srand@plt>
	:              for (i = 0; i < n; i++)
   0.00 :        7df:   movl   $0x0,-0x14(%rbp)
   0.00 :        7e6:   jmp    804 <main+0xb6>
	:                      vec[i] = rand()%n;
   0.00 :        7e8:   callq  5e0 <rand@plt>
   0.00 :        7ed:   cltd   
   0.00 :        7ee:   idivl  -0x24(%rbp)
   0.00 :        7f1:   mov    %edx,%ecx
   0.00 :        7f3:   mov    -0x38(%rbp),%rax
   0.00 :        7f7:   mov    -0x14(%rbp),%edx
   0.00 :        7fa:   movslq %edx,%rdx
   0.00 :        7fd:   mov    %ecx,(%rax,%rdx,4)
	:              for (i = 0; i < n; i++)
   0.00 :        800:   addl   $0x1,-0x14(%rbp)
   0.00 :        804:   mov    -0x14(%rbp),%eax
   0.00 :        807:   cmp    -0x24(%rbp),%eax
   0.00 :        80a:   jl     7e8 <main+0x9a>

   [...]

	 :              for (k = 0; k < 1000000; k++)
    0.00 :        80c:   movl   $0x0,-0x18(%rbp)
    0.00 :        813:   jmp    85e <main+0x110>
	 :                      for (i = 0; i < n; i++)
    0.01 :        815:   movl   $0x0,-0x14(%rbp)
    0.00 :        81c:   jmp    852 <main+0x104>
	 :                              if (vec[i] > n/2)
    0.20 :        81e:   mov    -0x38(%rbp),%rax
    6.47 :        822:   mov    -0x14(%rbp),%edx
    1.94 :        825:   movslq %edx,%rdx
   26.86 :        828:   mov    (%rax,%rdx,4),%edx
    0.08 :        82b:   mov    -0x24(%rbp),%eax
    1.46 :        82e:   mov    %eax,%ecx
    0.62 :        830:   shr    $0x1f,%ecx
    3.82 :        833:   add    %ecx,%eax
    0.06 :        835:   sar    %eax
    0.70 :        837:   cmp    %eax,%edx
    0.42 :        839:   jle    84e <main+0x100>
	 :                                      sum += vec[i];
    9.15 :        83b:   mov    -0x38(%rbp),%rax
    5.91 :        83f:   mov    -0x14(%rbp),%edx
    0.26 :        842:   movslq %edx,%rdx
    5.87 :        845:   mov    (%rax,%rdx,4),%eax
    2.09 :        848:   cltq
    9.31 :        84a:   add    %rax,-0x20(%rbp)
	 :                      for (i = 0; i < n; i++)
   16.66 :        84e:   addl   $0x1,-0x14(%rbp)
    6.46 :        852:   mov    -0x14(%rbp),%eax
    0.00 :        855:   cmp    -0x24(%rbp),%eax
    1.63 :        858:   jl     81e <main+0xd0>
	 :              for (k = 0; k < 1000000; k++)

   [...]

The first thing to notice is that the perf command tries to interleave C code with the Assembly code. This feature requires compiling the test program with -g3 to include debug information.

The number before the ‘:’ is the percentage of samples collected while the program was executing each instruction. Once again, this is not an exact information, so you should be looking for hot regions, and not specific instructions.

The first and second hunk are the function prologue, which was executed only once, and the vector initialization. According to the profiling data, there is little point in attempting to optimize them, because the execution practically didn’t spend any time on it. The third hunk is the second loop, where it spent almost all the execution time. Since that loop is where most of our samples where collected, we can assume that it is a hot region, which we can try to optimize. Also, notice that most of the samples were collected around that if leg. This is another indication that we should look into that specific code.

To find out what might be causing the slowness, we can use the perf stat command, which prints a bunch of performance counters information for the entire program. Let’s take a look at its output.

[krisman@dilma bm]$ perf stat ./branch-miss.unsorted

 Performance counter stats for './branch-miss.unsorted:

    29876.773720  task-clock (msec) #    1.000 CPUs utilized
	      25  context-switches  #    0.001 K/sec
	       0  cpu-migrations    #    0.000 K/sec
	      49  page-faults       #    0.002 K/sec
  86,685,961,134  cycles            #    2.901 GHz
  90,235,794,558  instructions      #    1.04  insn per cycle
  10,007,460,614  branches          #  334.958 M/sec
   1,605,231,778  branch-misses     #   16.04% of all branches

   29.878469405 seconds time elapsed

Perf stat will dynamically profile the program passed in the command line and report back a number of statistics about the entire execution. In this case, let’s look at the 3 last lines in the output. The first one gives the rate of instructions executed per CPU cycle; the second line, the total number of branches executed; and the third, the percentage of those branches that resulted in a branch miss and pipeline flush.

Perf is even nice enough to put important or unexpected results in red. In this case, the last line, Branch-Misses, was unexpectedly high, thus it was displayed in red in this test.

And now, let’s profile the pre-sorted version. Look at the number of branch misses:

[krisman@dilma bm]$ perf stat ./branch-miss.sorted

 Performance counter stats for './branch-miss.sorted:

    14003.066457  task-clock (msec) #    0.999 CPUs utilized
	     175  context-switches  #    0.012 K/sec
	       4  cpu-migrations    #    0.000 K/sec
	      56  page-faults       #    0.004 K/sec
  40,178,067,584  cycles            #    2.869 GHz
  89,689,982,680  instructions      #    2.23  insn per cycle
  10,006,420,927  branches          #  714.588 M/sec
       2,275,488  branch-misses     #    0.02% of all branches

  14.020689833 seconds time elapsed

It went down from over 16% to just 0.02% of the total branches! This is very impressive and is likely to explain the reduction in execution time. Another interesting value is the number of instructions per cycle, which more than doubled. This happens because, once we reduced the number of stalls, we make better use of the pipeline, obtaining a better instruction throughput.

Wrapping up

As demonstrated by the example above, figuring out the root cause of a program slowness is not always easy. In fact, it gets more complicated every time a new processor comes out with a bunch of shiny new optimizations.

Despite being a short example code, the branch misprediction case is still quite non-trivial for anyone not familiar with how the branch prediction mechanism works. In fact, if we just look at the algorithm, we could have concluded that adding a sort algorithm would just add more overhead to the algorithm. Thus, this example gives us a high-level view of how helpful profiling tools really are. By using just one of the several features provided by the perf tool, we were able to draw major conclusions about the program being examined.

Keynote: Creative Approaches To Diversity – Katharina Borchert, Chief Innovation Officer, Mozilla

https://www.youtube.com/watch?v=Szm8x5nbezw?list=PLbzoR-pLrL6rm2vBxfJAsySspk2FLj4fM

Lack of diversity may be stunting projects’ growth potential, said Mozilla’s Katharina Borchert at Open Source Leadership Summit.
 

The Linux Foundation’s Arpit Joshipura to Host Open Networking Q&A on Twitter

On Friday, March 31, The Linux Foundation will kick off a new initiative. No, it’s not a new project, event, or training course, although there are plenty of those in store. Instead, the foundation will begin a monthly Twitter chat, called #AskLF, with leaders at the organization.

Arpit Joshipura
With #AskLF, we aim to increase access to the bright minds and community organizers within The Linux Foundation. While there are many opportunities to interact with staff at Linux Foundation global events, which bring together over 25,000 open source influencers, a live Twitter Q&A will give participants a direct line of communication to the designated hosts.

The first host will be Arpit Joshipura, the General Manager of Networking & Orchestration appointed in late 2016. His #AskLF session will take place in advance of Open Networking Summit, where he will speak on two keynote panels alongside Linux Foundation Executive Director Jim Zemlin, ON.Lab/ONF Executive Director Guru Parulkar, and others. @linuxfoundation followers are encouraged to ask Joshipura questions related to the open source networking ecosystem.

Sample questions might include:

  • What is the goal of SDN? What can a network admin do in an SDN environment?

  • How can my company investigate the benefits of SDN/NFV?

  • How does The Linux Foundation help the open source community implement open networking at the individual and corporate level?

Here’s how you can participate in the first #AskLF:

  • Follow @linuxfoundation on Twitter: Hosts will take over The Linux Foundation’s account during the session.

  • Save the date: March 31, 2017 at 10 a.m. PT.

  • Use the hashtag #AskLF: To ask Joshipura your questions while he hosts, simply tweet it with the hashtag #AskLF on 3/31 between 10 am & 10:45 am PDT.

  • Draft questions in advance: Read about The Linux Foundation’s open networking strategy, Joshipura’s background, and upcoming speaking engagements in the links below. We can’t guarantee that he will have time to answer every inquiry, but every attempt will be made!

  • Consider attending Open Networking Summit in Santa Clara next month: This #AskLF session will prepare you to engage in the topics at ONS and you’ll get a chance to hear Joshipura speak live. Click here for registration details and discount info (that means you, students and academics!)

More dates and details for future #AskLF sessions to come! We’ll see you on Twitter, March 31st at 10 a.m. PT.

More information on Arpit Joshipura:

http://www.telcotransformation.com/author.asp?section_id=401&doc_id=731007&

http://www.networkworld.com/article/3147937/linux/linux-foundation-adds-an-open-source-networking-specialist-to-the-team.html

https://www.sdxcentral.com/articles/news/qa-arpit-joshipura-head-networking-linux-foundation/2017/01/

*Note: Unlike Reddit-style AMAs, #AskLF is not focused around general topics that might pertain to the host’s personal life. To participate, please focus your questions around open source networking and Arpit Joshipura’s career.

DevOps Still Very Much a Work in Progress, Survey Suggests

DevOps is a great concept — but many enterprises are still struggling to get out the starting gate with it.

That’s the key takeaway from a recent survey of 2,045 IT managers and professionals, released by Quali, an IT automation solutions provider. While most people in enterprises would say at this point that they have DevOps underway in some shape or form, achieving agility is another story.

For example, the majority of IT managers, 59%, say it takes more than a week to make needed changes or to get employees and other end-users on board with infrastructure. 

Read more at ZDNet

Interact with the Intel Edison Using SparkFun Blocks

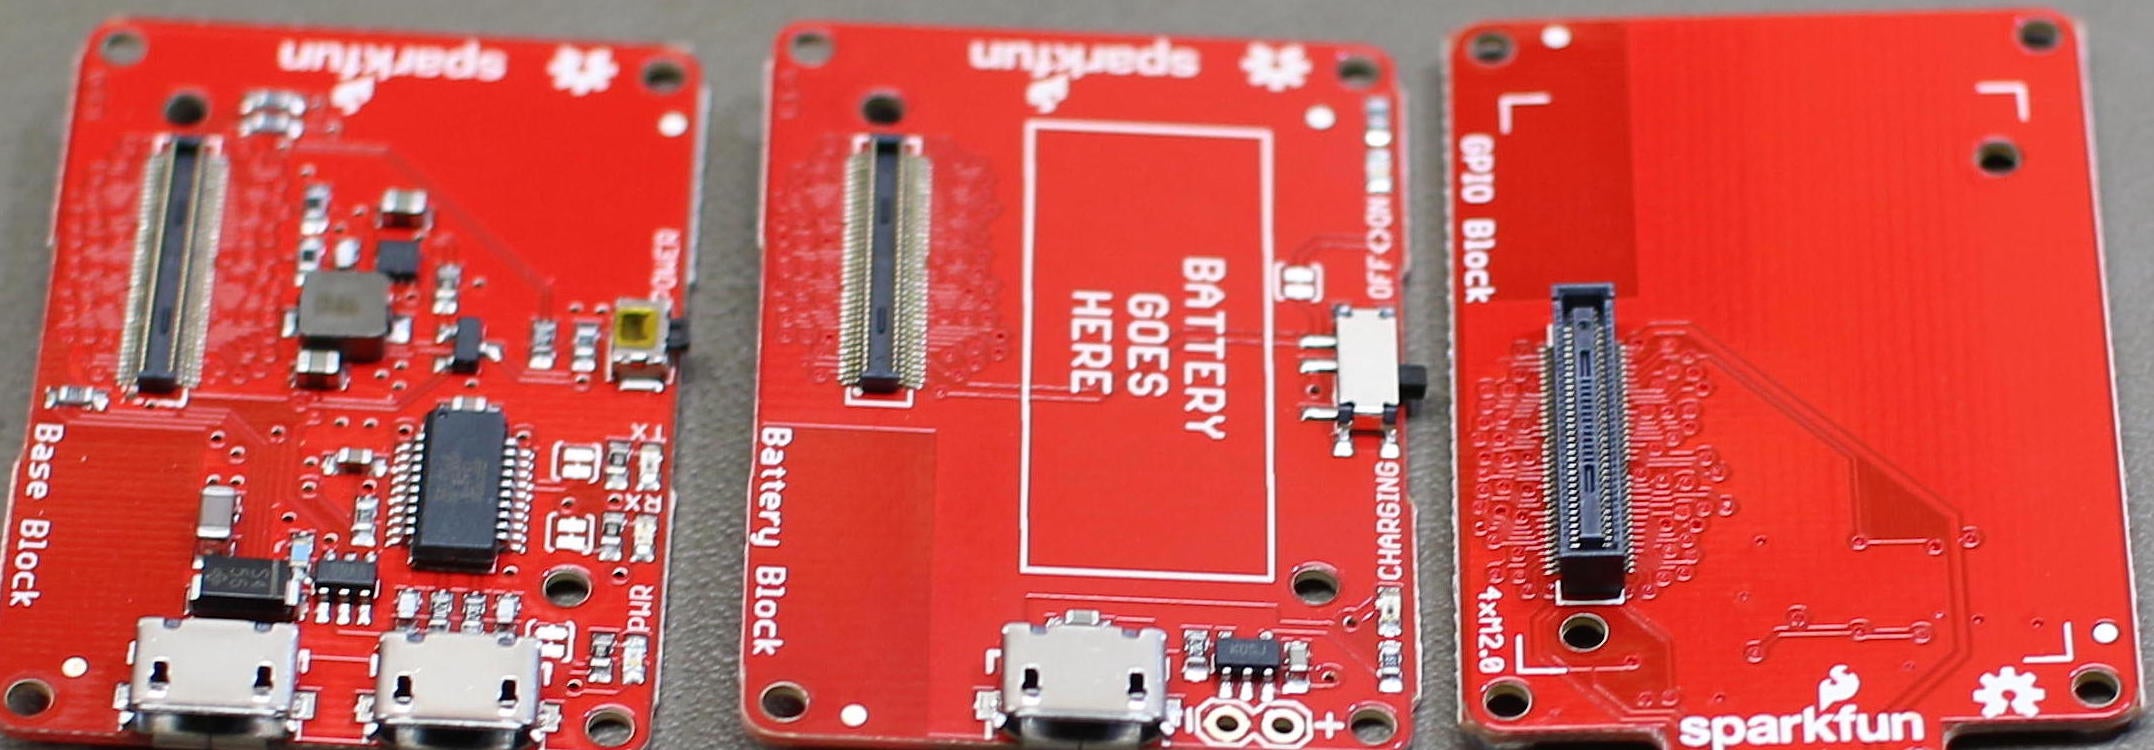
In the previous article, I looked at the Intel Edison — how fast it was, and how much power it needed. This time, I will show how to start getting the Edison board to interact with surrounding electronics with the help of SparkFun Blocks (Figure 1).

Figure 1: SparkFun Blocks.

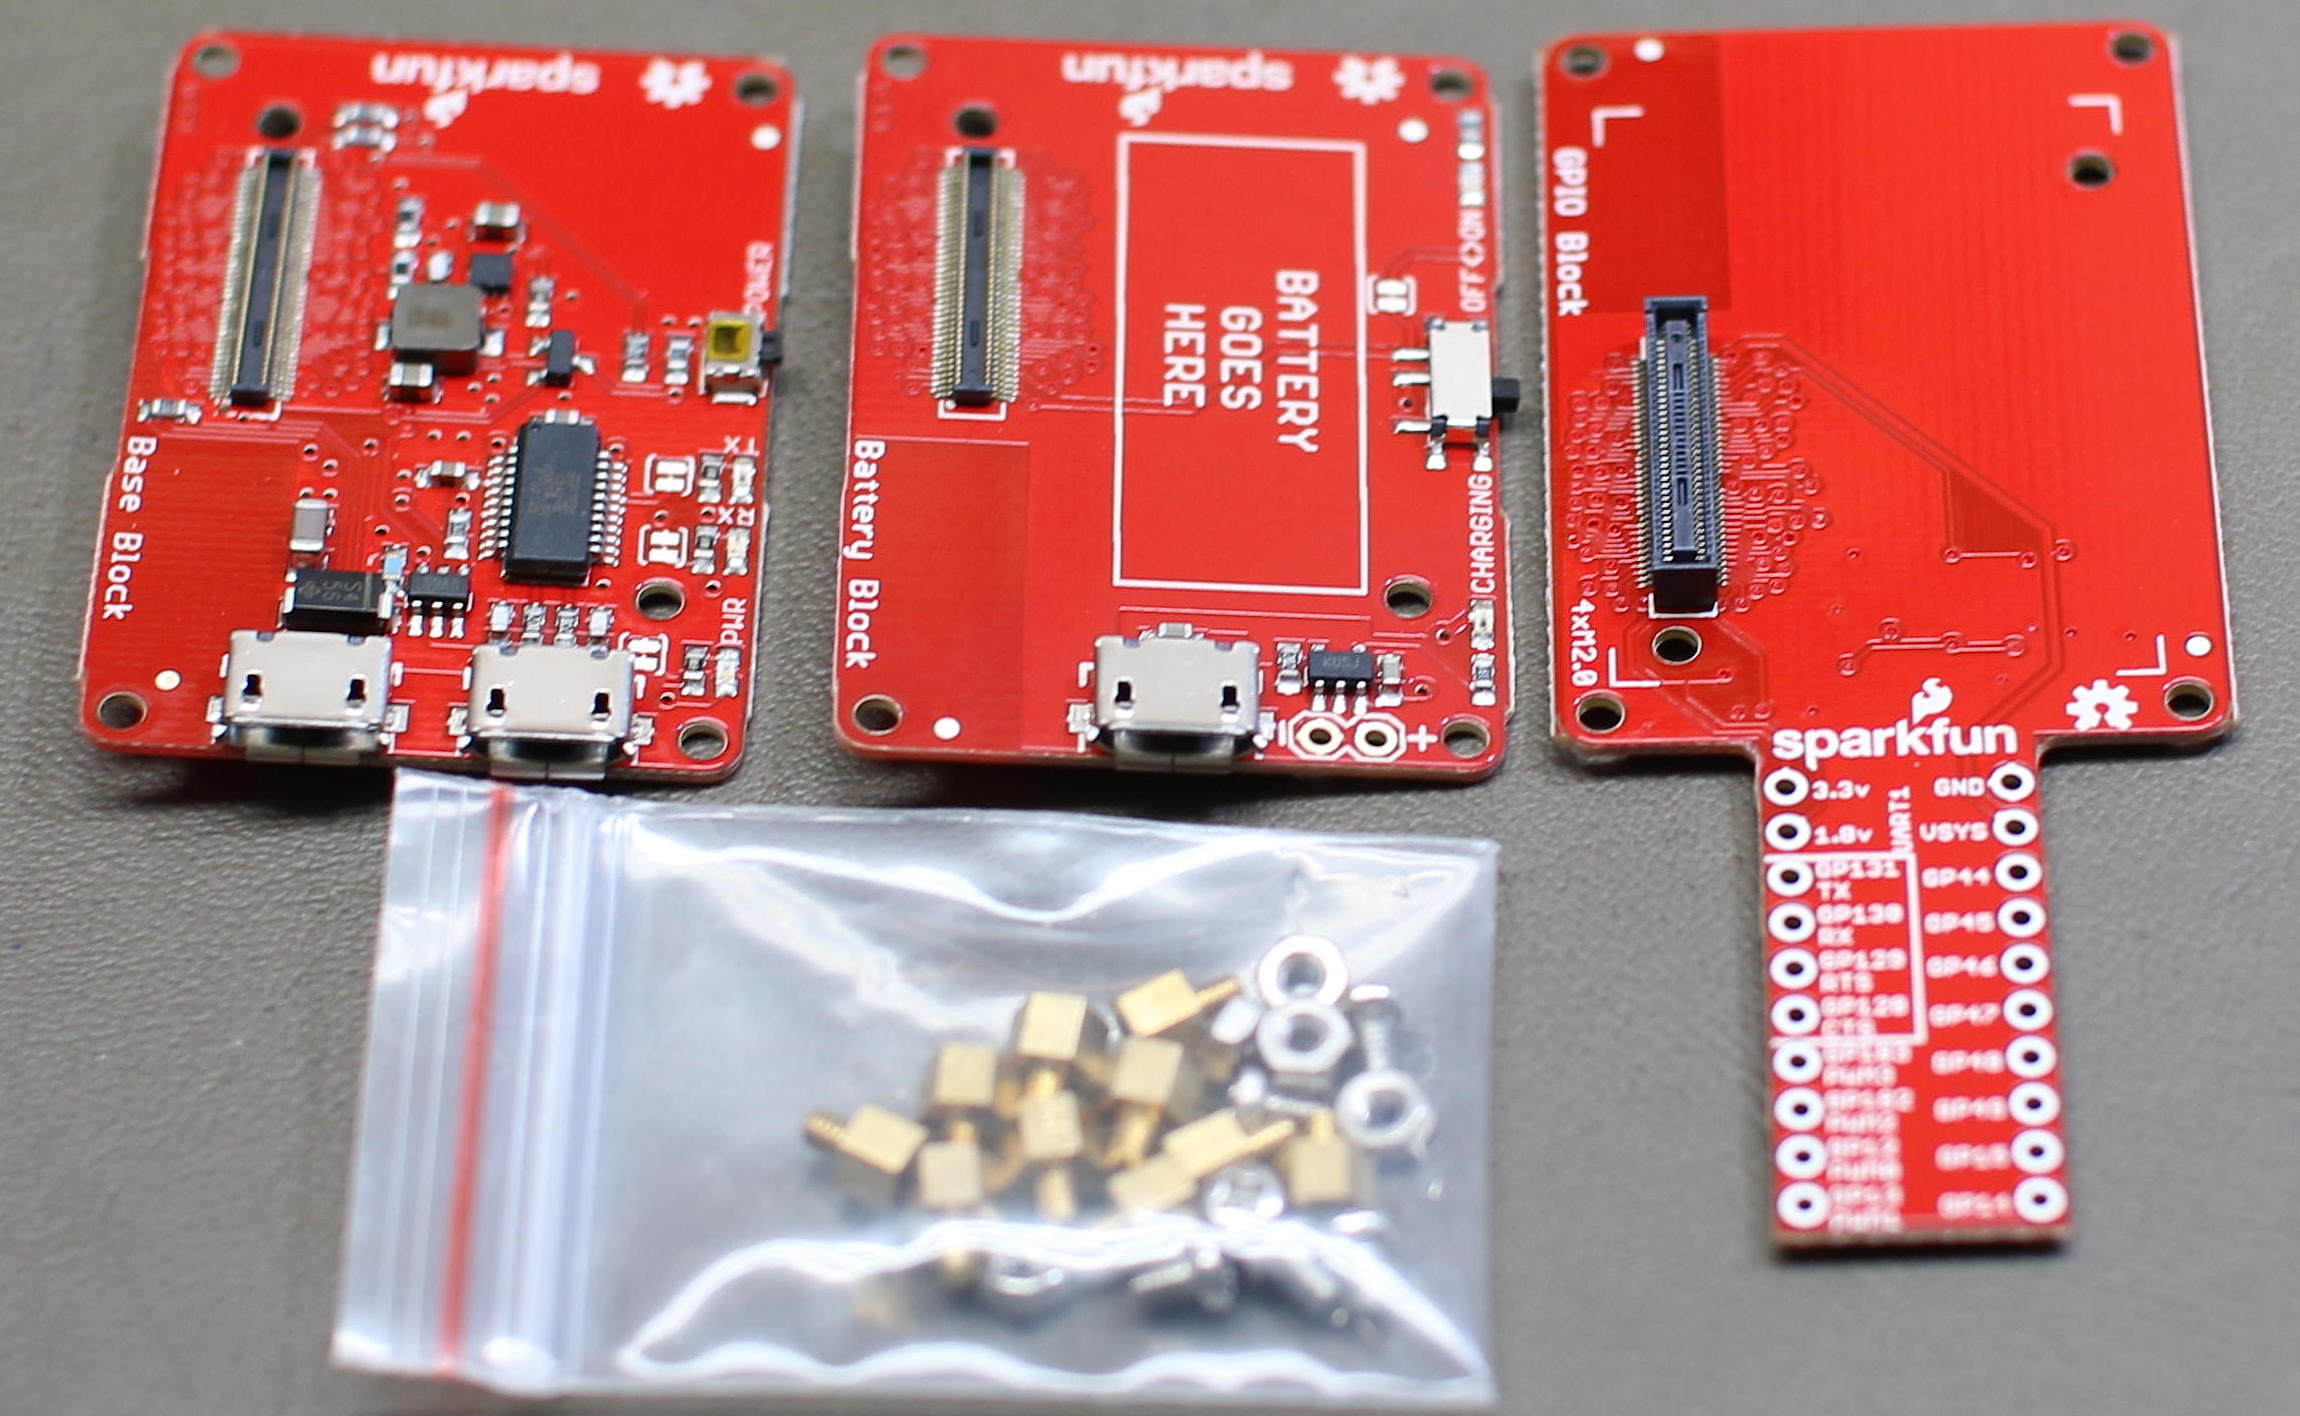
GPIO Block

The SparkFun GPIO Block breaks out various power and ground, along with a UART and four GPIO that can perform PWM output, and eight additional GPIO pins from the Edison. There is level shifting, which is enabled by default on the GPIO block to move things to a more convenient 3.3 volts. You cannot draw a great amount of current from the level shifted GPIO — it’s probably plenty if you are talking to an IC, but maybe not enough if you want to light up an LED.

The great part about the Edison running Linux is that the GPIO is exposed from the Linux kernel just as on other machines. If you have an application that can communicate with GPIO on the BeagleBone Black, porting it to run on the Edison might only require changing the paths to the GPIO pins you want to use. Below I expose pin 14, which is at the far end of the SparkFun GPIO block and toggle its state to a high voltage.

root@edison:/sys/class/gpio# echo 14 > export 
root@edison:/sys/class/gpio# cd ./gpio14
root@edison:/sys/class/gpio/gpio14# cat value 
0
root@edison:/sys/class/gpio/gpio14# echo out > direction 
root@edison:/sys/class/gpio/gpio14# echo 1 > value
root@edison:/sys/class/gpio/gpio14# cat value
1

You can set the GPIO to ‘in’ and the ‘edge’ file to read the state of the pin instead. I tried a few ways to use tools like tail and inotify to monitor the ‘value’ file for changes when the value on the GPIO changed. Things got a little tricky, tail expects new data to become available on the file. Instead of that, the new value replaces the old one at the start of the file. I didn’t get inotify to notify me of changes either. A plain C file that I developed years ago for reading interrupts on the BeagleBone Black worked just fine on the GPIO pin of the Edison. I only had to change the path to the GPIO to pin 14, and then I got a message on the console as I applied ground and 3.3 volts to pin 14 on the SparkFun block.

root@edison:~/src# g++ watch-button-glib.cpp -o watch-button-glib 
 $(pkg-config  --cflags --libs glib-2.0)
root@edison:~/src# ./watch-button-glib 

onButtonEvent
rc:1  data:0

onButtonEvent
rc:1  data:1

onButtonEvent
rc:1  data:0

The program is quite simple. A channel is set up for the file and notifications are connected to a onButtonEvent callback function.

int main( int argc, char** argv )
{
   GMainLoop* loop = g_main_loop_new( 0, 0 );
   
   int fd = open( "/sys/class/gpio/gpio14/value", O_RDONLY | O_NONBLOCK );
   GIOChannel* channel = g_io_channel_unix_new( fd );
   GIOCondition cond = GIOCondition( G_IO_PRI );
   guint id = g_io_add_watch( channel, cond, onButtonEvent, 0 );
   
   g_main_loop_run( loop );
   
}

The onButtonEvent function seeks the file read position back to the start of the file and prints the contents of the file, up to 100 bytes.

const int buf_sz = 100;
char buf[ buf_sz ];

static gboolean
onButtonEvent( GIOChannel *channel,
              GIOCondition condition,
              gpointer user_data )
{
   cerr << "onButtonEvent" << endl;

   GError *error = 0;
   gsize bytes_read = 0;
   
   g_io_channel_seek_position( channel, 0, G_SEEK_SET, 0 );
   GIOStatus rc = g_io_channel_read_chars( channel,
                                           buf, buf_sz - 1,
                                           &bytes_read,
                                           &error );
   cerr << "rc:" << rc << "  data:" << buf << endl;
   
   // thank you, call again!
   return 1;
}

The mraa package provides a tool to list, set, get, and monitor GPIO pins. The two push buttons on the OLED screen block mentioned below are 47 and 32 and can be monitored as shown below.

edison:~/src/screen/node# mraa-gpio monitor 47
Monitoring level changes to pin 47. Press RETURN to exit.
Pin 47 = 1
Pin 47 = 0
Pin 47 = 1

MicroSD Block

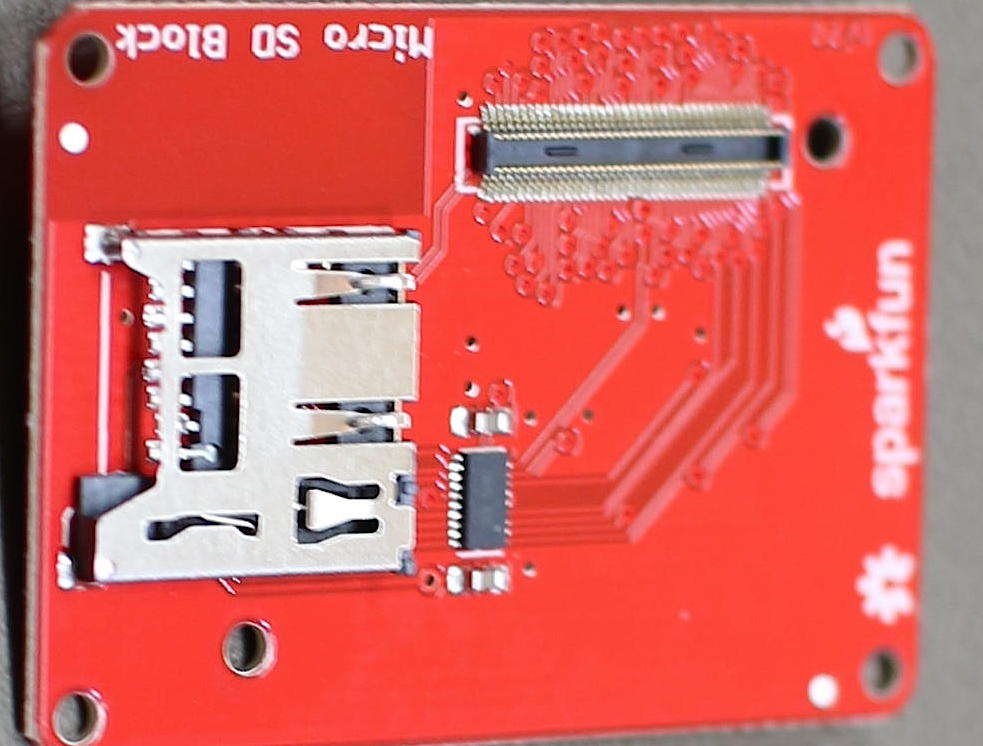
Given the Linux kernel support, the microSD Block is one of the easiest things to use with the Edison (Figure 2). 

Figure 2: MicroSD Block.

You might want to use a microSD card, for example, if you want to log data over time and do not want to run into limitations of using the main flash storage for logs.

The most time-consuming part of using the microSD Block was turning off the Edison and connecting the block into the stack. When I booted up and inserted a microSD card, it appeared in the dmesg output. From there I could mount and use the card using the same commands that are used on a desktop Linux machine.

# dmesg
...
[   60.303228] mmc1: new high speed SDHC card at address 1234
[   60.304193] mmcblk1: mmc1:1234 SA04G 3.63 GiB 
[   60.306139]  mmcblk1: p1

root@edison:~# ls -l /dev/disk/by-id
...
lrwxrwxrwx 1 root root 13 Feb 19 02:14 mmc-SA04G_0x3534550a -> ../../mmcblk1
lrwxrwxrwx 1 root root 15 Feb 19 02:14 mmc-SA04G_0x3534550a-part1 -> ../../mmcblk1p1

root@edison:~# mkdir /mnt/test
root@edison:~# mount /dev/mmcblk1p1 /mnt/test
root@edison:~# ls -l /mnt/test
-rwxr-xr-x 1 root root         30 Feb 19  2017 df.txt
root@edison:~# cat /mnt/test/df.txt
Mon Feb 20 08:56:25 2017

Because the operating system runs entirely from the onboard flash inside the Edison, you don’t have to take the operating system into consideration when exchanging the microSD card on the Edison.

IMU Block

An Inertial Measurement Unit (IMU) is a system that records information about how something moves around. Depending on the IMU you can see how fast it is turning, if it is accelerating in a given direction and perhaps a compass heading, you know how things are rotated.

The SparkFun 9 Degrees of Freedom Block exposes an IMU over the TWI of the Edison.

The sample code allows you to get up and running, seeing the rotation and acceleration of the block as you move it around. Compilation is fairly simple once you have the mraa development package installed.

edison:~# opkg install mraa-dev
 
edison:~/src/sfe_imu$ g++ SFE_LSM9DS0.cpp 
  SparkFun_9DOF_Edison_Block_Example.cpp  -lmraa 
  -o SparkFun_9DOF_Edison_Block_Example

edison:~../sfe_imu# ./SparkFun_9DOF_Edison_Block_Example
...
Gyro x: -30.1166 deg/s
Gyro y: -0.411224 deg/s
Gyro z: -0.897217 deg/s
Accel x: -0.0253906 g
Accel y: 0.153503 g
Accel z: -1.02899 g
...

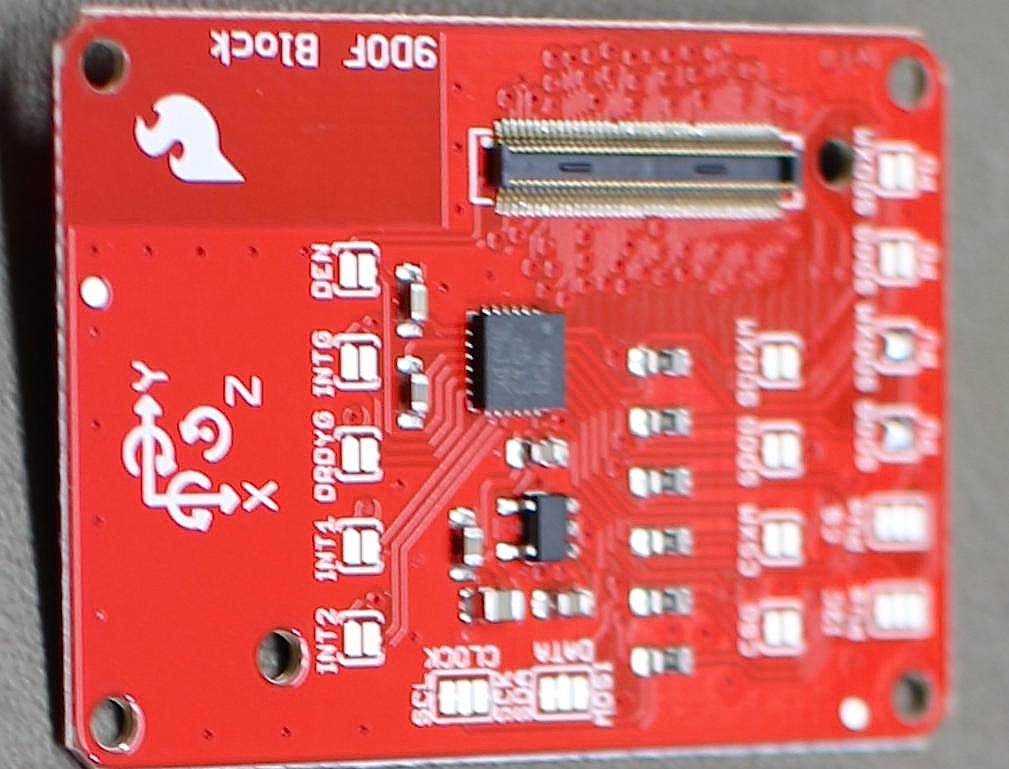
Figure 3: SparkFun IMU Block.

The chip on the SparkFun IMU Block is a LSM9DS0 (Figure 3). There is another driver for this chip in the st_lsm9ds0 project. I tried to install the kernel-dev package on the Intel Edison but that process ran out of space. I assume this is because /boot was full. To try to get around that I downloaded the source ipk file and expanded the kernel to a subdirectory of the root user with the following commands.

As you can see this allows access to not only the kernel files but also the config file used to make that kernel.

edison:~/bak# wget http://iotdk.intel.com/repos/3.5/iotdk/edison/edison/kernel-dev_1.0-r2_edison.ipk
edison:~/bak# ar x kernel-dev_1.0-r2_edison.ipk 
edison:~/bak# tar tzvf data.tar.gz 
edison:~/bak# cd ./boot
edison:~/bak# cp config-3.10.98-poky-edison+ ../usr/src/kernel/
edison:~/bak# cd ./usr/src
edison:~/bak/usr/src# ln -s `pwd`/kernel /usr/src/kernel

Unfortunately, after many attempts I did not manage to get the st_lsm9ds0 project to compile against the kernel-dev installation. I hope to cover module compilation in a future article, which covers setting up a Yocto compile environment on a desktop Linux machine to compile code including kernel modules for the Edison.

OLED Block

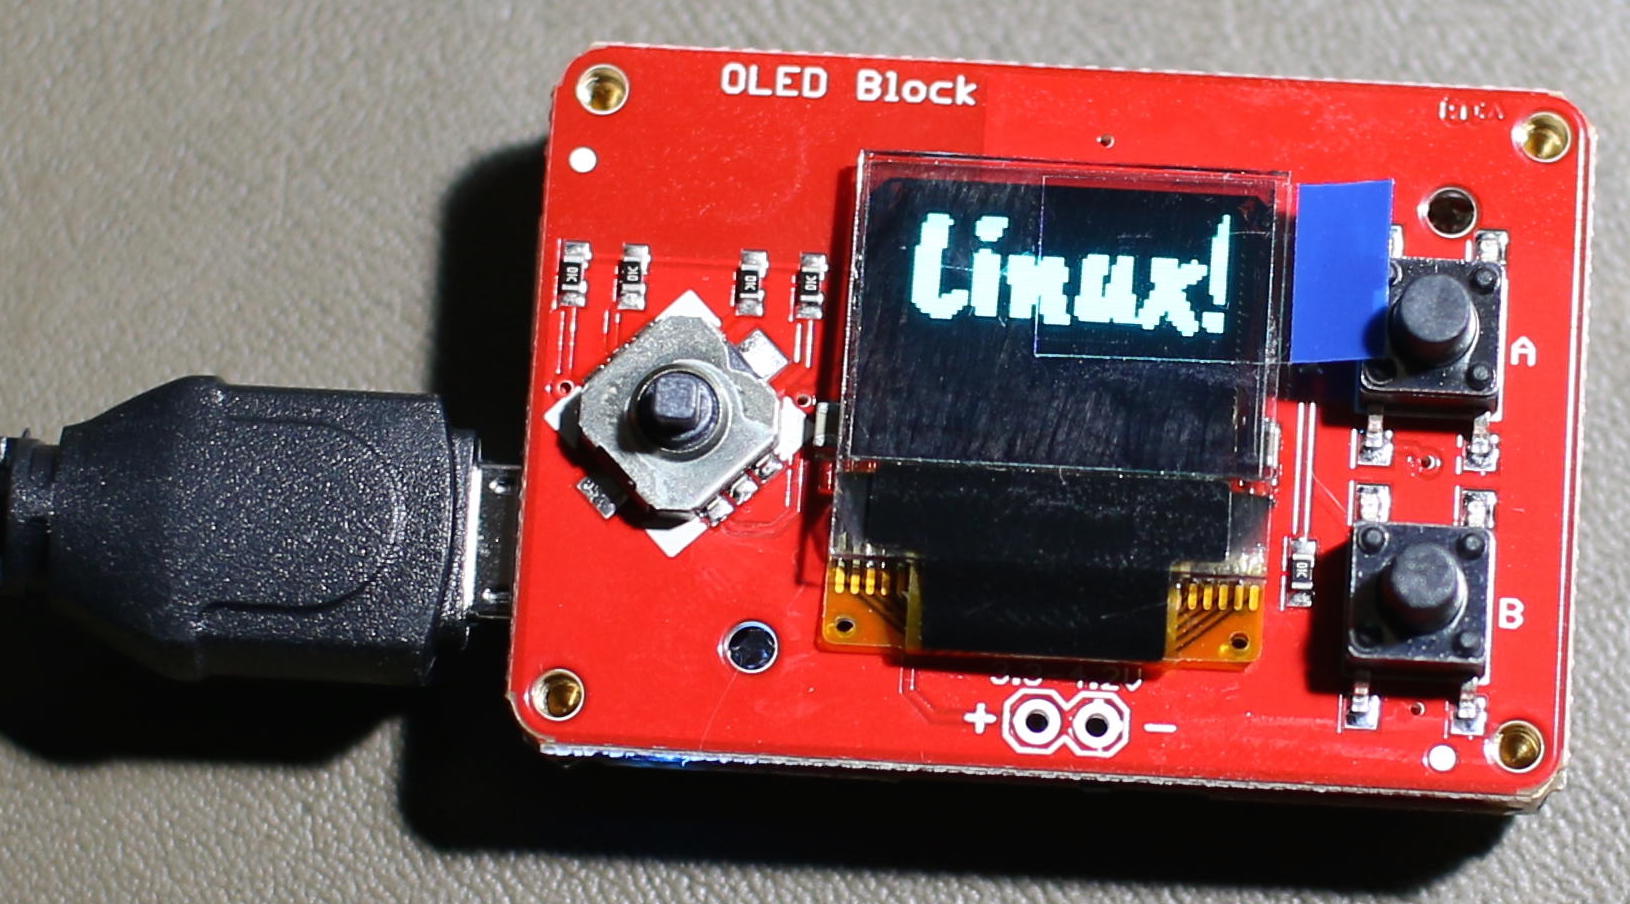
The SparkFun OLED block features a small 64×48 single color OLED screen (Figure 4). There is a small pong game as an example of using the screen that is quite cute.

Figure 4: SparkFun OLED Block.

Instead of using the lower level SPI or little screen library directly, it can be useful to have your application use Cairo as the rendering backbone and just ship the image off to the screen when needed. There are many advantages to doing this; the Cairo API is likely to be more widely known than the library for any specific screen, and you can change the screen out to something else without major changes to your program. Cairo also has access to great font rendering so you can browse free fonts such as those on Google Fonts and quickly start using them on your screen.

I’ll show how to do this from Node.js on the Edison. First, you’ll want to install a few modules including the interface to Cairo and the edison-oled node module as shown below.

edison:~/src/screen/node# npm install edison-oled
edison:~/src/screen/node# opkg install libcairo-dev
edison:~/src/screen/node# npm install canvas
edison:~/src/screen/node# npm install canvas-to-pixels

There are a few abstractions to set up as shown below. The Edison and OLED objects drive the particular screen and shouldn’t be used directly by your application. After objects are declared, the screen is cleared so that there is no unexpected data displayed before the application does any explicit screen update.

var fs = require('fs');
var path = require("path");

var runscreen = 1;
var forceBlackScreen = 0;

var canvas_width = 64;
var canvas_height = 48;
var Canvas = require('canvas')
, Image  = Canvas.Image
, Font   = Canvas.Font
, canvas = new Canvas( canvas_width, canvas_height )
, ctx    = canvas.getContext('2d');
var canvasToPixels = require('canvas-to-pixels');

var edison = require('edison-oled');
var oled = new edison.Oled();

function fontFile(name) {
 return path.join(__dirname, '/fonts/', name);
}

oled.begin();
oled.clear(0);
oled.display();
oled.setFontType(0);

The mydraw function is the core function where your application updates the screen to show what is going on. It is cairo only and doesn’t need to know anything about how to drive the OLED screen. In this case, I take advantage of the Edison to load and use an open font file to render the message “Linux!” at almost full screen.

var mydraw = function( cc, cb ) {

   var ctx = cc.getContext('2d');

   var myfont = new Font('CaveatBrush', fontFile('CaveatBrush-Regular.ttf'));
   ctx.addFont(myfont);
   ctx.font = 'normal 32px CaveatBrush';
   
   ctx.antialias = 0;
   ctx.fillStyle = '#000000'      
   ctx.fillRect(0,0,canvas_width,canvas_height);

   if( forceBlackScreen ) {
    cb();
    return;
   }

   var msg = 'Linux!';
   var te = ctx.measureText(msg);
   ctx.fillStyle = '#FFFFFF';
   ctx.fillText(msg, 0, te.actualBoundingBoxAscent);

   cb();
} 

The screen update is done every 200ms in an idle function. This idle function uses the mydraw function above to actually populate the Cairo Canvas with something interesting. The data from the Cairo Canvas is then converted over to binary pixel data using the oled object and the physical screen is updated. Notice that the r, g, b, and alpha values are all available to this idle function, so if you update to a color OLED screen then you can start taking advantage of that by updating this idle function copy out loop. The SIGINT callback clears the OLED screen to prevent junk from being left on it if the application is closed.

setInterval( function() {
   canvasToPixels({
    width:  canvas_width,
    height: canvas_height,
    js:     mydraw,
   }, function receivePixels( err, pixels ) {

    oled.clear();

    var normalArray = Array.prototype.slice.call(pixels);
    var len = normalArray.length;
    var i = 0, x = 0, y = 0;

    for( i=0; i < len; i+=4 ) {
        var r = normalArray[i+0];
        var g = normalArray[i+1];
        var b = normalArray[i+2];
        var a = normalArray[i+3];
        if( r > 1 || g > 1 || b > 1 ) {
        oled.pixel( x, y );
        }
        x++;
        if( x >= canvas_width ) {
        x = 0;
        y++;
        }
    }

    oled.display();
   });

}, 200 );


process.on('SIGINT', function() {
   // clean off the screen. no junk left.
   oled.clear();
   oled.display();

   process.exit();
});

Final Thoughts

The SparkFun blocks allow you to quickly snap together functionality and avoid having loose wires or making sure your connections do not accidentally put power to ground or other nasty things. There are pads on some Blocks to expose interrupts and configure the Block functionality by adding a dab of solder over some connections.

I want to thank SparkFun Electronics for supplying the Intel Edison and Blocks used in these articles.

Learn more about Linux through the free “Introduction to Linux” course from The Linux Foundation and edX.

Diversity Makes Projects More Successful

Open source projects are by their nature intended to be welcoming, pulling in contributions from many different volunteers. But in reality, open source and the tech industry in general often lack diversity. Speaking at the Open Source Leadership Summit in February, Mozilla’s Chief Innovation Officer Katharina Borchert told the crowd that working to bring ethnic, gender, and skill diversity to open source projects isn’t just the right thing to do because of moral grounds, it’s the right thing to do to make projects more successful.

“The next generation of people coming online and potentially willing — even eager — to engage with us, to contribute to our work, they’re not going to look like us, they’re not going to talk like us, and they’re going to have different expectations,” Borchert said.

“If we want to future-proof our communities, if we want to future-proof our work and everything that we really care about, we need to engage those people. We need to understand those people, and we need to be able to open up our communities and embrace those people,” she continued.

Several studies have outlined the benefits of bringing diverse viewpoints and backgrounds into an organization, and Borchert drew from a handful of those in her presentation. A study from McKinsey Research, for example, showed that across industry, gender diversity on a leadership team brough 15 percent higher financial returns than those without; those with ethnic diversity brought 35 percent higher returns.

Borchert also highlighted work from Karim Lakhani, a professor at Harvard Business School and a member of the Mozilla board of directors, who has dedicated his career to researching open innovation and Open Source communities.

“Open Source is really, really good at taking big problems and breaking them down into small tasks, which in turn allows a much larger pool of potential contributors to join,” Borchert said. “[Lakhani] has also identified some things that we’re not really good at. The main thing is we’re still not very good at avoiding group think and avoiding monocultures by bringing very different disciplines to the table. This is really, really important in the problem solving process.”

According to Borchert, open source projects tend to favor code over software and engineering over product. But, by excluding — whether consciously or not — contributors from other disciplines, projects are stunting their own growth potential.

“[Undervaluing non-coders] leads to undervaluing other roles that are also really important in the work that we do and that you need to have at the table if you do want to build really good products,” she said. “That’s researchers, UX designers, marketers, all the people that you do need if you really, really want to reach your customers. This actually has impact on our work.”

The solution is to deliberately design communities that are inclusive of people with varied backgrounds and skillsets. That doesn’t have to be a dreary exercise in forced cooperation, she said; the best results come from a fun, creative process that brings people on board and then retains them.

The key, she emphasized, is designing with specific inclusionary intentions in mind. “It is so hard to fix problems that have manifested overtime in established communities. We clearly need to do that, and we need to address the issues we have. We can avoid so much of the problems if we are very intentional about our values, our principles upfront.”

Borchert urged projects to publish their efforts and their findings and shine light on their mistakes as well as their successes, so that the community could start learning from each other. Such sharing of information, she said, is fundamental to success. “I have usually learned way more from the dramatic failures in my life than the great successes. It’s really important to share the lighthouses, to share the best practices, and to celebrate together.”

Watch the complete presentation below:

https://www.youtube.com/watch?v=Szm8x5nbezw?list=PLbzoR-pLrL6rm2vBxfJAsySspk2FLj4fM

Learn how successful companies gain a business advantage with open source software in our online, self-paced Fundamentals of Professional Open Source Management course. Download a free sample chapter now!

CoreOS Donates its rkt Container Technology to CNCF

At the same time that Docker offered to donate its containerd technology to the Cloud Native Computing Foundation (CNCF), CoreOS did the same with its competing rkt. Containerd (pronounced “container dee”) and rkt (say “rocket”) are both container runtime facilities, managing container images, a key component of cloud native computing. 

Both can work for any number of container managers, but the CNCF is probably best known as the open forum overseeing the development of Kubernetes, the container manager that Google devised in 2014 and donated to the CNCF in 2015.

Read more at SDxCentral

Avoid Complex Infrastructure When Building Simple Things

3 suggestions on how to stay simple and avoid complexity.

“You don’t understand — as soon as I install consul, set up service discovery for my microservices, build my own containerized continuous integration pipeline to build my code from source using my custom language-specific Dockerfile and set up my highly available production database my system for deploying code to production will be so simple.”

“How many people are in my team? Oh, it’s just me. But one day..”

Sigh ;-).

There’s a lot of complexity in things we use to reduce complexity. This is worth noticing. Three examples:

Read more at HackerNoon

ARM Antes Up For An HPC Software Stack

The HPC community is trying to solve the critical compute challenges of next generation high performance computing and ARM considers itself well-positioned to act as a catalyst in this regard. Applications like machine learning and scientific computing are driving demands for orders of magnitude improvements in capacity, capability and efficiency to achieve exascale computing for next generation deployments.

ARM has been taking a co-design approach with the ecosystem from silicon to system design to application development to provide innovative solutions that address this challenge. 

Read more at The Next Platform

IBM Chases Google, Microsoft with Kubernetes in the Cloud

This morning IBM announced the next logical step in its work with Docker containers: Kubernetes support on its Bluemix Container Service. Currently available in a limited beta, its feature set should match Google’s and Microsoft’s offerings.

Kubernetes, the Bluemix way

Previously, the default for managing Docker containers on Bluemix Container Service was to spin them up individually by hand or to use Bluemix’s container groups metaphor, where Bluemix directly managed multiple containers running the same image.

Read more at InfoWorld