Home Blog Page 585

Linux Foundation Key to Data Center Networking Evolution Says SDxCentral Report

Data centers must continue to evolve to handle the increasing network load generated by our frequent use of applications and services like voice activated network applications (OK Google, Alexa), video, mobile phones, IoT devices, and more, according to SDxCentral’s 2017 Next Gen Data Center Networking Report.

The report predicts that the big web companies like Facebook, Google, Microsoft, and Amazon will spur a lot of the innovation through organizations like The Linux Foundation, who will help drive these open source technologies into the broader ecosystem. Networking vendors will need to innovate and engage beyond the increasingly commoditized hardware platforms and find a balance between differentiating their solutions and collaborating in joint projects that could cannibalize their business.

To better understand why data center evolution is important for enterprises and communication service providers, SDxCentral looks at four key business drivers:

  • Increased competitiveness driving agility, cost-savings, and differentiation in IT
  • Increased consumption of video and media-rich content
  • Dominance of cloud and mobile applications
  • Importance of data — Big Data, IoT, and analytics

The report also looks at trends across several key components in Next Gen Data Center Networking (NGDCN), including:

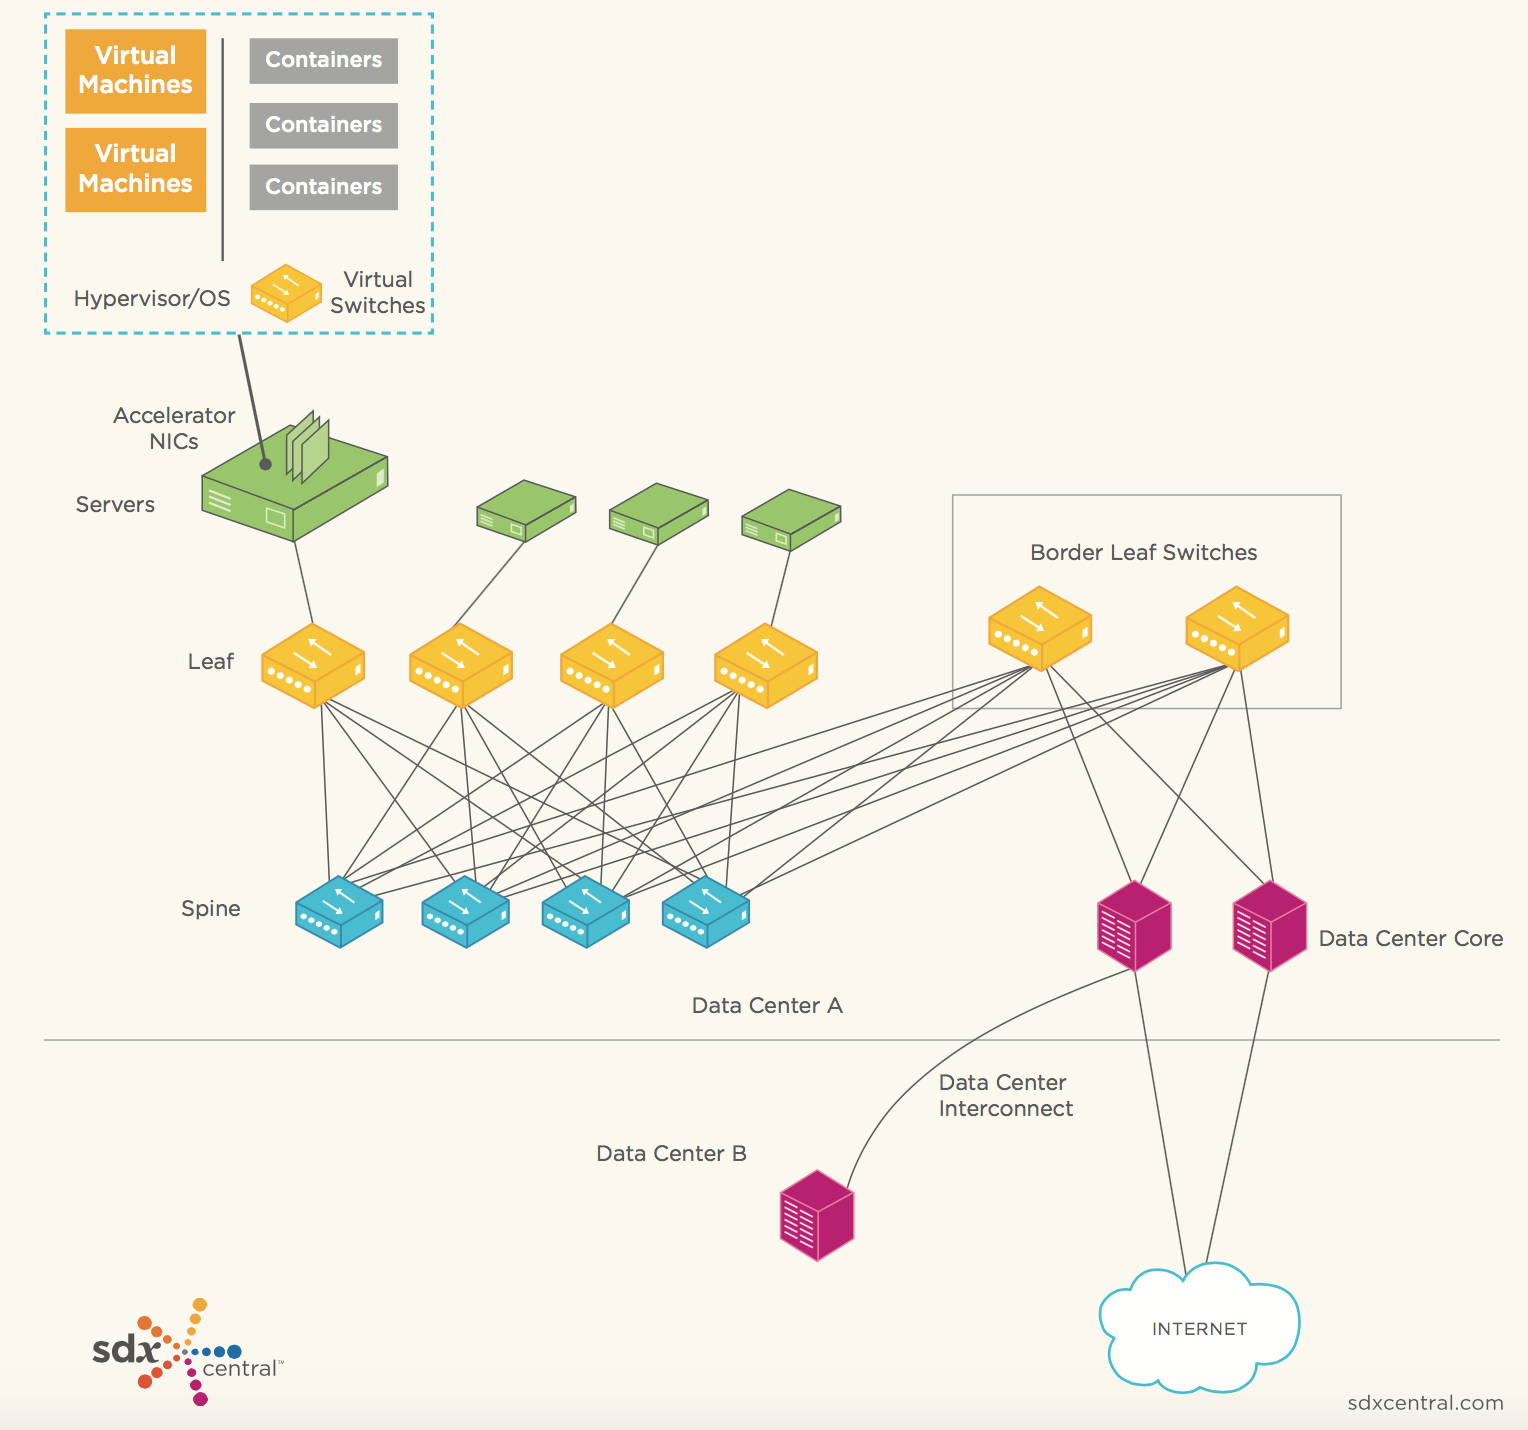
  • Virtual Switch (vSwitch): Maintaining good application performance can be dependent on performance of the vSwitch, and it’s an important part of the stack as the point of entry into the network for applications. The report indicated that “the most common vSwitch we find in most data centers today is Open vSwitch (OVS), a Linux Foundation project.”
  • Accelerator NICs: Accelerator or intelligent network interface cards (NICs) are becoming more popular with data center operators looking to get even better performance by pushing some of the packet processing onto this specialized hardware.
  • ToR, Leaf and Spine: Leaf switches (top-of-rack switches) and spine switches are part of most new network architectures designed for high-throughput connections between data center servers that are being used by the big web companies.
  • Data Center Interconnects (DCI): Connectivity between data centers typically required a separate, dedicated box devoted to DCI, but recent advances are eliminating the need for these dedicated solutions and allowing direct connections.

Next-Generation Data Center Networking
As NGDCN trends evolve, SDxCentral highlights a few important, overarching trends emerging over the past few years:

  • Trend 1: Disaggregation and White box
  • Trend 2: Virtualization, Overlays, and OpenStack
  • Trend 3: Two-stage Leaf-spine Clos-Fabrics with ECMP and Pods
  • Trend 4: SDN, Policy, and Intent
  • Trend 5: Big Data and Analytics

According to the report, “to understand how NGDCN will evolve, it’s important understand two major elements. Firstly, what major projects are underway at the web titans, and secondly, how these projects will migrate to new open-source organizations like Linux Foundation and the OCP (and for some components, the OpenStack Foundation).”

The Linux Foundation is poised to become a key player in NGDCN. “With the importance of open-source across networking and with increased importance of SDN, virtual switches and open software stacks in the NGDCN, the Linux Foundation has become highly relevant to NGDCN evolution. … We anticipate that over the course of 2017 and 2018, we will see significant innovations coming from these and other software projects that have big impacts on the NGDCN,” the report states.

Learn more about the future of networking at the Open Networking Summit April 3-6, with more than 75 sessions led by industry visionaries. Register now >>

Monitoring your Machine with the ELK Stack

This article will describe how to set up a monitoring system for your server using the ELK (Elasticsearch, Logstash and Kibana) Stack. The OS used for this tutorial is an AWS Ubuntu 16.04 AMI, but the same steps can easily be applied to other Linux distros.

There are various daemons that can be used for tracking and monitoring system metrics, such as StatsD or collectd, but the process outlined here uses Metricbeat, a lightweight metric shipper by Elastic, to ship data into Elasticsearch. Once indexed, the data can be then easily analyzed in Kibana.

As it’s name implies, Metricbeat collects a variety of metrics from your server (i.e. operating system and services) and ships them to an output destination of your choice. These destinations can be ELK components such as Elasticsearch or Logstash, or other data processing platforms such as Redis or Kafka.  

Installing the stack

We’ll start by installing the components we’re going to use to construct the logging pipeline — Elasticsearch to store and index the data, Metricbeat to collect and forward the server metrics, and Kibana to analyze them.

Installing Java

First, to set up Elastic Stack 5.x, we need Java 8:

sudo apt-get update
sudo apt-get install default-jre

You can verify using this command:

$ java -version

java version "1.8.0_111"
Java(TM) SE Runtime Environment (build 1.8.0_111-b14)
Java HotSpot(TM) 64-Bit Server VM (build 25.111-b14, mixed mode)

Installing Elasticsearch and Kibana

Next up, we’re going to dDownload and install the public signing key for Elasticsearch:

wget -qO - https://artifacts.elastic.co/GPG-KEY-elasticsearch | sudo apt-key add -

Save the repository definition to ‘/etc/apt/sources.list.d/elastic-5.x.list’:

echo "deb https://artifacts.elastic.co/packages/5.x/apt stable main" | sudo tee -a /etc/apt/sources.list.d/elastic-5.x.list

Update the system, and install Elasticsearch:

sudo apt-get update && sudo apt-get install elasticsearch

Run Elasticsearch using:

s

You can make sure Elasticsearch is running using:

curl localhost:9200

The output should look something like this:

{

 "name" : "OmQl9JZ",

 "cluster_name" : "elasticsearch",

 "cluster_uuid" : "aXA9mmLQS9SPMKWPDJRi3A",

 "version" : {

   "number" : "5.2.2",

   "build_hash" : "f9d9b74",

   "build_date" : "2017-02-24T17:26:45.835Z",

   "build_snapshot" : false,

   "lucene_version" : "6.4.1"

 },

 "tagline" : "You Know, for Search"

}

Next up, we’re going to install Kibana with:

sudo apt-get install kibana

To verify Kibana is connected properly to Elasticsearch, open up the Kibana configuration file at: /etc/kibana/kibana.yml, and make sure you have the following configuration defined:

server.port: 5601

elasticsearch.url: "http://localhost:9200"

And, start Kibana with:

sudo service kibana start

Installing Metricbeat

Our final installation step is installing Metricbeat:

sudo apt-get update && sudo apt-get install metricbeat

Configuring the pipeline

Now that we’ve got all the components in place, it’s time to build the pipeline. Our next step involves configuring Metricbeat — defining what data to collect and where to ship it to.

Open the configuration file at /etc/metricbeat/metricbeat.yml

In the Modules configuration section, you define which system metrics and which service you want to track. Each module collects various metricsets from different services (e.g. Apache, MySQL). These modules, and their corresponding metricsets, need to be defined separately. Take a look at the supported modules here.

By default, Metricbeat is configured to use the system module which collects server metrics, such as CPU and memory usage, network IO stats, and so on.

In my case, I’m going to uncomment some of the metrics commented out in the system module, and add the apache module for tracking my web server.

At the end, the configuration of this section looks as follows:

- module: system

 metricsets:

   - cpu

   - load

   - core

   - diskio

   - filesystem

   - fsstat

   - memory

   - network

   - process

 enabled: true

 period: 10s

 processes: ['.*']

- module: apache
 metricsets: ["status"]
 enabled: true
 period: 1s
 hosts: ["http://127.0.0.1"]

Next, you’ll need to configure the output, or in other words where you’d like to send all the data.

Since I’m using a locally installed Elasticsearch, the default configurations will do me just fine. If you’re using a remotely installed Elasticsearch, make sure you update the IP address and port.

output.elasticsearch:
 hosts: ["localhost:9200"]

If you’d like to output to another destination, that’s fine. You can ship to multiple destinations or comment out the Elasticsearch output configuration to add an alternative output. One such option is Logstash, which can be used to execute additional manipulations on the data and as a buffering layer in front of Elasticsearch.

Once done, start Metricbeat with:

sudo service metricbeat start

One way to verify all is running as expected is to query Elasticsearch for created indices:

curl http://localhost:9200/_cat/indices?v

You should see a list of indices, one being for metricbeat.

Analyzing the data in Kibana

Our last and final step is to understand how to analyze and visualize the data to be able to extract some insight from the logged metrics.

To do this, we first need to define a new index pattern for the Metricbeat data.

In Kibana (http://localhost:5601), open the Management page and define the Metricbeat index in the Index Patterns tab (if this is the first time you’re analyzing data to Kibana, this page will be displayed by default):

iDCsKGGi2WjP2JyF6zS6tpvQ2ZkJ1BFNnbm8H9PR

Select @timestamp as the time-field name and create the new index pattern.

Opening the Discover page, you should see all the Metricbeat data being collected and indexed.

8737wCL_uLsHP4RfNUIL472Xygi8FQNrKbrolGeN

If you recall, we are monitoring two types of metrics: system metrics and Apache metrics. To be able to differentiate the two streams of data, a good place to start is by adding some fields to the logging display area.

Start by adding the ‘metricset.module’ and ‘metricset.name’ fields.

_sawsHLUVRGTnj3a-NHXZ78RX3jRCp3mUPBieUoL

Visualizing the data

Kibana is notorious for its visualization capabilities. As a simple example, let’s create a simple visualization that displays CPU usage over time.

To do this, open the Visualize page and select the area chart visualization type.

We’re going to compare, over time, the user and kernel space. Here is the configuration and the end-result:

XDo-R_duPV2oqI3w8nJwkqBOoNYCLZSpi02rxCln

Another simple example is a look at how our CPU is performing over time. To do this, we will pick the line chart visualization this time and use an average aggregation of the ‘system.process.cpu.total.pct’ field.  

LB8xY5rZ71A8NF6QtN5GP2r8yYBRDkzZtEnmjtDl

Or, you can set up a series of metric visualizations to show single stats on critical system metrics, such as the one below showing the amount of free memory.

uBoYkrG-sj6CTjsoM3r9CaO8pt2pXO5nL8wwlDmY

You’ll need to edit the field in the Management page to have the metric display the correct measuring units.
Once you have a series of these visualizations built up, you can combine them all into a nice monitoring dashboard. Side note – if you’re using the Logz.io ELK Stack, you’ll find a Metricbeat dashboard ELK Apps, a library of free pre-made visualizations and dashboards for different data types.

Summing it up

In just a few steps you can have a good comprehensive picture of how well your system is performing. Starting from memory consumption, through to CPU usage and network packets — ELK is a very useful stack to have pn your side, and Metricbeat is a sueful tool to use if its server metric monitoring you’re after.  

I highly recommend setting up a local dev environment to test this configuration, and compare it with the other metric reporting tools. 

Monitor SATA and SSD Health with SMART

Smartmontools helps you keep an eye on the health of your hard disk and SSD drives. SMART is the Self-Monitoring, Analysis and Reporting Technology built-in to modern drives, and smartmontools reads the SMART data. It’s not 100 percent accurate at predicting imminent drive failure, so, as you should always do, keep current backups.

Whatever Linux you use, the package name is probably smartmontools. The main command that you will use is smartctl. Install it and then query basic information about one of your drives:

$ sudo smartctl -i /dev/sda

This should be uneventful, as it prints basic information about your drive including model number, serial number, firmware version, size, sector size, and if it is SMART-enabled. But I got this little surprise:

==> WARNING: Using smartmontools or hdparm with this
drive may result in data loss due to a firmware bug.
****** THIS DRIVE MAY OR MAY NOT BE AFFECTED! ******
Buggy and fixed firmware report same version number!
See the following web pages for details:
http://knowledge.seagate.com/articles/en_US/FAQ/223571en
http://www.smartmontools.org/wiki/SamsungF4EGBadBlocks

Just what everyone needs, an ambiguous warning that you may have just wrecked your hard drive. The Seagate article is enlightening:

“If the host issues an identify command during an action of writing data in NCQ, the data’s writing can be destabilized, and can lead to data loss.”

I was being sarcastic when I said it was enlightening. What does that even mean? You can download a firmware patch from that page, but it’s an .exe file, which only runs in Windows. There are ways to extract an image from an .exe file that you can use in Linux, but it makes me tired and exasperated even thinking about it. Check out Flashing BIOS from Linux in the Arch Linux Wiki to learn more about forcing .exe files to be usable on real operating systems.

So, getting back to the warning. The Smartmontools Wiki page offers actual information:

“Problem: If the system writes to this disk and smartctl -a (5.40) is used at the same time, write errors are reported and bad blocks appear on the disk.”

This is an issue with the disk firmware and not smartmontools, and it applies to hdparm as well. Chances are it’s not an issue anymore:

“Update: According to Samsung Support, HD204UI drives manufactured December 2010 or later include the firmware patch…The warning will also be printed when the patch is already installed!”

So how do you know if the patch is installed? Check the label on your hard drive, which should have the date of manufacture. If it’s an older drive then you must decide if you want to apply the patch just to keep smartmontools happy.

One More Time

Using computers involves a lot of detours. Let’s get back on track and look at the basic information that smartctl prints, using a non-Samsung drive:

$ sudo smartctl -i /dev/sdb
smartctl 6.5 2016-01-24 r4214 [x86_64-linux-4.4.0-64-generic] (local build)
Copyright (C) 2002-16, Bruce Allen, Christian Franke, www.smartmontools.org

=== START OF INFORMATION SECTION ===
Model Family:     Seagate Barracuda 7200.14 (AF)
Device Model:     ST2000DM001-1CH164
Serial Number:    Z240S0F3
LU WWN Device Id: 5 000c50 05080924c
Firmware Version: CC26
User Capacity:    2,000,398,934,016 bytes [2.00 TB]
Sector Sizes:     512 bytes logical, 4096 bytes physical
Rotation Rate:    7200 rpm
Form Factor:      3.5 inches
Device is:        In smartctl database [for details use: -P show]
ATA Version is:   ATA8-ACS T13/1699-D revision 4
SATA Version is:  SATA 3.0, 6.0 Gb/s (current: 6.0 Gb/s)
Local Time is:    Mon Mar  6 10:56:00 2017 PST
SMART support is: Available - device has SMART capability.
SMART support is: Enabled

This is a nice bundle of useful information, containing everything but the date of manufacture. Sometimes, you can visit the manufacturer’s site and use the serial number to learn if the drive is still under warranty, and decode the date information. If SMART support is not enabled then enable it:

$ sudo smartctl -s on /dev/sdb
smartctl 6.5 2016-01-24 r4214 [x86_64-linux-4.4.0-64-generic] (local build)
Copyright (C) 2002-16, Bruce Allen, Christian Franke, www.smartmontools.org

=== START OF ENABLE/DISABLE COMMANDS SECTION ===
SMART Enabled.

smartctl -s off [device] disables it.

Want to see a complete data dump? Use the -x option:

$ sudo smartctl -x /dev/sdb

Health Check

Let’s run a quick health check:

$ sudo smartctl -H /dev/sdb                                                                                                   
smartctl 6.5 2016-01-24 r4214 [x86_64-linux-4.4.0-64-generic] (local build)                                                  
Copyright (C) 2002-16, Bruce Allen, Christian Franke, www.smartmontools.org                                                  
                                                                                                                             
=== START OF READ SMART DATA SECTION ===                                                                                     
SMART overall-health self-assessment test result: PASSED

Hurrah! It passed. Use -Hc to see more details. Now, just for fun, check the logfile for errors:

$ sudo smartctl -l error /dev/sdb
smartctl 6.5 2016-01-24 r4214 [x86_64-linux-4.4.0-64-generic] (local build)
Copyright (C) 2002-16, Bruce Allen, Christian Franke, www.smartmontools.org

=== START OF READ SMART DATA SECTION ===
SMART Error Log Version: 1
No Errors Logged

Well, this sure is turning into a boring exercise. Which is fine with me. Some forms of boredom are good. What do you do if there are errors? Consult the Smartmontools FAQ which ones are significant.

Running Self-Tests

You can run a short and a long self-test: smartctl -t short /dev/sdb and smartctl -t long /dev/sdb. smartctl tells you how long the test will run. You won’t get any notifications when it’s finished. Check the results by reading the log:

$ sudo smartctl -l selftest /dev/sdb
smartctl 6.5 2016-01-24 r4214 [x86_64-linux-4.4.0-64-generic] (local build)
Copyright (C) 2002-16, Bruce Allen, Christian Franke, www.smartmontools.org

=== START OF READ SMART DATA SECTION ===
SMART Self-test log structure revision number 1
Num  Test_Description Status                Remaining  LifeTime(hours)  LBA_of_first_error
# 1  Short offline   Completed without error       00%      5357

smartd Daemon and Notifications

You can run smartd, the SMART daemon, to continually monitor your drives and email you to report possible troubles. On Debian/Ubuntu/etc. you’ll edit /etc/default/smartmontools to automatically launch smartd at startup, and edit /etc/smartd.conf to configure monitoring and notifications. Most distros install /etc/smartd.conf, and you’ll use your distro’s method of launching smartd at boot.

Learn more about Linux through the free “Introduction to Linux” course from The Linux Foundation and edX.

Critical Vulnerability Under “Massive” Attack Imperils High-Impact Sites

In a string of attacks that have escalated over the past 48 hours, hackers are actively exploiting a critical vulnerability that allows them to take almost complete control of Web servers used by banks, government agencies, and large Internet companies.

The code-execution bug resides in the Apache Struts 2 Web application framework and is trivial to exploit. Although maintainers of the open source project patched the vulnerability on Monday, it remains under attack by hackers who are exploiting it to inject commands of their choice into Struts servers that have yet to install the update, researchers are warning. Making matters worse, at least two working exploits are publicly available.

Read more at Ars Technica

How to Format Storage Devices in Linux

Managing storage devices — whether they are internal hard drives, SSDs, PCIe SSDs, or external USB devices — is always a tricky task. With a tiny mistake, you may lose data or wrongly format your drive in a way that can lead to data corruption. In this article, I will talk about some of the basics of storage devices on Linux. The article is aimed at beginners and new users of Linux.

There are many graphics tools to manage your hard drive. If you happen to use Gnome, then the Disks tool is quite useful. However, every once in a while I come across issues where it throws errors and fails to format a drive. I prefer to use the command line, as it’s much easier and fail safe.

How to find what is connected or plugged to your system

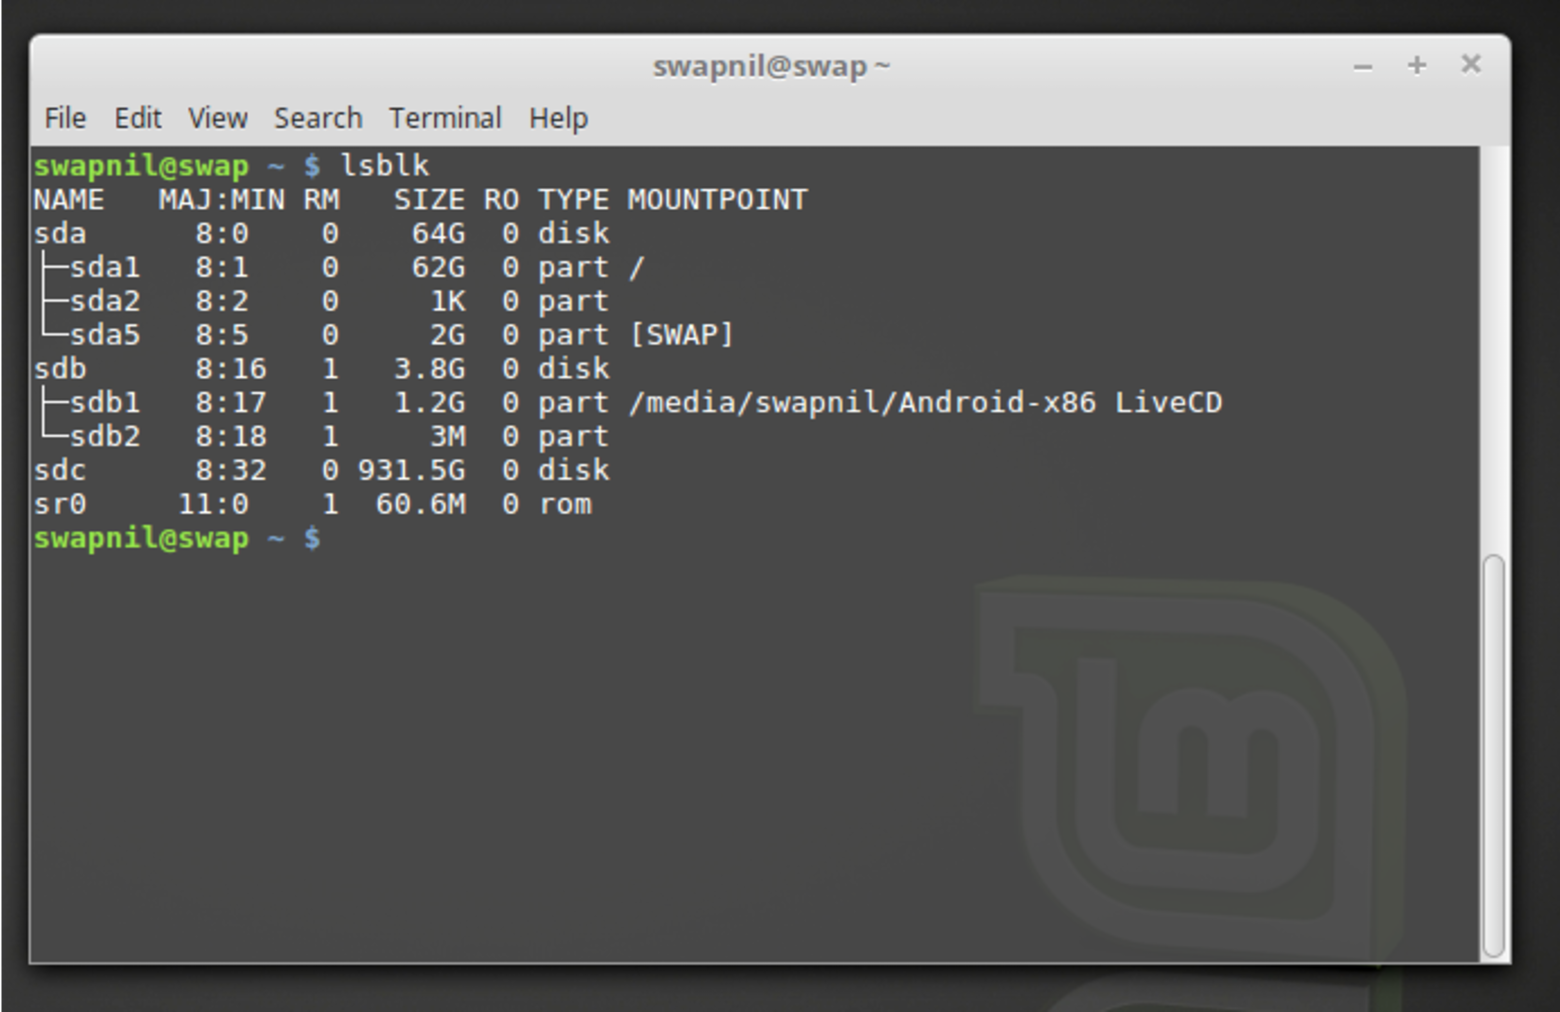
Using ‘lsblk’ is the simplest and easiest way to find all block devices connected to your system. As you can see, the lsblk command is showing me my SSD ‘sda’ where Linux Mint 18.1 is installed, ‘sdb’ is a USB Flash Drive, and ‘sdc’ is 1TB internal hard drive.

Understanding the lsblk output

In the figure above, the NAME column gives out the name of the device (it’s not consistent and can change based on which device was mounted first). ‘sda’, ‘sdb’, ‘sdc’ etc. are the block device names and ‘sda1’, ‘sda2’… denote the partitions on each device. MAJ:MIN denotes the major and minor device number. RM tells whether the device is removable, and in this example, you can see that the USB drive ‘sdb’ is a removable device.

Obviously, the SIZE column tells about usable storage space on the device. RO tells whether the device is read only, such as a DVD drive or write protected Flash drive. TYPE tells whether it’s a disk or partition, and you can see that block device name with numbers ‘sda1, sda2…’ are marked as partitions. The last column tells about the mount point.

The lsblk command is capable of giving out more information about storage devices, but we are keeping our focus on formatting a device.

Format a drive completely with a brand new partition table

There is no dearth of quality tools in the Linux world, and we tend to use the ones we like. In this tutorial, I am using ‘parted’ as it’s easy to use and can handle both MBR and GPT partitioning tables, but feel free to use your favorite partitioning tool. I will be formatting a 3.8GB USB flash drive. The procedure can be used on any storage device, external or internal.

sudo parted /dev/sdb

Doublecheck to make sure to add the block device you want to format; otherwise, parted will run on ‘sda’ or the drive where your OS is installed and you may end up with a broken system. The tool is extremely powerful and choosing the wrong device may lead to valuable data loss, so please use caution while formatting your drives.

After entering the password, you will notice (parted) added, which means you are now inside the parted utility.

Now we have to create a new partition table. There is good old MBR (master boot record) and newer GPT (guid partition table). Comparison between the two is beyond the scope of this story. In this example, we will use MBR.

(parted) mklabel msdos 

Here ‘mklabel’ creates the partition table and ‘msdos’ will use MBR. Now we can create partitions. This is the basic format of the command:

(parted) mkpart ‘type of partition’ ‘file system’ start end

If I want to use all the space and create one big partition I will run this command:

(parted) mkpart primary ext4 1MiB 100%

Here 100% means it will use all the available space. But if I want to create more than one partition, I will run this command:

(parted) mkpart primary ext4 1MiB 2GB

Here it will create a partition with 2GB storage. Next, we’ll create another partition, but because we already have one partition, the end point of previous partition is now the starting point of the next partition.

(parted) mkpart primary ext4 2GB 5GB

This command will create a second partition of 3GB. If you want to create one more partition for the remaining space, you know the end point and the start point:

(parted) mkpart primary ext4 5GB 100%

You can replace ‘ext4’ with desired file type: ntfs, vfat, btrfs…

To see how the partitioning has worked, run the print command:

(parted) print

It will display the partitions you created. If everything looks as expected, you can exit the partitioning tool by typing ‘quit’:

(parted) quit

Running the lsblk command will show the newly created partitions. We need to now format these partitions before we mount and use them. In my machine, there are now three partitions on sdb: sdb1, sdb2, sdb3. We will format each with ext4.

sudo mkfs.ext4 /dev/sdb1

Repeat the same step for each drive — just change the block device name and number.

Now, your drives are formatted. If it’s an external drive like a USB drive, just unplug and plug it to mount it.

Learn more about Linux through the free “Introduction to Linux” course from The Linux Foundation and edX.

How Safe Are Blockchains? It Depends.

To understand the inherent security risks in blockchain technology, it’s important to understand the difference between public and private blockchains.

One of the first decisions to make when establishing a private blockchain is about the network architecture of the system. Blockchains achieve consensus on their ledger, the list of verified transactions, through communication, and communication is required to write and approve new transactions. This communication occurs between nodes, each of which maintains a copy of the ledger and informs the other nodes of new information: newly submitted or newly verified transactions. Private blockchain operators can control who is allowed to operate a node, as well as how those nodes are connected; a node with more connections will receive information faster.

Read more at Harvard Business Review

Three Overlooked Lessons about Container Security

I’ve just joined container security specialists Aqua Security and spent a couple of days in Tel Aviv getting to know the team and the product. I’m sure I’m learning things that might be obvious to the seasoned security veteran, but perhaps aren’t so obvious to the rest of us! Here are three aspects I found interesting and hope you will too, even if you’ve never really thought about the security of your containerized deployment before:

#1: Email Addresses in Container Images

A lot of us put contact email information inside our container images. Even if the MAINTAINER directive in Docker files is deprecated in favor of using the more generic LABEL, it’s natural to think that users would find it helpful to be able to contact the image author.

Read more at The New Stack

Introduction to gRPC

The hot new buzz in tech is gRPC.  It is a super-fast, super-efficient Remote Procedure Call (RPC) system that will make your microservices talk to each other at lightspeed, or at least that’s what people say.  So this article will take a quick look at what it is, and how or when it can fit into your services.

What is gRPC

gRPC is a RPC platform developed by Google which was announced and made open source  in late Feb 2015.  The letters “gRPC” are a recursive acronym which means, gRPC Remote Procedure Call.

gRPC has two parts, the gRPC protocol, and the data serialization. By default gRPC utilizes Protobuf for serialization, but it is pluggable with any form of serialization you wish to use, with some caveats, which I will get to later.

Read more at Container Solutions

Secrets of Maintainable Codebases

You should write maintainable code. I assume people have told you this, at some point.  The admonishment is as obligatory as it is vague. So, I’m sure, when you heard this, you didn’t react effusively with, “oh, good idea — thanks!”

If you take to the internet, you won’t need to venture far to find essayslists, and stack exchange questions on the subject. As you can see, software developers frequently offer opinions on this particular topic. And I present no exception; I have little doubt that you could find posts about this on my own blog.

So today, I’d like to take a different tack in talking about maintainable code. Rather than discuss the code per se, I want to discuss the codebase as a whole. What are the secrets to maintainable codebases? What properties do they have, and what can you do to create these properties?

Read more at DZone

Asus Tinker Board Review: First Impressions

The Asus Tinker Board is a new ARM-based single-board computer (SBC) which stands out from the crowd. It’s tiny, affordable, with strong performance, and targeted at the DIY/hobbyist market. Essentially a complete PC — motherboard, CPU, GPU, system memory and more — all in one package, it is priced at £54.99.

SBC’s are very much in vogue. With sales exceeding 10 million units, the Raspberry Pi is the most popular British computer ever produced. The Pi has retained its position despite other manufacturers jumping on the bandwagon producing similar computers. None of its competitors have, to date, come close rivaling its popularity partly because there’s more software and support available for the Pi. Things could change with the Tinker Board. And not just because the computer is developed by Asus, the 4th-largest PC vendor.

Read more at OSS Blog

https://www.ossblog.org/asus-tinker-board-review-first-impressions/