Home Blog Page 662

Microsoft Steps Up Its Commitment to Open Source

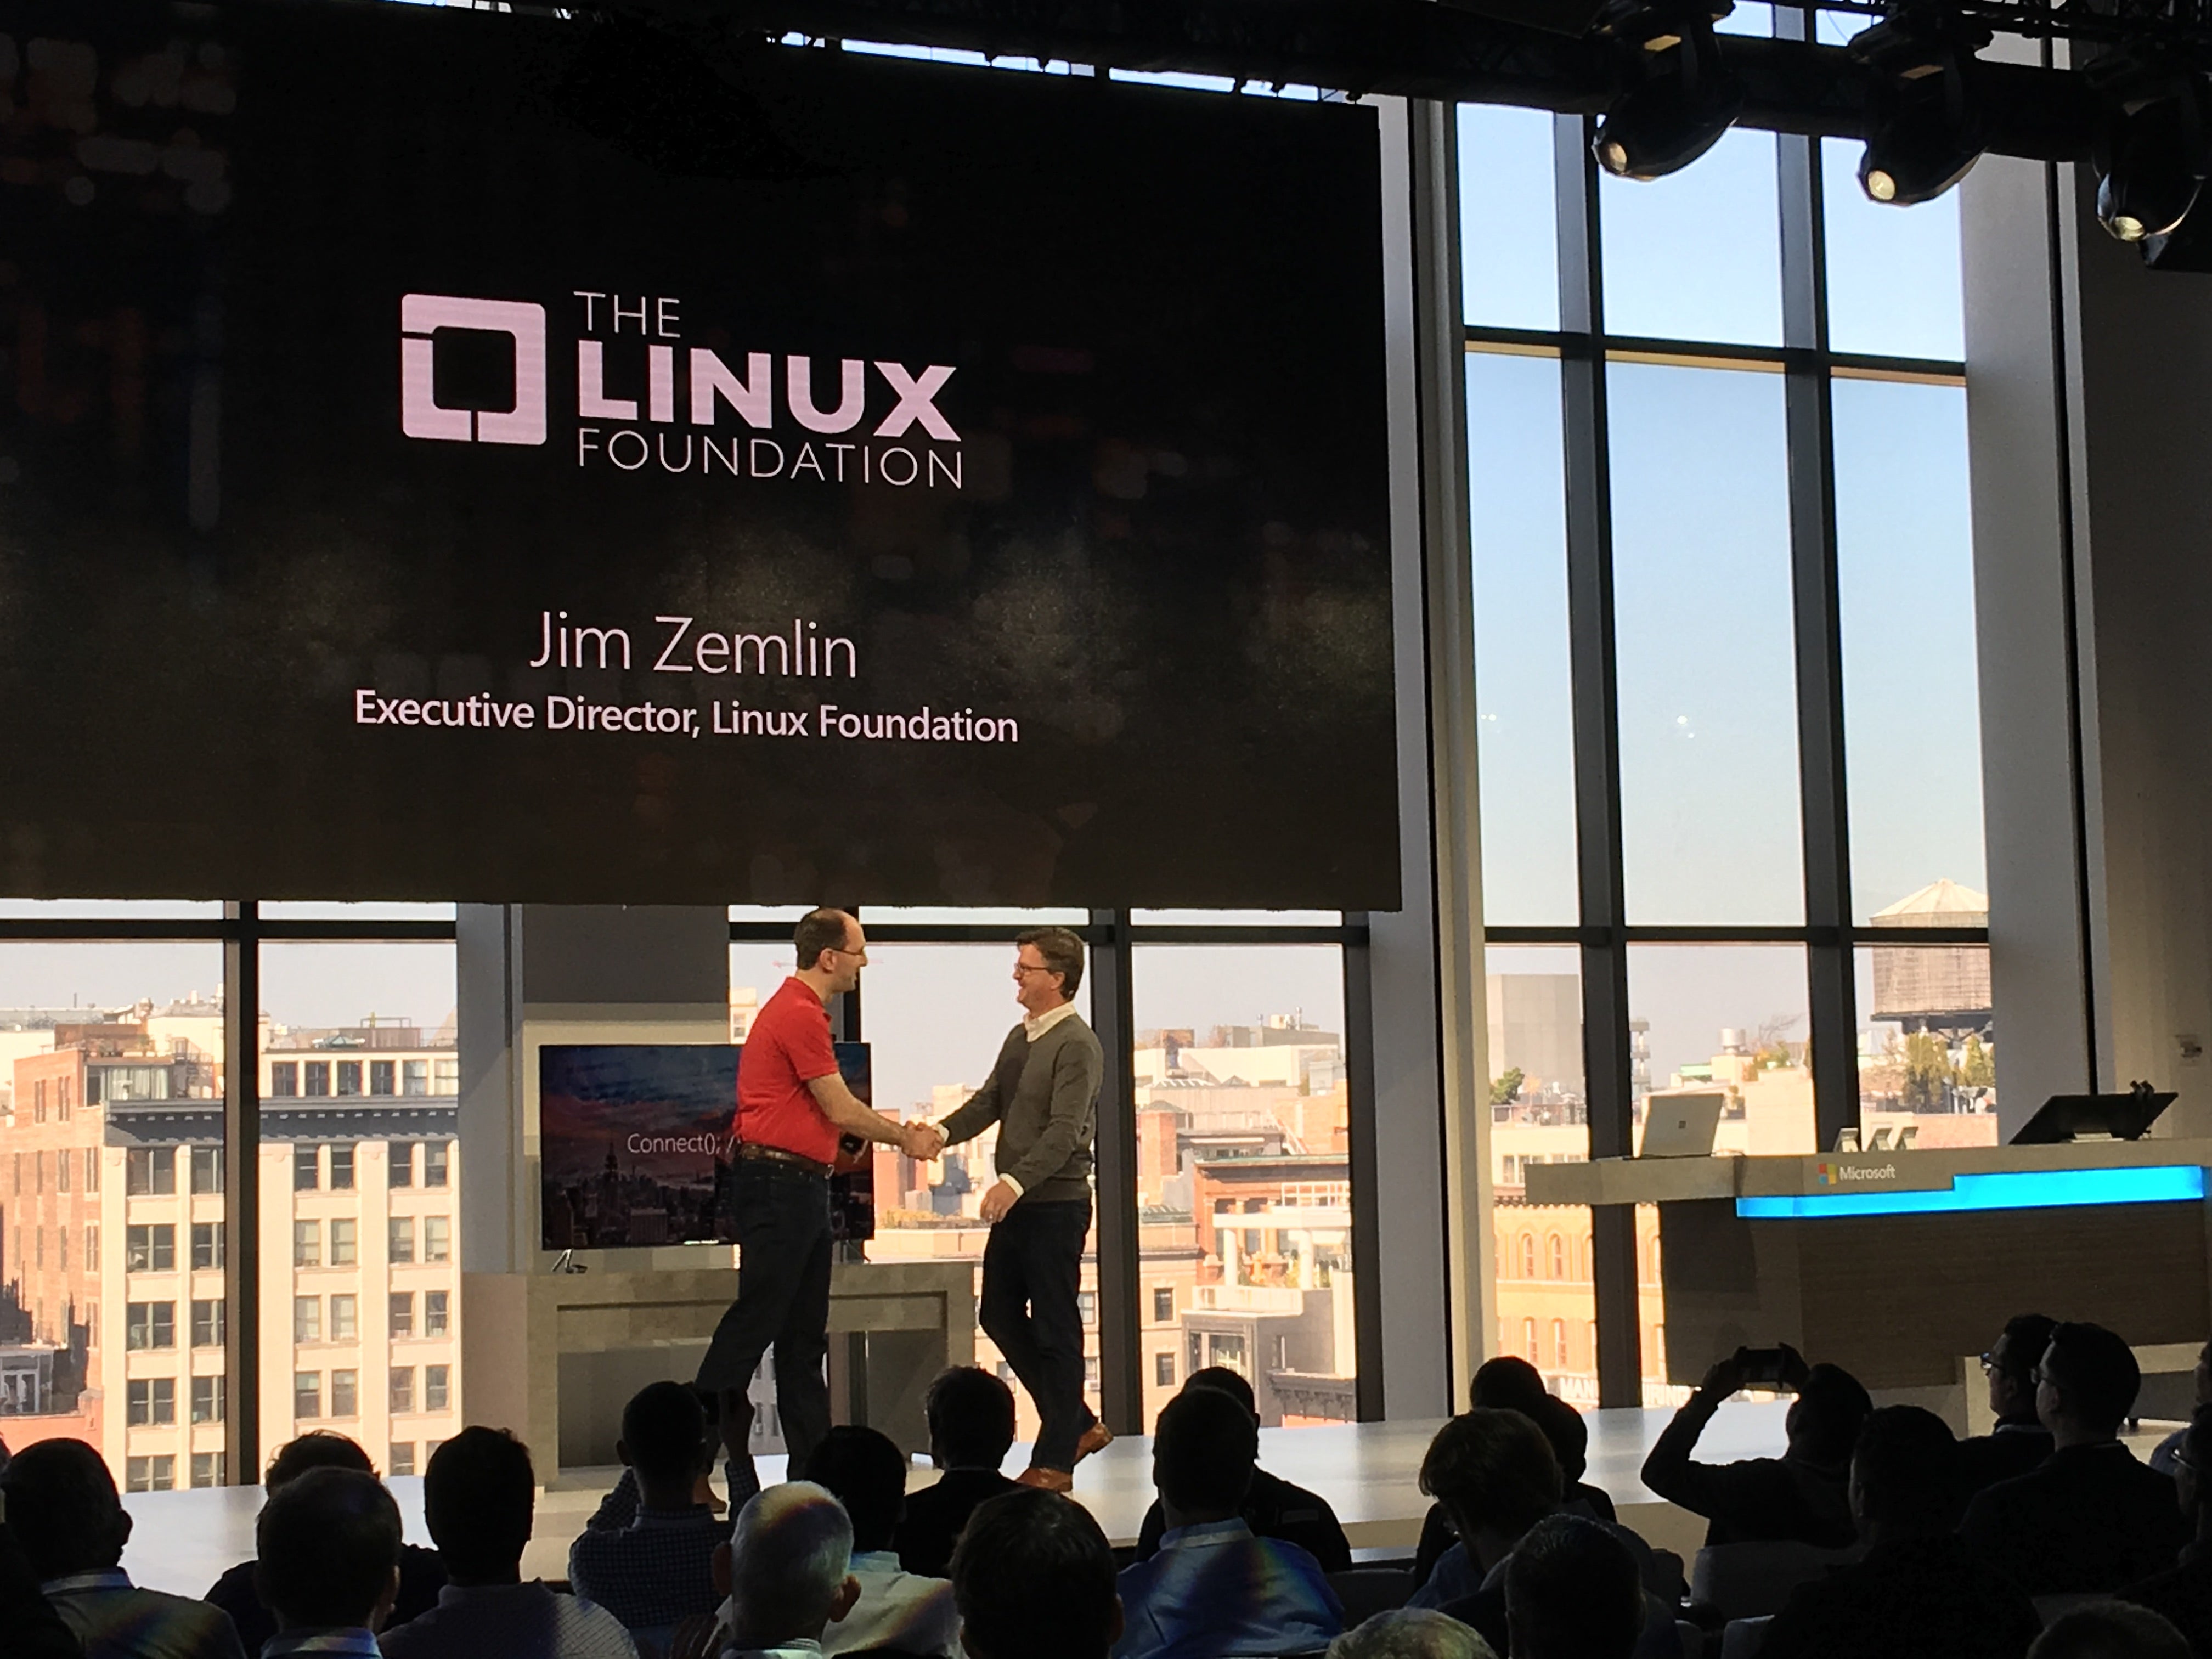
Today The Linux Foundation is announcing that we’ve welcomed Microsoft as a Platinum member. I’m honored to join Scott Guthrie, executive VP of Microsoft’s Cloud and Enterprise Group, at the Connect(); developer event in New York and expect to be able to talk more in the coming months about how we’ll intensify our work together for the benefit of the open source community at large.


Microsoft is already a substantial participant in many open source projects and has been involved in open source communities through partnerships and technology contributions for several years. Around 2011 and 2012, the company contributed a large body of device driver code to enable Linux to run as an enlightened guest on Hyper-V. Microsoft has an engineering team dedicated to Linux kernel work, and since that initial contribution, the team has contributed improvements and new features to the driver code for Hyper-V on a consistent basis.


Over the past two years in particular, we’ve seen that engineering team grow and expand the range of Linux kernel areas it’s working on to include kernel improvements that aren’t specifically related to Microsoft products. The company is also an active member of many Linux Foundation projects, including Node.js Foundation, R Consortium, OpenDaylight, Open API Initiative and Open Container Initiative. In addition, a year ago we worked with Microsoft to release a Linux certification, Microsoft Certified Solutions Associate Linux on Azure.


The open source community has gained tools and other resources as Microsoft has open sourced the .NET Core, contributed OpenJDK, announced Docker support in Windows Server, announced SQL on Linux, added the ability to run native Bash on Ubuntu on Windows, worked with FreeBSD to release an image for Azure, and open sourced Xamarin’s software development kit and PowerShell. The company supports Red Hat, SUSE, Debian and Ubuntu on Azure. Notably, Microsoft is a top open source contributor on GitHub.


The Linux Foundation isn’t the only open source foundation Microsoft has committed to in 2016: in March, the company joined the Eclipse Foundation. A Microsoft employee has served as the Apache Software Foundation’s president for three years.


Linux Foundation membership underscores what Microsoft has demonstrated time and again, which is that the company is evolving and maturing with the technology industry. Open source has become a dominant force in software development–the de facto way to develop infrastructure software–as individuals and companies have realized that they can solve their own technology challenges and help others at the same time.


Membership is an important step for Microsoft, but it’s perhaps bigger news for the open source community, which will benefit from the company’s sustained contributions. I look forward to updating you over time on progress resulting from this relationship.


Monitoring Network Load With nload: Part 1

On a continually changing network, it is often difficult to spot issues because of the amount of noise generated by expected network traffic. Even when communications are seemingly quiet, a packet sniffer will display screeds of noisy data. That data might be otherwise unseen broadcast traffic being sent to all hosts willing to listen and respond on a local network.

Make no mistake, noise on a network link can cause all sorts of headaches, because it can be impossible to identify trends quickly, especially if a host or the network itself is under attack. Packet sniffers will clearly display more traffic for the busiest connections, which ultimately obscures the activities of less busy hosts.

You may have come across the excellent nearly real-time networking monitoring tool, iftop, in the past. It uses ncurses via a console to display a variety of highly useful bar graphs and even accommodates regular expressions. An alternative to iftop is a powerful console-based tool called nload. Such network monitoring tools can really save the day if you need to analyze traffic on your networks in a hurry.

Background

In the past when I’ve been tasked with maintaining critical hosts, I’ve left the likes of iftop and nload running in a console throughout my working day. Spotting real-time spikes is essential if you’re struggling for bandwidth capacity or if you suspect that a specific host might be attacked thanks to historical attempts.

Thankfully, with nearly real-time graphical interfaces — even displayed over a standard console — there’s little eyestrain involved either. During times of heightened stress, such as when a host was being attacked, I’ve used these tools in one window alongside other console windows. That way I can simultaneously show the continually changed output of network-sniffing tools in both a text and a graphical form. I find that by running different filters through each tool and changing them periodically as my field of focus evolves means that digging down into the data that is of most interest is much easier. Ultimately, I end up with a clear picture of who is using the network and, most importantly, for what purpose.

Installation

The nload packages can be found in a number of software repositories. On Debian derivatives, you can use this command to trigger your package manager’s installation process:

# apt-get install nload

On Red Hat derivatives, use this command:

# yum install nload

In the same way that iftop uses the “ncurses” package to output “graphics” to your console without the need of a GUI, the flexible nload switched to using ncurses, too, back in 2001. Your package manager should take care of any dependencies in this regard so there’s no extra package installation work involved.

Look And Feel

Once you have a working installation, all you need to do to run the package is use this command:

# nload

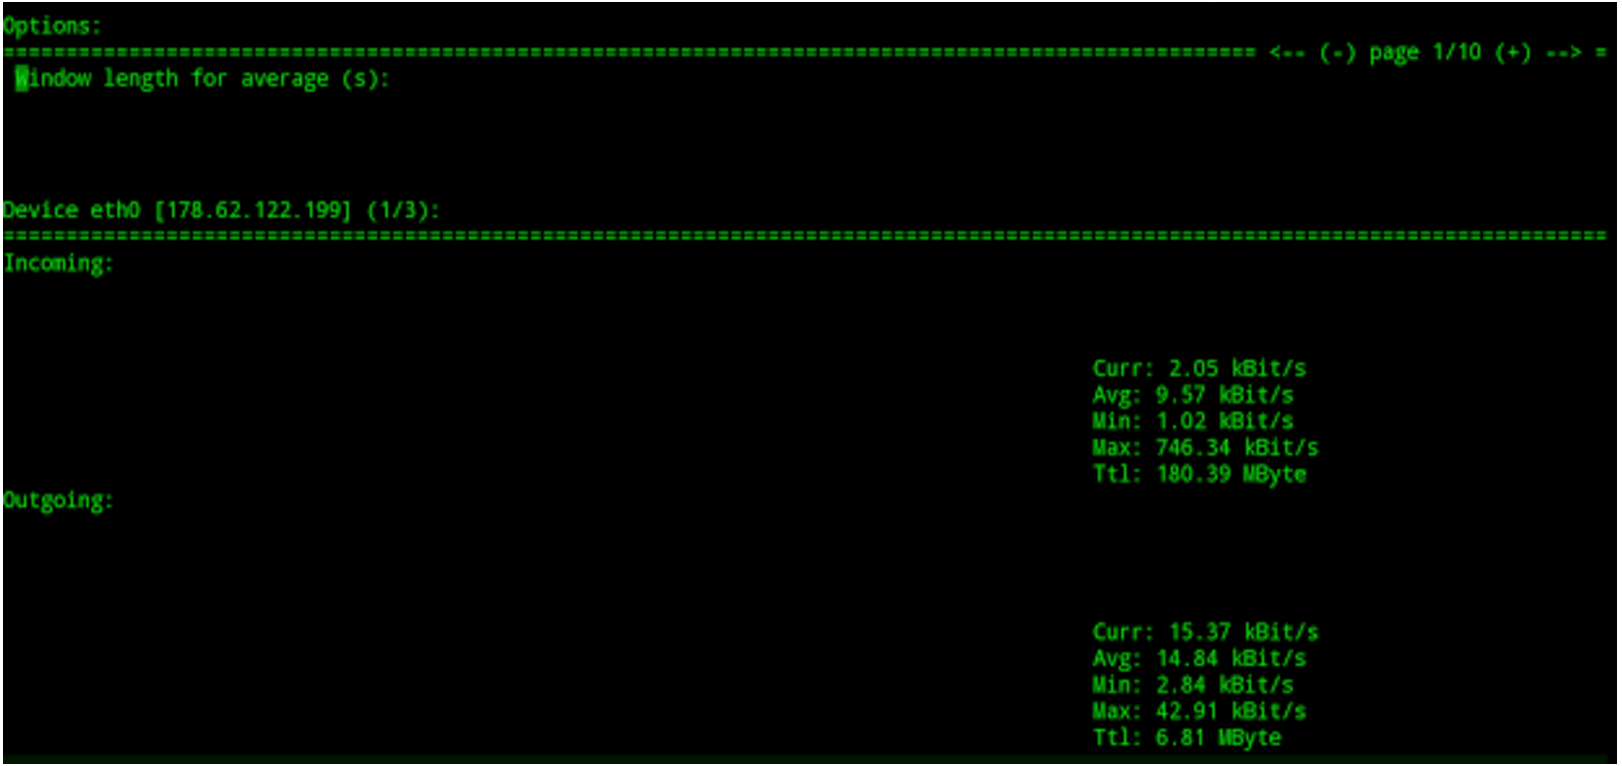
The results of such a command is the simple but useful output as shown in Figure 1.

Figure 1: The load on “eth0” interface using ingress and egress displays.

The ability to split a single console window into two parts, one half for ingress (inbound) traffic and the other for egress (outbound) traffic is clearly of significant use. The clarity you immediately gain is invaluable, especially if you’re trying to diagnose an attack of some description. Also shown in Figure 1, at the top, are the adjustable options to alter your display on the fly, without stopping nload in its tracks.

If we only wanted to focus on one specific network interface, then we could run nload as follows:

# nload eth1

You can, however, add more than one network interface to the same console window for a useful comparison. In this case, we would use the following command:

# nload -m eth0 eth1

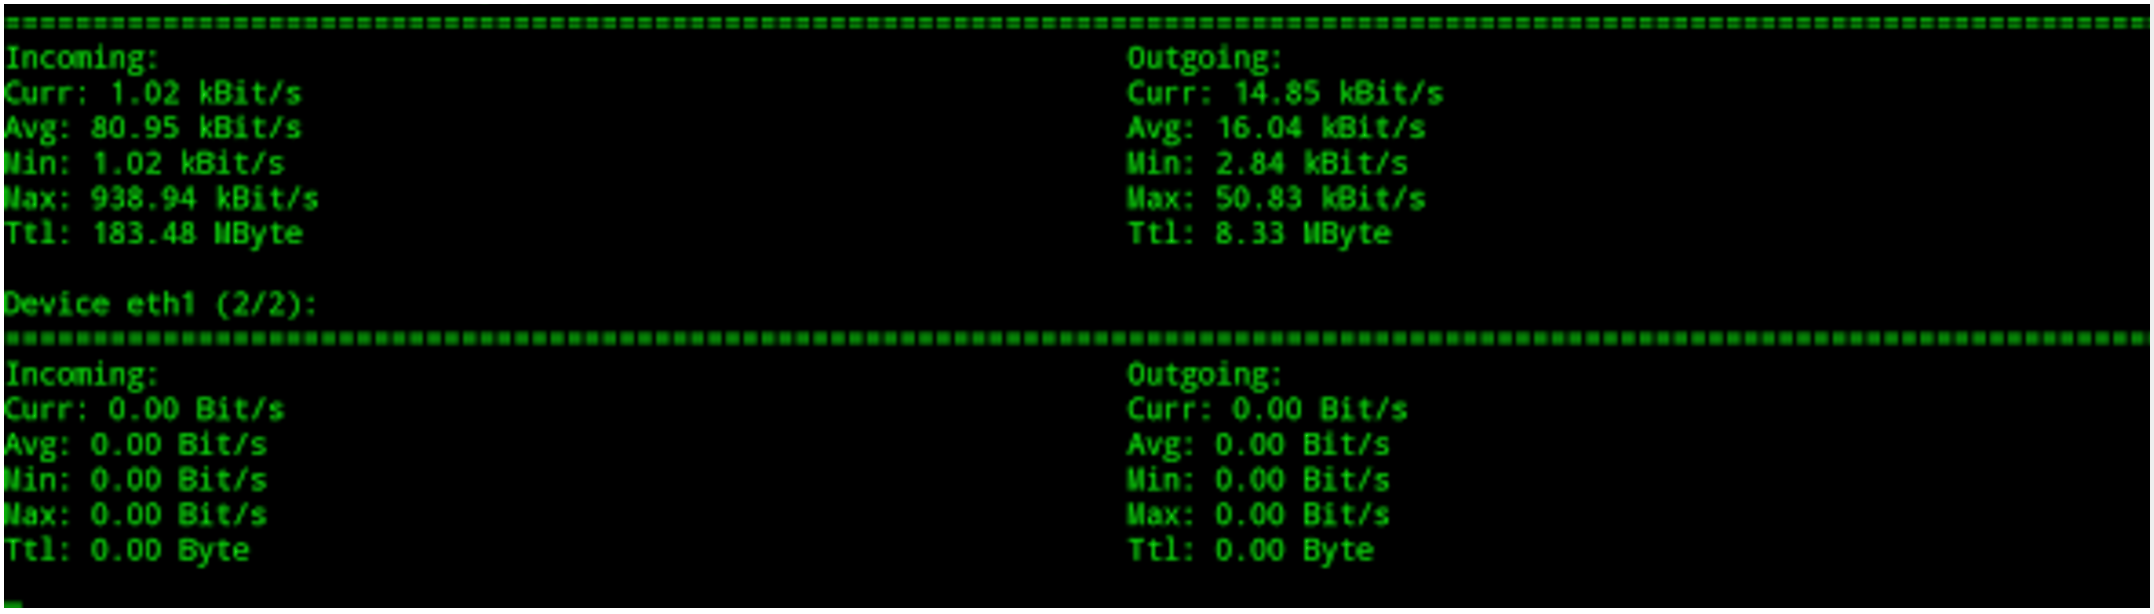
As you can see in Figure 2, this can give a useful insight into which of our network interfaces are under the highest load and without squinting at the output of a packet sniffing tool.

Figure 2: More than one network interface displayed at once.

Now that we’ve got an idea of how malleable nload is, let’s look at some of the configurations options available.

Refresh Frequency

Years ago, I remember debating the effectiveness of making your traffic statistics update faster than the default setting. Tools that use Simple Network Monitoring Protocol (SNMP), such as RRDTool and MRTG (and indeed tools that use the “pcap” library, such as iftop), use averages to populate the display you are presented with. In short, a quicker refresh frequency may lower the accuracy of the output from such tools. If you are interested in the intricacies of such a statement, I encourage you to read more about such matters online.

I mention this for good reason. Before we continue, one caveat is that the “screen refresh” frequency is a different animal altogether to the “averages” used during the collection of statistics. When it comes to nload, however, the two are separated for clarity (unlike with other applications). The clever author keeps things simple, which is very welcome.

From what I can tell from the manual, the “-a” option is for changing the period used for measuring “averages,” which (I am guessing) affects the calculations behind the scenes. The refresh frequency, however, is for “screen display,” in terms of tweaking it to suit your display needs as we’ve just mentioned. Both ultimately relate to how the majority of real-time statistics are collected and then displayed between them. In case it causes confusion with nload, the screen refresh period is referred to as the “refresh interval.”

The manual goes to some length to explain that lowering the refresh interval to less than the default 500ms is not that wise. It states: “Specifying refresh intervals shorter than about 100 milliseconds makes traffic calculation very unprecise.”

This confirms my experience with other traffic collection software, too. The sophisticated nload goes on to reassure us with this additional comment: “nload tries to balance this out by doing extra time measurements, but this may not always succeed.”

I couldn’t confirm what its exact effect is on other settings, but within the Options Window (the box seen at the top of Figure 1), there is a “Smoothness of  average” setting, which you may have some success in changing to affect your accuracy. Fear not, following some trial and error, you shouldn’t have too many problems now that you’re armed with the terminology and the difference between the two key adjustable parameters.

Battle Hardening

When I’m learning a new tool, I tend to run a few tests between machines and monitor how the tool reacts at both ends of a connection — to avoid a few headaches. Usually, I would send a small amount of data, stop and start the connection, and then try and saturate the network link (or at least put it under significant levels of stress) and repeat this a few times.

Coupling your new-found knowledge of how a tool will ultimately react to differing scenarios — having tuned the refresh frequency (and potentially the averages used for traffic calculations) to suit your needs — is the best way to battle-harden a tool in my experience.

In the next article, I’ll look at some specific examples of launching nload with various options.

Chris Binnie is a Technical Consultant with 20 years of Linux experience and a writer for Linux Magazine and Admin Magazine. His new book Linux Server Security: Hack and Defend teaches you how to launch sophisticated attacks, make your servers invisible and crack complex passwords.

Advance your career in system administration! Check out the Essentials of System Administration course from The Linux Foundation.

Jennifer Cloer on Working with Linus Torvalds, Open Source and Women in Tech

“I’ve had the opportunity to be at the forefront of some of the most disruptive technologies in the history of computing, it’s an amazing and unique experience,” said Jennifer Cloer, former Director of Communications at the Linux Foundation.

I have known Jennifer Cloer from the very early days, even before the Linux Foundation was formed. She is among the most influential women in the tech world, especially in the open source world. I have been planning to start a series of interviews of those women who made it into CIO’s most influential women in Tech list. When I approached Jennifer, I learned about a development in her career that made this story even more interesting. Cloer is moving out of the Linux Foundation and venturing into a new world of her own.

Read more at CIO.com

Linux Dominates November TOP500 Supercomputer List

The latest semi-annual list of the world’s top 500 supercomputers was released on November 14, showing little change at the top of the list. The China-based Sunway TaihuLight supercomputer, which first claimed the title of the world’s fastest system in June 2016, still reigns supreme.

Sunway TaihuLight was built by the National Research Center of Parallel Computer Engineering and Technology (NRCPC), and it is installed at the National Supercomputing Center in Wuxi, China.

Read more at ServerWatch

How to Avoid Burnout Managing an Open Source Project

Regardless of where you work in the stack, if you work with open source software, there’s likely been a time when you faced burnout and other unhealthy side effects related to your work on open source projects. A few of the talks at OSCON Europe addressed this darker side of working in open source head-on.

Katrina Owen is a developer advocate on the open source team at GitHub, but she is also the creator of Exercism.io, which was the focus of her talk, “The bait and switch of open source.”

Read more at The New Stack

Examining ValueObjects

Industry leader Martin Fowler provides some ”value” in using ValueObjects, particularly small ones.

When programming, I often find it’s useful to represent things as a compound. A 2D coordinate consists of an x value and y value. An amount of money consists of a number and a currency. A date range consists of start and end dates, which themselves can be compounds of year, month, and day.

As I do this, I run into the question of whether two compound objects are the same. If I have two point objects that both represent the Cartesian coordinates of (2,3), it makes sense to treat them as equal. Objects that are equal due to the value of their properties, in this case their x and y coordinates, are called value objects.

But unless I’m careful when programming, I may not get that behavior in my programs.

Read more at DZone

Report: Linux, NoSQL, Nginx Set Foundation for AWS App Dominance

If you’ve built a new app in AWS, odds are you’re running it on Linux, with a NoSQL data store and Nginx to serve it to your users.

That’s one of the conclusions drawn by Sumo Logic, a cloud-based analytics service for application data that runs on Amazon Web Services, in its analysis of how its customers are putting together modern, cloud-based apps. 

Sumo Logic’s report, entitled “The State of the Modern App in AWS,” uses statistics gathered from the company’s base of 1,200 customers to get an idea of how their apps are created and what they run on.

Read more at InfoWorld

Forward Networks’ SDN Pioneers Want to Make the Network Less Error-Prone

Forward Networks, a startup whose founders include software-defined networking (SDN) pioneer David Erickson, is launching today with a management tool to simplify network operations.

The company’s formal verification engine, now in general availability, is aimed at “eliminating tedious manual correlation by humans and putting it into smart software,” Erickson says. In other words, Forward wants to automate away the human-error factor that causes network outages or security vulnerabilities.

It’s solving a problem that CEO Erickson and his co-founders — Brandon Heller, Peyman Kazemian, and Nikhil Handigol — encountered as students at Stanford University in a period starting around 2007, when they were doing early research on what became SDN. They were part of the team that was led by professor Nick McKeown and included Martin Casado, now a venture capitalist with Andreessen-Horowitz.

Read more at SDx Central

Working with Cloud-Based Development Environments

Today’s software is served from the cloud and the world’s data is stored in the cloud. The benefits are clear. Let the cloud platform providers deal with the complexities of managing servers and data centers, let the users enjoy continuous experience across multiple devices and let developers focus on their applications. In this article, I’ll focus on developer tools that migrated to the cloud. Development shops used to run servers in the office or rented servers from private hosting providers. This is not necessary anymore. All functions can now be served on the cloud. 

Read complete article at DevX

Rolling Updates and Rollbacks using Kubernetes Deployments

As I described in the previous article, with minikube running or with access to a remote Kubernetes cluster, you can start exploring more advanced deployment scenarios than running a single Pod. One of the strengths of Kubernetes is the ability to define a container-based unit (i.e., Pod) in a declarative resource called a Deployment. This Deployment can be scaled up and down and can also be used to keep track of all the versions being deployed, opening the door for simple rollbacks.

Deployments are a higher abstraction, which create ReplicaSets resources. ReplicaSets watch over the Pods and make sure the correct number of replicas are always running. When you want to update a Pod, you can modify the Deployment manifest. This modification will create a new ReplicaSet, which will be scaled up while the previous ReplicaSet will be scaled down, providing no down-time deployment of your application.

The command line kubectl gives you some hints about what is possible. In particular, in version v1.4.0, you have some clearly labeled Deploy Commands returned by the kubectl help. Note that the rolling-update command only applies to ReplicationControllers; hence, we will not use it. This type of update was driven client side, whereas with Deployments resources rolling updates are now all done server side.


```

$ kubectl --help

...

Deploy Commands:

 rollout        Manage a deployment rollout

 rolling-update Perform a rolling update of the given ReplicationController

 scale          Set a new size for a Deployment, ReplicaSet, Replication Controller, or Job

```

Of interest for this blog is the rollout command, which allows you to manage various versions of a deployment.


```

$ kubectl rollout --help

...

Available Commands:

 history     View rollout history

 pause       Mark the provided resource as paused

 resume      Resume a paused resource

 status      Watch rollout status until it's done

 undo        Undo a previous rollout

```

Quick and Dirty Deployment

If you cannot wait to get started, make use of the kubectl run command to generate a Deployment. It is a very handy wrapper. Executing it will generate a Deployment, which will create a ReplicaSet, which will create your Pod. For example to run Ghost:


```

$ kubectl run ghost --image=ghost

$ kubectl get pods,rs,deployments

NAME                               READY     STATUS         RESTARTS   AGE

po/ghost-943298627-ev1zb           1/1       Running        0          33s

NAME                         DESIRED   CURRENT   READY     AGE

rs/ghost-943298627           1         1         0         33s

NAME                   DESIRED   CURRENT   UP-TO-DATE   AVAILABLE   AGE

deploy/ghost           1         1         1            0           33s

```

To quickly expose this deployment, we need to create a service. This can be done with the kubectl expose command.


```

$ kubectl expose deployment ghost --port=2368 --type=NodePort

```

With the service in place you can open the Ghost application with your browser. Of course, you can choose another type of service.

To scale the deployment and have some quick fun, simply use the kubectl scale command and watch new Pods being created.


```

$ kubectl scale deployments ghost --replicas=4

deployment "ghost" scaled

$ kubectl get pods --watch

```

To create a Deployment from a manifest, head over to the Deployment documentation, check the specification, and write your own manifest in yaml or json, then use the kubectl create -f command. Note that Deployments are extensions API, they should become first class citizens in an upcoming release.  However, kubectl run is a handy wrapper that gets your started in a flash.

Modifying a Deployment

Before modifying a Deployment, let’s have a look at the rollout command and see what the history returns:


```

$ kubectl rollout history deployments ghost

deployments "ghost"

REVISION    CHANGE-CAUSE

1        <none>

```

We have one revision, representing the creation step. And the cause is empty <none>. To get the change cause to be recorded, we need to start a Deployment with a –record option. Each subsequent action will be recorded in an annotation stored in the Deployment resource. Let’s do it, because it is quite fun.


```

$ kubectl run ghost-recorded --image=ghost:0.9 --record

deployment "ghost-recorded" created

$ kubectl rollout history deployments ghost-recorded

deployments "ghost-recorded"

REVISION    CHANGE-CAUSE

1        kubectl run ghost-recorded --image=ghost:0.9 --record

```

There are now many ways to perform an update. One that I like a lot is just to edit the Deployment with my editor using kubectl edit like so:


```

$ kubectl edit deployments ghost-recorded

deployment "ghost-recorded" edited


$ kubectl rollout history deployments ghost-recorded

deployments "ghost-recorded"

REVISION    CHANGE-CAUSE

1        kubectl run ghost-recorded --image=ghost:0.9 --record

2        kubectl edit deployments ghost-recorded

```

It is handy, but the annotation is not very helpful, we don’t know what we changed. So, instead let’s use the set command. Currently, this lets you change only the image of a deployment.


```

$ kubectl set image deployment/ghost-recorded ghost-recorded=ghost:0.11

deployment "ghost-recorded" image updated


$ kubectl rollout history deployments ghost-recorded

deployments "ghost-recorded"

REVISION    CHANGE-CAUSE

1        kubectl run ghost-recorded --image=ghost:0.9 --record

2        kubectl edit deployments ghost-recorded

3        kubectl set image deployment/ghost-recorded ghost-recorded=ghost:0.11

```

Every time we make a change, a new ReplicaSet is created. This new ReplicaSet is scaled up and the previous one scaled down, but not deleted… Let’s check it out:


```

$ kubectl get rs

NAME                        DESIRED   CURRENT   READY     AGE

ghost-recorded-214016590    0         0         0         5m

ghost-recorded-3297419894   0         0         0         3m

ghost-recorded-3372327543   1         1         1         1m

```

If you check the Pods, you will see that your running Pod has the hash of the latest ReplicaSet:


```

$ kubectl get pods

NAME                              READY     STATUS    RESTARTS   AGE

ghost-recorded-3372327543-d0xbk   1/1       Running   0          2m

```

Here you have it, rolling update with Kubernetes Deployments, giving you zero down-time!

Rollbacks

How do you roll back ? Simply set the revision that you want. Kubernetes will scale up the corresponding ReplicaSet, and scaled down the current one, and you will have rolled back. Let’s do it, so you believe me:


```

$ kubectl rollout undo deployments ghost-recorded --to-revision=1

deployment "ghost-recorded" rolled back


$ kubectl rollout history deployments ghost-recorded

deployments "ghost-recorded"

REVISION    CHANGE-CAUSE

2        kubectl edit deployments ghost-recorded

3        kubectl set image deployment/ghost-recorded ghost-recorded=ghost:0.11

4        kubectl run ghost-recorded --image=ghost:0.9 --record

```

Here we rolled back to the first revision. The revision index was incremented, but the ReplicaSets stayed the same. We just scale up the original one.

While doing a rollout or rollback, you can define a specific strategy. This strategy is specified in the Deployment manifest. Currently, it only lets you specify the maximum number of Pods that can be unavailable during an update, as well as the maximum number of Pods that can be created above the declared number of replicas.

You can also pause and resume rollout and rollbacks with kubectl rollout pause/resume

There you have it, I think this has never been that easy to perform rolling updates and the crucial rollbacks. The ReplicaSets are brought to bear to keep a history of deployments and provide a zero downtime update. Also critical in all of this, is that the service exposing the application never gets changed. Indeed the service selects the Pods based on labels, whatever happens in the deployment the service is the same. This Deployment resource can also be used to do more involved update patterns, like canary deployments.

Have fun rolling!

Read the next articles in the series: 

Helm: The Kubernetes Package Manager

Federating Your Kubernetes Clusters — The New Road to Hybrid Clouds

Enjoy Kubernetes with Python

Want to learn more about Kubernetes? Check out the new, online, self-paced Kubernetes Fundamentals course from The Linux Foundation. Sign Up Now!

Sebastien Goasguen (@sebgoa) is a long time open source contributor. Member of the Apache Software Foundation, member of the Kubernetes organization, he is also the author of the O’Reilly Docker cookbook. He recently founded skippbox, which offers solutions, services and training for Kubernetes.