Home Blog Page 968

Mycroft AI Will Help Us Talk with Our Linux Computers

It might sound weird to hear yourself talk with your computer, but that’s exactly where we’re going, and Mycroft is going to help us get there.

Let’s face it, talking to your device, whether it’s a phone or a PC, is still not an easy or comfortable thing to do. Just like it happened with the Bluetooth headset, it will take a while until this becomes something normal to do.

If we take a look at Star Trek, for instance, we’ll see that everyone is talking with their compute… (read more)

IBM Relay Sets Big Blue Apart in Hybrid Cloud Race

IBM’s Relay technology, which syncs updates across distinct cloud environments, is one of the company’s secret weapons in the hybrid cloud space.

Read more at eWeek

Running Arch Linux on Raspberry Pi 2 Was Never Easier with the RaspArch Live CD

From the developer who brought us the RaspEX and RaspAnd Live CDs, RaspArch aims to be a tool that lets anyone install the latest Arch Linux operating system on Raspberry Pi 2 single-board computers without too much hassle.

Arne Exton informs Softpedia about the immediate availability for download of RaspArch build 151107, the second release of the Live CD, a respin of the Arch Linux operating system for ARM hardware architectures.

RaspArch uses the latest build of the l… (read more)

Measuring the Value of Corporate Open Source Contributions

Brian Warner is the Senior Open Source Strategist for the Samsung Open Source Group.

This is part 1 of a series on the value of an open source software development group for companies that rely on open source technology. See Part 2: Hiring Open Source Maintainers is Key to Stable Software Supply Chain.

If you’ve worked in a corporate development environment, you certainly understand that metrics are everything. If you’re doing development, you are probably familiar with the feeling that metrics aren’t perfect. I can’t count how many times I’ve heard, “Well, I’m measured on X because it generates a number, but let me tell you the real story…”

Certain things are both meaningful and easy to measure such as the number of conference talks accepted and presented, internal training sessions delivered, or other employees that are mentored. But what do you do about code?

What Does it Mean to Measure the Value of Your Open Source Contributors?

As hard as it is to measure an individual developer’s code contributions using a standardized set of statistics, it can be even harder to measure the value of a company’s open source contribution strategy. This is one of those things that everybody knows has value (we all know it’s a lot), but how do you quantify it?

One of the first things we have to get comfortable with is the arbitrary nature of valuing contributions. A single line that fixes a buffer overflow is arguably more valuable than a single line of documentation, but by how much? We can argue this endlessly, but it very quickly becomes a problem of bikeshedding, where arguments about measurements become a distraction from development itself. Realistically, aside from giving people like me something to think about, there’s not a lot of value in arguing the semantics…

However, one valuable measurement is how much of your code has landed in an upstream project. In our case, this is the single most important metric for the members of the Samsung Open Source Group. As a result, we specifically hire high-performance maintainers and committers. I’ll dive more deeply into this in the next article in this series.

The Methodology We Use

There’s a fantastic tool, written by Jon Corbet of LWN.net and Greg Kroah-Hartman, called gitdm. Jon is famously modest about it, but the value of this tool cannot be understated. In essence it parses git log and extracts meaningful statistics like who added/removed how many lines of code, what company they were from, etc. If you feed it a specific range of time or versions, it’ll tell you who did what.

A while back I wrote a front-end script called gitalize (which I’m fully comfortable admitting is a bit of a hack) that calls gitdm recursively on an arbitrary number of repositories and allows you to slice up the analysis over periods of time. This is great for seeing trends in the data, and with a bit of graph work it’s pretty easy to benchmark your contributions against others in your company, or other companies at large.

How to Measure the Value of Your Open Source Contributors

There are two key methods for measuring the contributions of our developers: patch count and lines committed.

For patch count, we go not by patches generated, nor patches sent, but rather we consider actual patches that land upstream in a project’s repositories. At first glance you might think this is another one of those arbitrary metrics; just because we can measure it doesn’t mean it’s useful, but there’s more to it.

In open source, etiquette is very important when sending code. It needs to be sent in small, understandable series of patches. It also needs to either be entirely obvious or the author must explain it very well. While it may not be perfect or final, it must not introduce security or stability issues. Finally, and most importantly, it must pass peer review.

By measuring and incentivizing our team to improve the number of patches that land upstream we are implicitly saying that the behaviors that get code accepted upstream, whatever those behaviors may be for your particular project, are the ones we value in Samsung’s Open Source Group. It just so happens that generating more small patches is a better community behavior than a few huge ones. Essentially, the better you play within your contributor community, the higher your accepted patch count will be, and we want to reward that.

Our second metric is the number of lines of code that are committed. While this is far from a perfect measure, it is generally recognized that productive coders produce a lot of code.

Taken together, these two metrics do a pretty good job of providing an aggregate view of productivity, impact, and good OSS project citizenship. We know there will always be nuances that can’t possibly be captured by statistics, but these strike the best balance between measurements that satisfy corporate metrics requirements, and letting our people stay focused on what they do best.

For us this is critical, because at the end of the day productivity, i.e. landing patches upstream, is what matters most. Stay tuned for the next post in this series as it will cover what these measurements have told us about the success of the Open Source Group here at Samsung.

 This article is republished with permission from the Samsung Open Source Group Blog.

Read more: Hiring Open Source Maintainers is Key to Stable Software Supply Chain.


Write Documentation Once, Output Multiple Formats with Sphinx

Sphinx HTML page

The Sphinx Python Documentation Generator was originally created to build Python documentation, and then it evolved into a good general-purpose documentation creator. It is especially well-suited to creating technical documentation, with support for images, cross-referencing, automatic indices, flexible tables of contents, citations, and footnotes. From a single source file you can create single- or multi-page HTML, PDF, epub, JSON, LaTeX, Texinfo, man pages, and plain text documents.

Sphinx’s native markup language is reStructuredText (RST), and parsing and translating are handled by Docutils. RST is easy to learn and fully-documented. When you build and preview your output pages, Sphinx automatically finds markup errors for you.

Installing Sphinx

On most Linux distributions the Sphinx package is python-sphinx. This should install a number of dependencies such as Python, Docutils, Pygments, LaTeX, and various extensions.

Sphinx has many extensions, and a good option for managing them that does not depend on distro packaging is using pip (PIP installs packages), the Python package management system, to install packages directly from PyPI, the Python Package Index. The Python Package Index is the official Python package repository. On most Linux distros pip comes in the python-pip package. Install Sphinx this way with pip:

$ sudo pip install sphinx

First Setup

Sphinx includes a script, sphinx-quickstart, to launch your new project and create its initial configuration. It asks you a series of questions such as project name, author, and directory structure, and stores your answers in the conf.py file. Create and enter a new directory for your project, and then run the script:

$ mkdir book1
$ cd book1
$ sphinx-quickstart
Welcome to the Sphinx 1.3.1 quickstart utility.

This asks you a series of questions. Answer yes to everything; it doesn’t hurt anything and ensures that you have full functionality, and you can always make changes later. When you’re finished it looks like this:

Creating file ./source/conf.py.
Creating file ./source/index.rst.
Creating file ./Makefile.
Creating file ./make.bat.
Finished: An initial directory structure has been created.

Your directory contents should look like this:

book1$ ls
build  make.bat  Makefile  source

Go ahead and run some build commands to see what happens, like make html to create Web pages:

book1$ make html

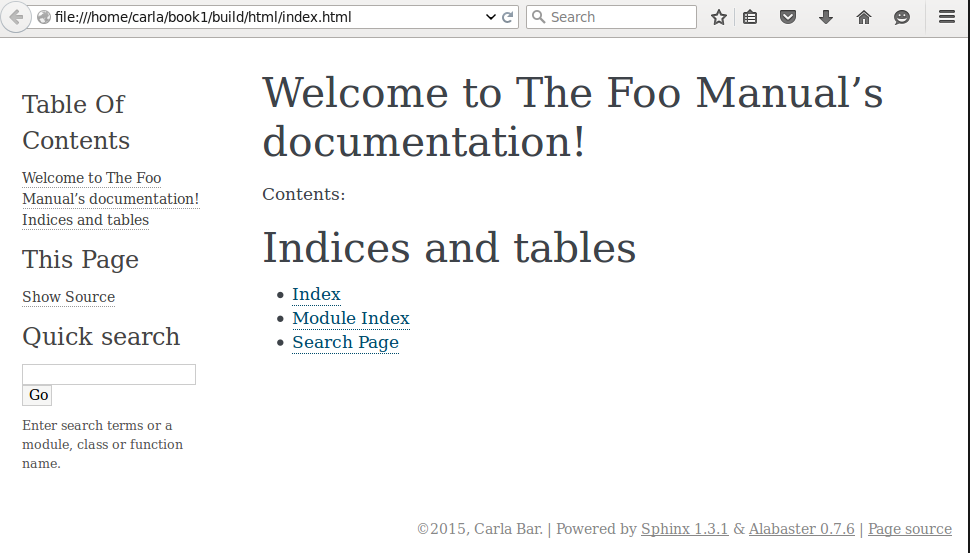
This creates a build directory; enter this to find and look at your new HTML page. Figure 1 (above) shows the result.

Run make help to see all of your build targets, or look in your project’s Makefile:

book1$ make help
Please use `make ' where  is one of
  html       to make standalone HTML files
  dirhtml    to make HTML files named index.html in directories
  singlehtml to make a single large HTML file
  pickle     to make pickle files
  json       to make JSON files
  htmlhelp   to make HTML files and a HTML help project
  qthelp     to make HTML files and a qthelp project
  applehelp  to make an Apple Help Book
  devhelp    to make HTML files and a Devhelp project
  epub       to make an epub
  latex      to make LaTeX files, you can set PAPER=a4 or PAPER=letter
  [...]

Sphinx does not include viewers for your output files, so you’ll have to find your own. For example, open HTML files with a Web browser, epub files with an Epub reader, and read man pages with the man command:

book1$ man build/man/thefoomanual.1

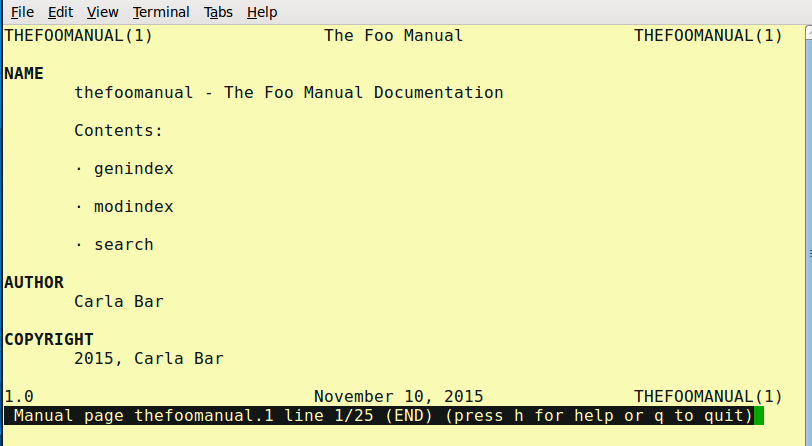
And behold, your new man page (figure 2).

Sphinx man page

Of course the example is empty, because we haven’t created any content yet.

Run make clean before running another build to ensure you’re starting with an empty build directory.

Sphinx relies on LaTeX, and you’ll probably see error messages about missing extensions when you build documents; for example, missing pdflatex when you try to build a PDF file:

book1$ make latexpdf
sphinx-build -b latex -d build/doctrees   source build/latex
Running Sphinx v1.3.1
making output directory...
[...]
make[1]: pdflatex: Command not found
make[1]: *** [TheFooManual.pdf] Error 127
make[1]: Leaving directory `/home/carla/book1/build/latex'
make: *** [latexpdf] Error 2

It is also common on a new Sphinx installation to see error messages about missing .sty files. The sure way to cure these errors is to install all texlive packages, which you can get on Debian with the metapackage texlive-full. This includes the language, science and math extensions, so it’s about 1.5 gigabytes, and installs to 3GB. Installing the following (Debian/Ubuntu/Mint) should give you everything you need without having to install the whole works:

  • texlive
  • texlive-base
  • texlive-extra-utils
  • texlive-font-utils
  • texlive-fonts-recommended
  • texlive-latex-extra
  • texlive-latex-recommended

The base texlive package on CentOS is fairly comprehensive, and CentOS provides a large number of smaller Texlive packages so you can install what you want without having to install a giant blob of everything. Fedora offers a Three Bears meta-packaging scheme: texlive-scheme-fulltexlive-scheme-medium, and texlive-scheme-basic, and, like CentOS, a large number of small packages.

You may avoid distro packaging drama by using TeX Live to install and manage your TeX packages directly from the source.

Controlling Project Options

The conf.py file in your project root directory controls all of your project’s options, and this is the file to edit to change any options you selected when you ran sphinx-quickstart. For example, if you answered Yes to “include links to the source code of documented Python objects”, then every time you run a build you have to wait for “loading intersphinx inventory from https://docs.python.org/objects.inv…“. Disable this by entering your conf.py and commenting out the sphinx.ext.intersphinx extension in the “General configuration” section.

Spend some time getting familiar with conf.py; it’s easy to change the values and then build your project to see what the changes look like. This is where you configure your project name, version, copyright, extensions, and output options for different formats.

Web Page Themes

Sphinx comes with a set of built-in themes: 

  • basic
  • alabaster
  • sphinx_rtd_theme
  • classic
  • sphinxdoc
  • scrolls
  • agogo
  • nature
  • pyramid
  • haiku
  • traditional
  • epub
  • bizstyle

 You can see what any of these look like by entering the theme name in the “Options for HTML output” section of conf.py, and then running make html:

html_theme = 'pyramid'

The built-in themes have options that you can configure in conf.py, and these are documented in Sphinx’s HTML theming support page. For custom themes do not do this, for it is the path to madness, as this will make your conf.py cluttered and unwieldy. It is better to put your custom theme in its own directory, and then enter the relative directory path (relative to your project’s root directory) in conf.py:

html_theme_path = ['../custom_theme']

Now that you know how to install Sphinx and make your own builds, come back next week to learn how to create and format your content.

How to Test-Drive OpenStack

This is the first article in our Test Driving OpenStack series. If you’re interested in learning how to run OpenStack, check out OpenStack training from The Linux Foundation.
openstack logoHere’s a scenario. You’ve been hearing much about OpenStack and you’re interested in putting it through a test drive so you can start learning it. Perhaps you want to learn it to further your career, or perhaps you want to test it out to see if it’s something that would fit into your infrastructure. Either way, you want to get it up and running, but with one important requirement: Minimal or zero cost if possible.

Before we begin, let’s address that final requirement. There are many ways you can get up and running at no cost, provided you already have some hardware. But if you don’t have the hardware, you can still get going at minimal cost using cloud servers. The servers you use won’t have to be production-grade servers, but they’ll be enough to learn OpenStack.

OpenStack is technically just an API specification for managing cloud servers and overall cloud infrastructures. Different organizations have created software packages that implement OpenStack. To use OpenStack, you need to acquire such software. Fortunately, there are several free and open source solutions. (There are also premium models available, as well as free software, that come with premium support models.)

Since OpenStack is for managing cloud infrastruture, to get a minimal setup, you need two machines: One will be the infrastructure you’re managing, and one will be the manager. But if you’re really strapped for hardware, you can fit both on a single machine. Today’s computers allow for virtualization whereby you can run multiple server instances on a single machine. Of course, the more cores you have, the better; a quad-core is probably the minimum. So if you’re working on single-core computer, you probably will want to grab some space on a hosted server. If you have a dual-core computer, you’ll still be a bit tight for CPU space, and I recommend renting a server. But you can do it on your dual core if you have no other choice and just want to test out the basic functionality.

OpenStack Software and APIs

Although OpenStack is technically a specification, the OpenStack community has created a base set of software that you can use to get started trying it out. This software, called DevStack, is primarily intended for testing and development purposes, and not for production. But it includes everything you need to get going, including management tools.

The management tools are where things become a bit fuzzy between OpenStack being “just an API” and a set of software that makes use of the API. Anyone can technically build a set of software that matches the OpenStack specification. That software can be either on the managed side, or the manager side. The managed side would implement the API allowing any OpenStack-compliant management tool to manage it. The manager side would be a tool that can manage any OpenStack-compliant platform. The managed side is where OpenStack mostly lives with its various APIs. There are several APIs, but here are a couple:

Compute is the main API for allocating and de-allocating servers. The code name for this API is Nova. (Each portion of OpenStack includes a code name.) OpenStack also allows you to create and manage images that represent backups of disk drives. This portion of OpenStack is called Glance. These images are often going to contain operating systems such as Linux. The idea here is that you can choose an image that you’ll use to create a new server. The image might contain, for example, an Ubuntu 14.04 server that’s already configured with the software you need. Then you would use the Compute server to launch a couple of servers using that image. Because each server starts from the same image, they will be identical and already configured with the software you placed on the image.

In addition to the APIs living on the “managed” side, you’ll need a tool on the “manager” side to help you create servers. (This process is often referred to as provisioning servers.) The OpenStack community has created a very good application called Horizon, which is a management console. Although I mentioned that the free software is good for testing and development, the Horizon tool is actually quite mature at this point and can be used for production. Horizon is simply a management console where you click around and allocate your servers. In most production situations, you’ll want to perform automated tasks. For that you can use tools such as Puppet or Chef. The key is that any tool you use needs to know how to communicate with an OpenStack API. (Puppet and Chef both support OpenStack, and we’ll be looking at those in a forthcoming article.)

Up and Running

Knowing all this, let’s give it a shot. The steps here are small, but you’ll want to keep in mind how these steps would scale to larger situations and the decisions you would need to make. One important first decision is what services you want to use. OpenStack encompasses a whole range of services beyond the compute and image APIs I mention earlier. Another decision is how many hardware servers i.e. “bare metal servers” you want to use, as well as how many virtual machines you want to allow each bare metal server to run. And finally, you’ll want to put together a plan whereby users have limits or quotas on the amount of virtual machines and drive space (called volumes) they can use.

For this article we’re going to keep things simple by running OpenStack on a single machine, as this is an easy way to practice. Although you could do this on your own everyday Linux machine, I highly recommend instead creating a virtual machine so that you aren’t modifying your main work machine. For example, you might install Ubuntu 14.04 in VirtualBox. But to make this practice session as simple as possible, if you want you can install a desktop version of Ubuntu instead of the server version and then run the Horizon console right on that same machine. As an alternative, you can instead create a new server on a cloud hosting service, and install Ubuntu on it.

Next, you’ll need to install git. You don’t need to know how to actually use git; it’s just used here to get the latest version of the DevStack software. Now create a directory to house your OpenStack files. Switch to that directory and paste the following command into the console:

git clone https://git.openstack.org/openstack-dev/devstack

This will create a subdirectory called devstack. Switch to the new devstack, and then switch to the samples directory under it, like so:

cd devstack/samples

This directory contains two sample configuration files. (Check out OpenStack’s online documentation page about these configuration files.) Copy these up to the parent devstack directory:

cp local* ..

Now move back up to the parent devstack directory:

cd ..

Next, you need to make a quick modification to the local.conf file that you just copied over. Specifically you need to add your machine’s IP address within the local network. (It will likely start with a 10.) Open up local.conf using your favorite editor and uncomment (i.e. remove the #) the line that looks like this:

#HOST_IP=w.x.y.z

and replace w.x.y.z with your IP address. Here’s what mine looks like:

HOST_IP=10.128.56.9

(If you’re installing OpenStack, you probably know how to find your ipaddress. I used the ifconfig program.)

Now run the setup program by typing:

./stack.sh

If you watch, you’ll see several apt-get installations taking place followed by overall configurations. This process will take several minutes to complete. At times it will pause for a moment; just be patient and wait. Eventually you’ll see a message that the software is configured, and you’ll be shown a URL and two usernames (admin and demo) and a password (nomoresecrete).

Note, however, that when I first tried this, I didn’t see that friendly message, unfortunately. Instead, I saw this message:

“Could not determine a suitable URL for the plugin.”

Thankfully, somebody posted a message online after which somebody else provided a solution. If you encounter this problem, here’s what you need to do. Open the stack.sh file and search for the text OS_USER_DOMAIN_ID. You’ll find this line:

export OS_USER_DOMAIN_ID=default

and then comment it out by putting a # in front of it:

#export OS_USER_DOMAIN_ID=default

Then a few lines down you’ll find this line:

export OS_PROJECT_DOMAIN_ID=default

which you’ll similarly comment out:

#export OS_PROJECT_DOMAIN_ID=default

Now you can try again. (I encourage you at this point to read the aforementioned post and learn more about why this occurred.) Then to start over you’ll need to run the unstack script:

./unstack.sh

And then run stack.sh again:

./stack.sh

Finally, when this is all done, you’ll be able to log into the Horizon dashboard from the web browser using the URL printed out at the end of the script. It should just be the address of your virtual machine followed by dashboard, and really you should be able to get to it just using localhost:

http://localhost/dashboard

Also, depending on how you’ve set up your virtual machine, you can log in externally from your host machine. Otherwise, log into the desktop environment on the virtual machine and launch the browser.

You’ll see the login page like so:
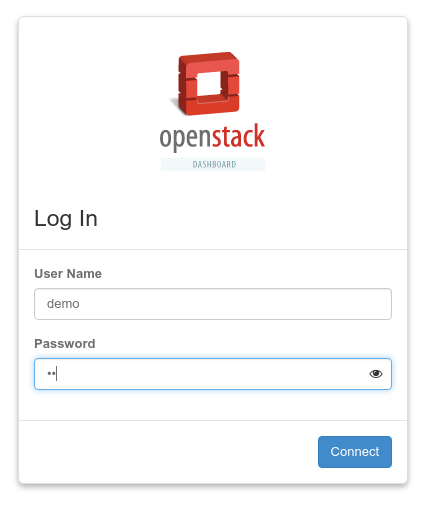
openstack login page

Use the username demo and password nomoresecrete. This will bring up the main dashboard:
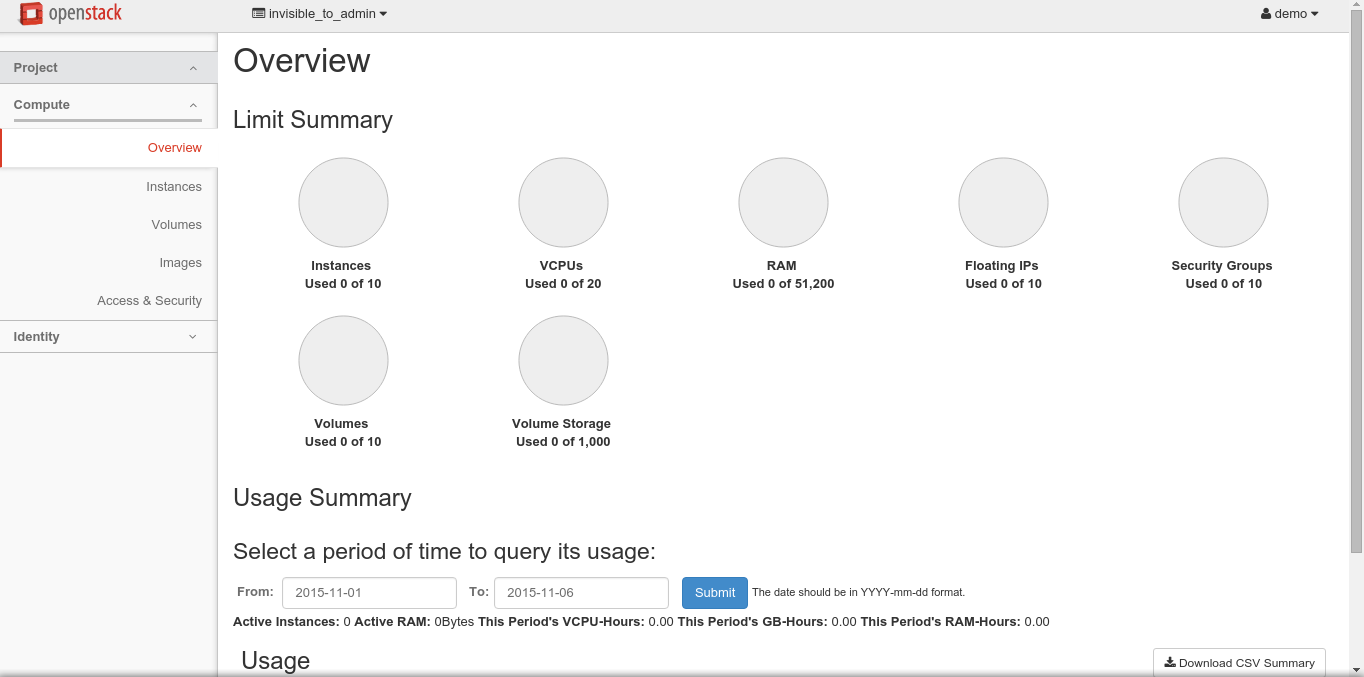
openstack dashboard

The OpenStack Dashboard

At this point you can begin using the dashboard. There are different steps here to learn about managing the OpenStack system; for example, you can allocate a virtual machine. But before you do that, I recommend clicking around and becoming familiar with the various aspects of the dashboard. Also, keep in mind what this dashboard really is: It’s a web application running inside Apache Web Server that makes API calls into your local OpenStack system. Don’t confuse the dashboard with OpenStack itself; the dashboard is simply a portal into your OpenStack system. You’ll also want to log in as the administrator, where you’ll have more control over the system, including the creation of projects, users, and quotas. Spend some time there as well.

Want to allocate a couple virtual machines? Here are the basic steps to get started; you’ll want to spend more time practicing this. First, log back in as the demo user. Yes, we’re going to allocate a virtual machine within our virtual machine (hence the fact that this is only for testing purposes). On the left, click Instances:

Then click the Launch Instance button in the upper-right. Work through the wizard, filling in the details. Leave Availability Zone set to Nova. Name your instance, such as Instance1. Choose a flavor. Since you’re running a virtual machine, and it’s just a test, I recommend going with the smallest flavor, m1.nano. For Instance Count, you can do 1 or 2, whichever you like. For Instance Boot Source, choose Boot from Image. The Image Name option refers to the image you’re going to create your server from. There will be just one to choose; its name will be the word cirros followed by some version numbers.

Leave the other tabs with their defaults. For this test, let’s keep it simple by not providing a security key for logging into the instances. Now click the Launch button and you’ll see the progress of the machines launching:

openstack launching panel

This might take a while since you’re probably getting a little tight for system resources (as I was). But again, this is just a test, after all.

The Task column will show “Spawning” as the instances are starting up. Eventually, if all goes well, the instances will boot up.

That’s about all it takes to get up and running with OpenStack. There are some pesky details, but all in all, it’s not that difficult. But remember that you’re using just a developer implementation of OpenStack called DevStack. This is just for testing purposes, and not for production. But it’s enough to get you started playing with OpenStack. In the next article we explore automation with OpenStack using a couple of popular tools, Chef and Puppet. Read Tools for Managing OpenStack.

Learn more about OpenStack. Download a free 26-page ebook, “IaaS and OpenStack – How to Get Started” from The Linux Foundation Training. The ebook gives you an overview of the concepts and technologies involved in IaaS, as well as a practical guide for trying OpenStack yourself.

Read the previous article in this series: Going IaaS: What You Need to Know


Why Improving Kernel Security is Important

The Washington Post published an article which describes the ongoing tension between the security community and Linux kernel developers. This has been roundly denounced as FUD, with Rob Graham going so far as to claim thatnobody ever attacks the kernel.

Unfortunately he’s entirely and demonstrably wrong, it’s not FUD and the state of security in the kernel is currently far short of where it should be.

Read more at Matthew Garrett’s Blog. 

First Linux Ransomware Program Cracked, For Now

Administrators of Web servers that were infected with a recently released ransomware program for Linux are in luck: There’s now a free tool that can decrypt their files.

The tool was created by malware researchers from antivirus firm Bitdefender, who found a major flaw in how the Linux.Encoder.1 ransomware uses encryption.

The program makes files unreadable by using the Advanced Encryption Standard (AES), which uses the same key for both the encryption and decryption operations. The AES key is then encrypted too by using RSA, an asymmetric encryption algorithm.

Read more at Computerworld.

EMC Launches CloudPools, Aims for Native Public Cloud Connections

The idea behind CloudPools is to tie EMC’s Isilon systems and OneFS operating system directly to public clouds so tiering data is easier.

Read more at ZDNet News

ARM SoC & Platform Updates Mailed In For The Linux 4.4 Kernel

Olof Johansson sent in all of the ARM SoC/platform updates today for the Linux 4.4 kernel merge window…

Read more at Phoronix