What’s New?
We’ve updated the four parts of this blog series and versioned the code along with it to include the following new technology components.
-
Jenkins Plugin Kubernetes Continuous Deploy has been added to deployments. https://plugins.jenkins.io/kubernetes-cd
-
Kubernetes RBAC and serviceaccounts are being used by applications to interact with the cluster.
-
We are now introducing and using Helm for a deployment (specifically for the deployment of the etcd-operator in part 3)
-
All versions of the main tools and technologies have been upgraded and locked
-
Fixed bugs, refactored K8s manifests and refactored applications’ code
-
We are now providing Dockerfile specs for socat registry and Jenkins
-
We’ve improved all instructions in the blog post and included a number of informational text boxes
The software industry is rapidly seeing the value of using containers as a way to ease development, deployment, and environment orchestration for app developers. Large-scale and highly-elastic applications that are built in containers definitely have their benefits, but managing the environment can be daunting. This is where an orchestration tool like Kubernetes really shines.
Kubernetes is a platform-agnostic container orchestration tool created by Google and heavily supported by the open source community as a project of the Cloud Native Computing Foundation. It allows you to spin up a number of container instances and manage them for scaling and fault tolerance. It also handles a wide range of management activities that would otherwise require separate solutions or custom code, including request routing, container discovery, health checking, and rolling updates.
Kenzan is a services company that specializes in building applications at scale. We’ve seen cloud technology evolve over the last decade, designing microservice-based applications around the Netflix OSS stack, and more recently implementing projects using the flexibility of container technology. While each implementation is unique, we’ve found the combination of microservices, Kubernetes, and Continuous Delivery pipelines to be very powerful.
Crossword Puzzles, Kubernetes, and CI/CD
This article is the first in a series of four blog posts. Our goal is to show how to set up a fully-containerized application stack in Kubernetes with a simple CI/CD pipeline to manage the deployments.
We’ll describe the setup and deployment of an application we created especially for this series. It’s called the Kr8sswordz Puzzle, and working with it will help you link together some key Kubernetes and CI/CD concepts. The application will start simple enough, then as we progress we will introduce components that demonstrate a full application stack, as well as a CI/CD pipeline to help manage that stack, all running as containers on Kubernetes. Check out the architecture diagram below to see what you’ll be building.
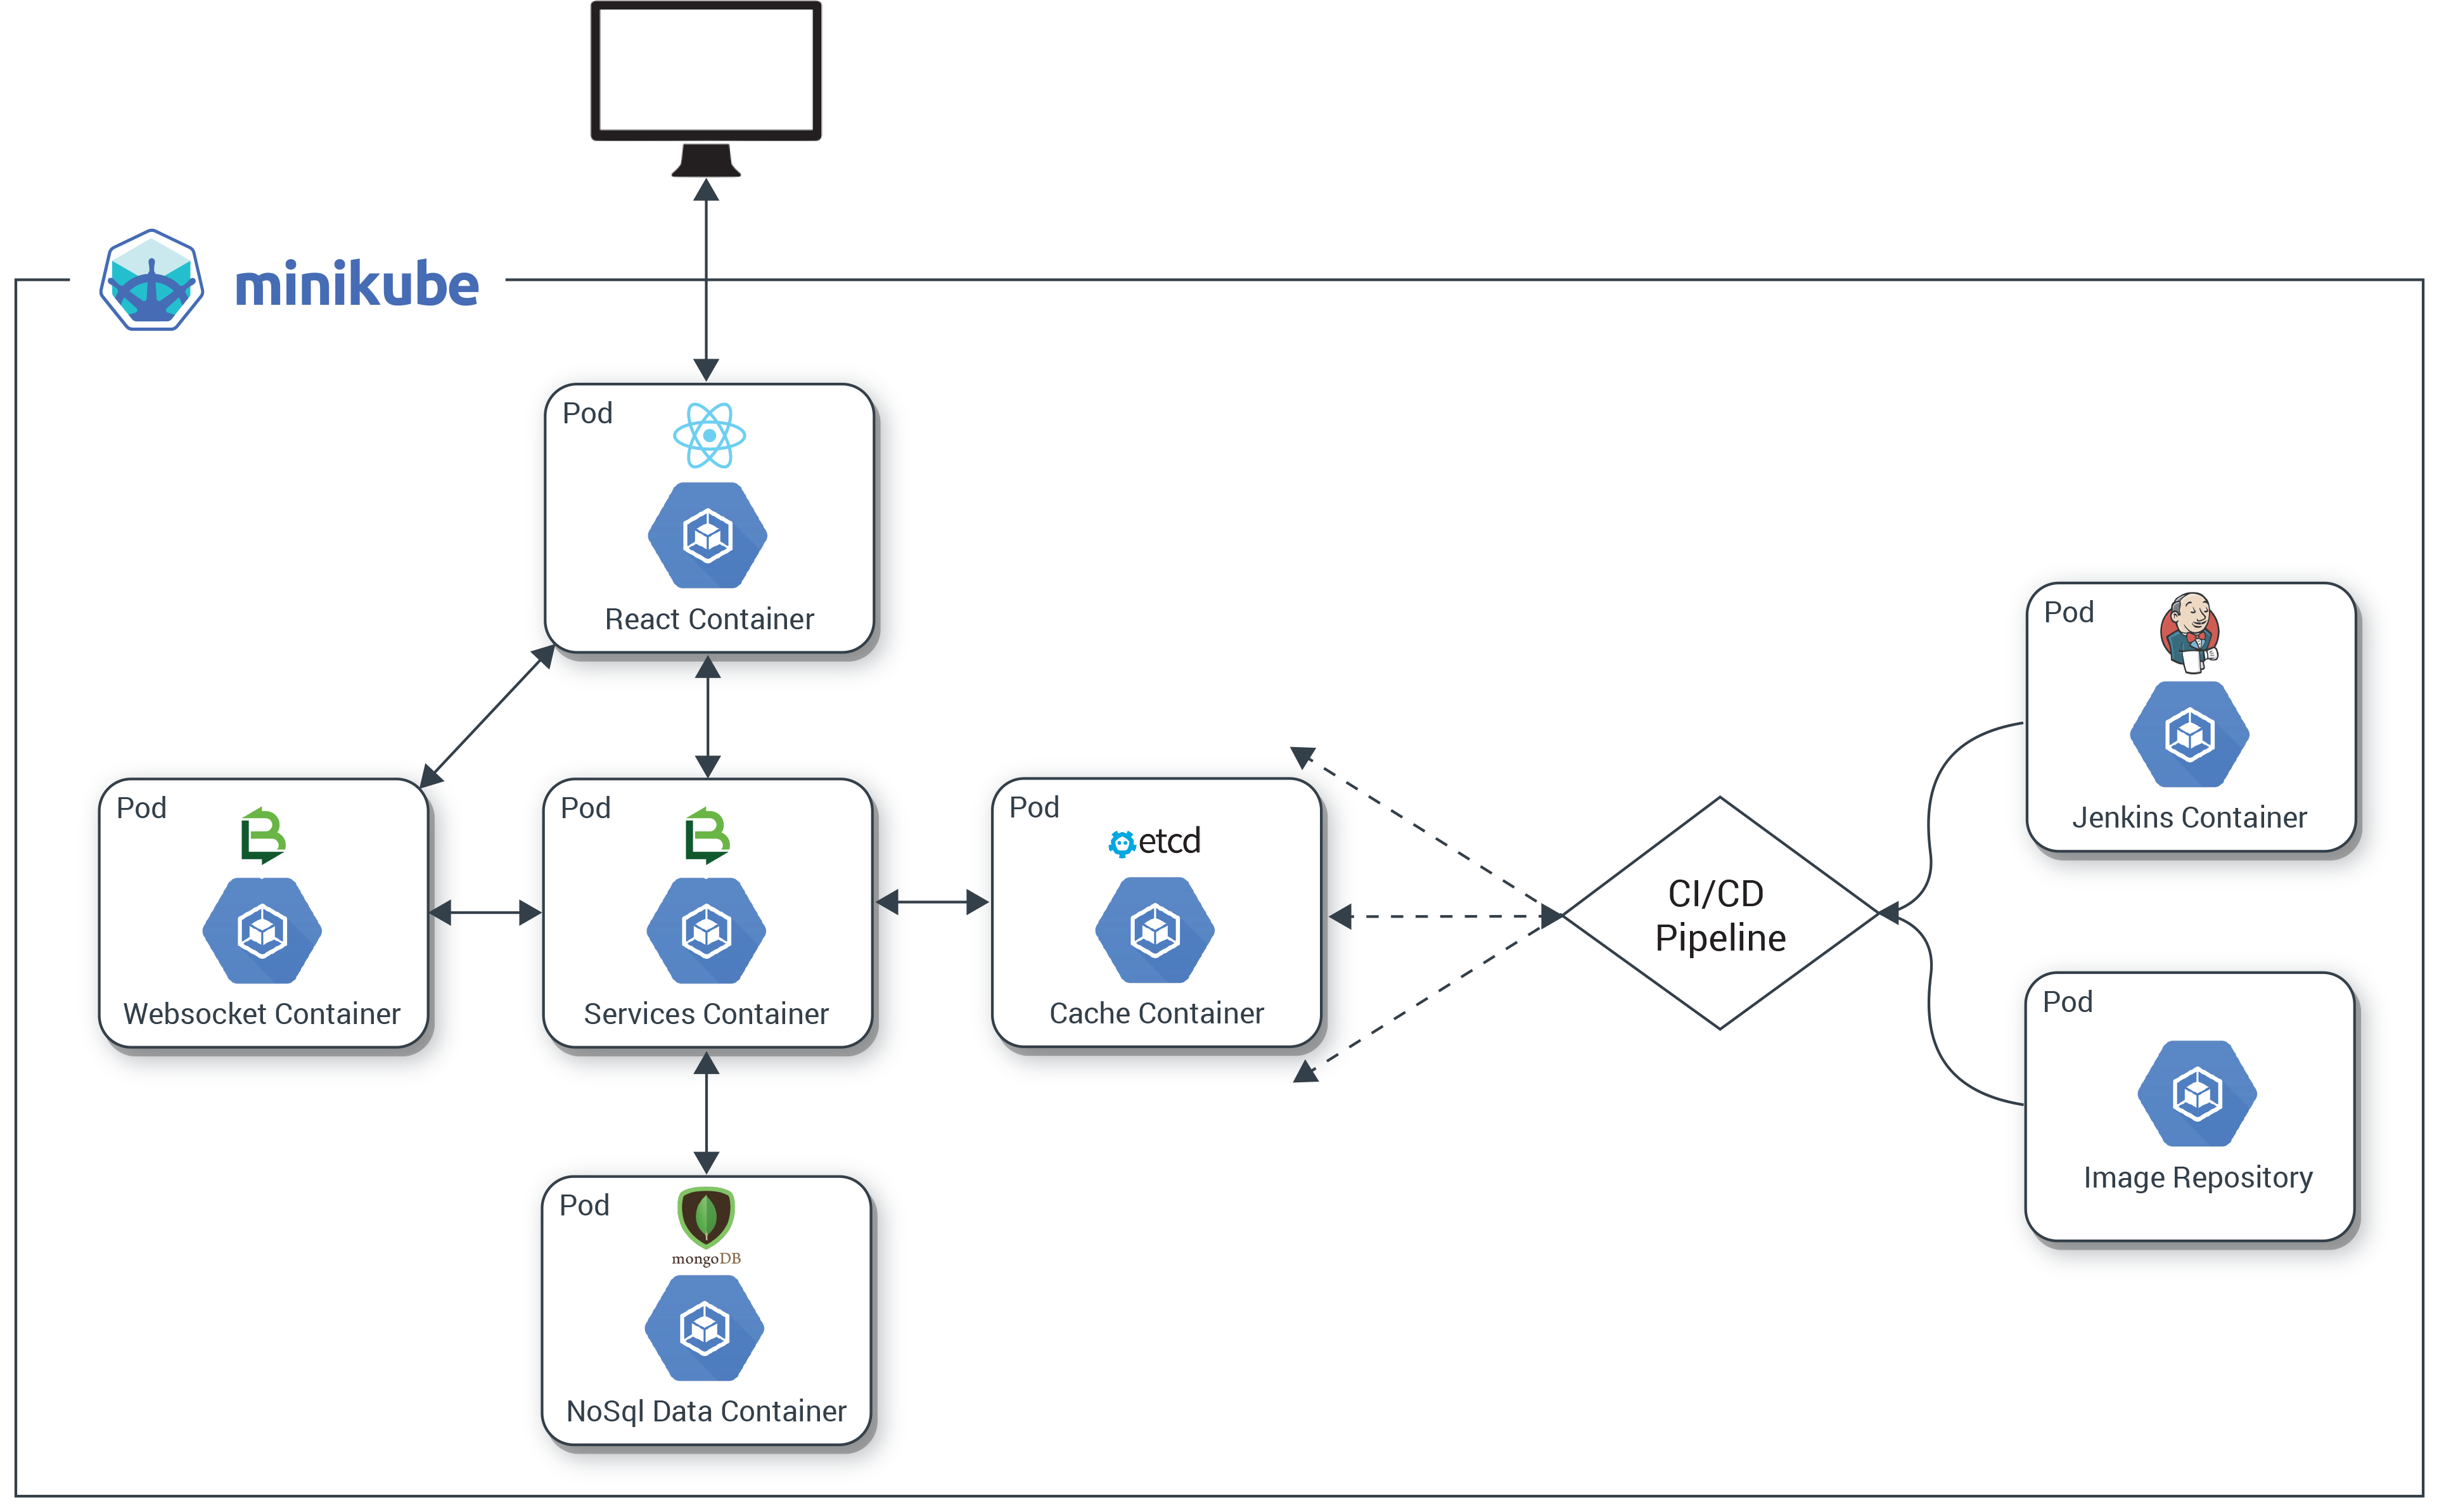
The completed application will show the power and ease with which Kubernetes manages both apps and infrastructure, creating a sandbox where you can build, deploy, and spin up many instances under load.
Get Kubernetes up and Running
The first step in building our Kr8sswordz Puzzle application is to set up Kubernetes and get comfortable with running containers in a pod. We’ll install several tools explained along the way: Docker, Minikube, and Kubectl.
|
This tutorial only runs locally in Minikube and will not work on the cloud. You’ll need a computer running an up-to-date version of Linux or macOS. Optimally, it should have 16 GB of RAM. Minimally, it should have 8 GB of RAM. For best performance, reboot your computer and keep the number of running apps to a minimum. |
Install Docker
Docker is one of the most widely used container technologies and works directly with Kubernetes.
Install Docker on Linux
To quickly install Docker on Ubuntu 16.04 or higher, open a terminal and enter the following commands (see the Linux installation instructions for other distributions):
sudo apt-get update
curl -fsSL https://get.docker.com/ | s
After installation, create a Docker group so you can run Docker commands as a non-root user (you’ll need to log out and then log back in after running this command):
sudo usermod -aG docker $USER
When you’re all done, make sure Docker is running:
sudo service docker start
Install Docker on macOS
Download Docker for Mac (stable) and follow the installation instructions. To launch Docker, double-click the Docker icon in the Applications folder. Once it’s running, you’ll see a whale icon in the menu bar.
Try Some Docker Commands
You can test out Docker by opening a terminal window and entering the following commands:
# Display the Docker version

docker version

# Pull and run the Hello-World image from Docker Hub

docker run hello-world

# Pull and run the Busybox image from Docker Hub

docker run busybox echo "hello, you've run busybox"

# View a list of containers that have run

docker ps -a
|
|
Images are specs that define all the files and resources needed for a container to run. Images are defined in a DockerFile, and built and stored in a repository. Many OSS images are publically available on Docker Hub, a web repository for Docker images. Later we will setup a private image repository for our own images. |
For more on Docker, see Docker Getting Started. For a complete listing of commands, see The Docker Commands.
Install Minikube and Kubectl
Minikube is a single-node Kubernetes cluster that makes it easy to run Kubernetes locally on your computer. We’ll use Minikube as the primary Kubernetes cluster to run our application on. Kubectl is a command line interface (CLI) for Kubernetes and the way we will interface with our cluster. (For details, check out Running Kubernetes Locally via Minikube.)
Install Virtual Box
Download and install the latest version of VirtualBox for your operating system. VirtualBox lets Minikube run a Kubernetes node on a virtual machine (VM)
Install Minikube
Head over to the Minikube releases page and install the latest version of Minikube using the recommended method for your operating system. This will set up our Kubernetes node.
Install Kubectl
The last piece of the puzzle is to install kubectl so we can talk to our Kubernetes node. Use the commands below, or go to the kubectl install page.
On Linux, install kubectl using the following command:
curl -LO
https://storage.googleapis.com/kubernetes-release/release/$(curl -s
https://storage.googleapis.com/kubernetes-release/release/stable.txt)/bin/linux/amd64/kubectl
&& chmod +x kubectl && sudo mv kubectl /usr/local/bin/
On macOS, install kubectl using the following command:
curl -LO
 https://storage.googleapis.com/kubernetes-release/release/$(curl -s
 https://storage.googleapis.com/kubernetes-release/release/stable.txt)/bin/darwin/amd64/kubectl
 && chmod +x kubectl && sudo mv kubectl /usr/local/bin/
Install Helm
Helm is a package manager for Kubernetes. It allows you to deploy Helm Charts (or packages) onto a K8s cluster with all the resources and dependencies needed for the application. We will use it a bit later in Part 3, and highlight how powerful Helm charts are.
On Linux or macOS, install Helm with the following command.
curl
https://raw.githubusercontent.com/kubernetes/helm/master/scripts/get >
get_helm.sh; chmod 700 get_helm.sh; ./get_helm.sh
Fork the Git Repo
Now it’s time to make your own copy of the Kubernetes CI/CD repository on Github.
1. Install Git on your computer if you don’t have it already.
On Linux, use the following command:
sudo apt-get install git
On macOS, download and run the macOS installer for Git. To install, first double-click the .dmg file to open the disk image. Right-click the .pkg file and click Open, and then click Open again to start the installation.
2. Fork Kenzan’s Kubernetes CI/CD repository on Github. This has all the containers and other goodies for our Kr8sswordz Puzzle application, and you’ll want to fork it as you’ll later be modifying some of the code.
a. Sign up if you don’t yet have an account on Github.
b. On the Kubernetes CI/CD repository on Github, click the Fork button in the upper right and follow the instructions.
c. Within a chosen directory, clone your newly forked repository.
git clone https://github.com/YOURUSERNAME/kubernetes-ci-cd
d. Change directories into the newly cloned repo.
Clear out Minikube
Let’s get rid of any leftovers from previous experiments you might have conducted with Minikube. Enter the following terminal command:
minikube stop; minikube delete; sudo rm -rf ~/.minikube; sudo rm -rf ~/.kub
|
|
This command will clear out any other Kubernetes contexts you’ve previously setup on your machine locally, so be careful. If you want to keep your previous contexts, avoid the last command which deletes the ~/.kube folder. |
Run a Test Pod
Now we’re ready to test out Minikube by running a Pod based on a public image on Docker Hub.
|
|
A Pod is Kubernetes’ resiliency wrapper for containers, allowing you to horizontally scale replicas. |
1. Start up the Kubernetes cluster with Minikube, giving it some extra resources.
minikube start --memory 8000 --cpus 2 --kubernetes-version v1.6.0
|
|
If your computer does not have 16 GB of RAM, we suggest giving Minikube less RAM in the command above. Set the memory to a minimum of 4 GB rather than 8 GB. |
2. Enable the Minikube add-ons Heapster and Ingress.
minikube addons enable heapster; minikube addons enable ingress
Inspect the pods in the cluster. You should see the add-ons heapster, influxdb-grafana, and nginx-ingress-controller.
kubectl get pods --all-namespaces
3. View the Minikube Dashboard in your default web browser. Minikube Dashboard is a UI for managing deployments. You may have to refresh the web browser if you don’t see the dashboard right away.
minikube service kubernetes-dashboard --namespace kube-system
4. Deploy the public nginx image from DockerHub into a pod. Nginx is an open source web server that will automatically download from Docker Hub if it’s not available locally.
kubectl run nginx --image nginx --port 80
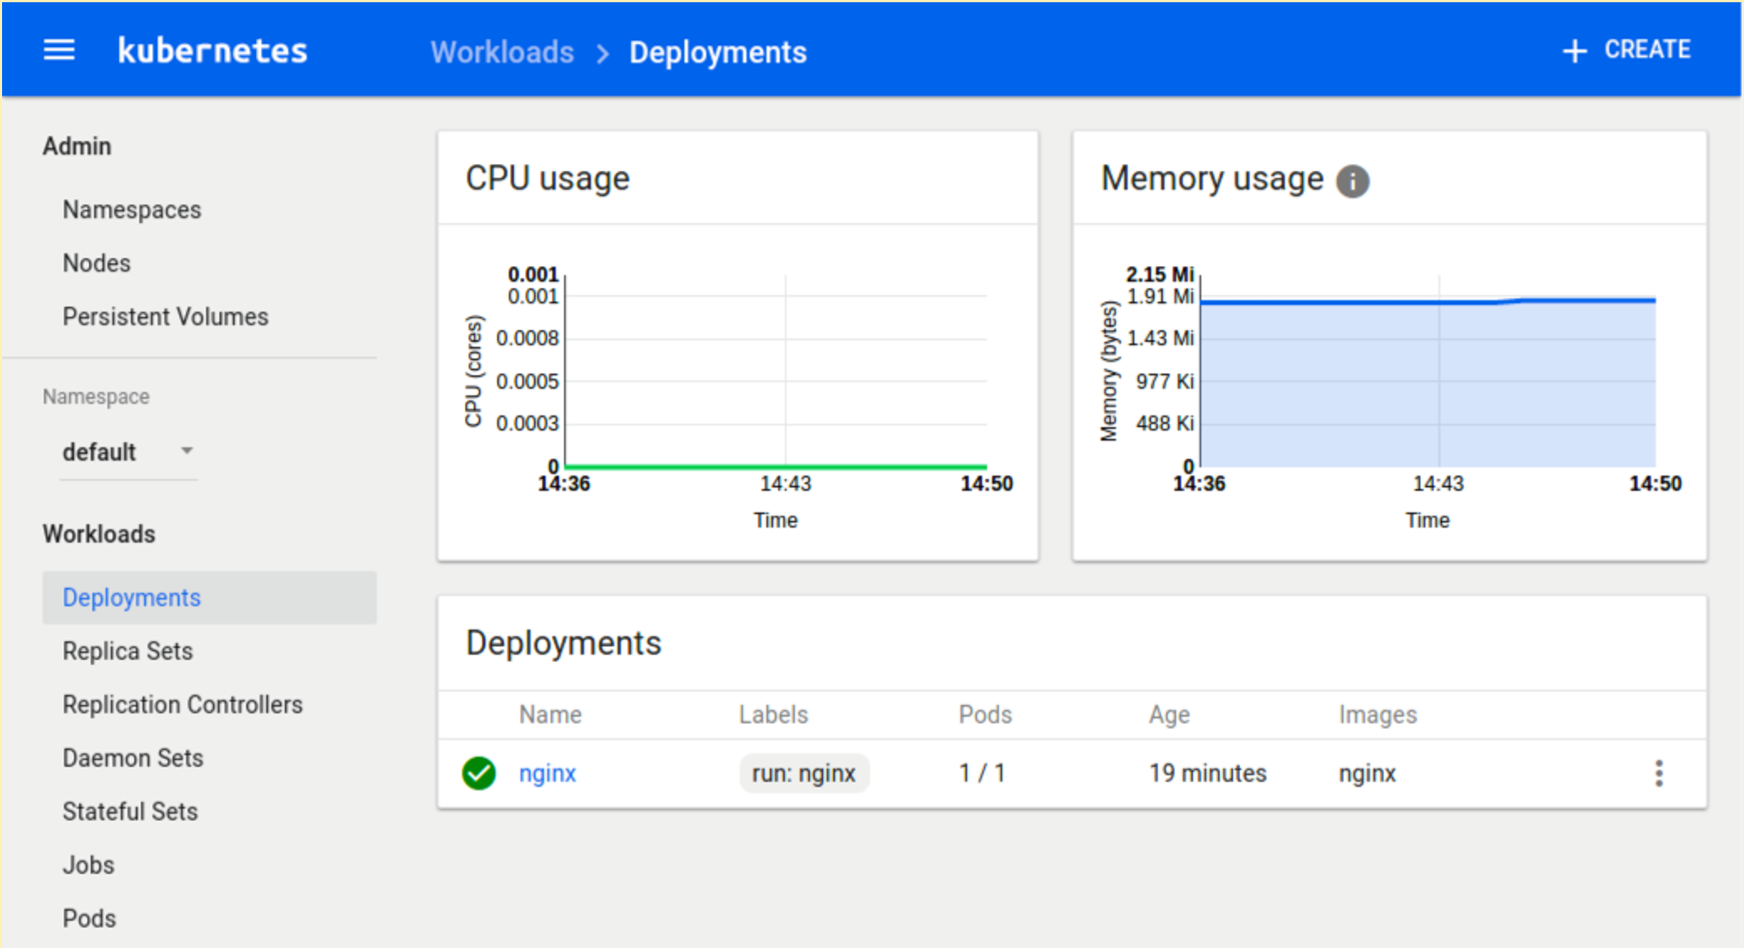
After running the command, you should be able to see nginx under Deployments in the Minikube Dashboard with Heapster graphs. (If you don’t see the graphs, just wait a few minutes.)
|
|
A Kubernetes Deployment is a declarative way of creating, maintaining and updating a specific set of Pods or objects. It defines an ideal state so K8s knows how to manage the Pods. |
5. Create a K8s service for deployment. This will expose the nginx pod so you can access it with a web browser.
kubectl expose deployment nginx --type NodePort --port 80
6. The following command will launch a web browser to test the service. The nginx welcome page displays, which means the service is up and running. Nice work!
minikube service nginx
7. Delete the nginx deployment and service you created.
kubectl delete service nginx
kubectl delete deployment nginx
Create a Local Image Registry
We previously ran a public image from Docker Hub. While Docker Hub is great for public images, setting up a private image repository on the site involves some security key overhead that we don’t want to deal with. Instead, we’ll set up our own local image registry. We’ll then build, push, and run a sample Hello-Kenzan app from the local registry. (Later, we’ll use the registry to store the container images for our Kr8sswordz Puzzle app.
8. From the root directory of the cloned repository, set up the cluster registry by applying a .yaml manifest file.
kubectl apply -f manifests/registry.yaml
|
|
Manifest .yaml files (also called k8s files) serve as a way of defining objects such as Pods or Deployments in Kubernetes. While previously we used the run command to launch a pod, here we are applying k8s files to deploy pods into Kubernetes. |
9. Wait for the registry to finish deploying using the following command. Note that this may take several minutes.
kubectl rollout status deployments/registry
10. View the registry user interface in a web browser. Right now it’s empty, but you’re about to change that.
minikube service registry-ui
11. Let’s make a change to an HTML file in the cloned project. Open the /applications/hello-kenzan/index.html file in your favorite text editor, or run the command below to open it in the nano text editor.
nano applications/hello-kenzan/index.html
Change some text inside one of the <p> tags. For example, change “Hello from Kenzan!” to “Hello from Me!”. When you’re done, save the file. (In nano, press Ctrl+X to close the file, type Y to confirm the filename, and press Enter to write the changes to the file.)
12. Now let’s build an image, giving it a special name that points to our local cluster registry.
docker build -t 127.0.0.1:30400/hello-kenzan:latest -f
 applications/hello-kenzan/Dockerfile applications/hello-kenzan
|
When a docker image is tagged with a hostname prefix (as shown above), Docker will perform pull and push actions against a private registry located at the hostname as opposed to the default Docker Hub registry. |
First, build the image for our proxy container:
docker build -t socat-registry -f applications/socat/Dockerfile applications/socat
14. Now run the proxy container from the newly created image. (Note that you may see some errors; this is normal as the commands are first making sure there are no previous instances running.)
docker stop socat-registry; docker rm socat-registry;

 docker run -d -e "REG_IP=`minikube ip`" -e "REG_PORT=30400"

 --name socat-registry -p 30400:5000 socat-registry
|
This step will fail if local port 30400 is currently in use by another process. You can check if there’s any process currently using this port by running the command |
15. With our proxy container up and running, we can now push our hello-kenzan image to the local repository.
docker push 127.0.0.1:30400/hello-kenzan:latest
Refresh the browser window with the registry UI and you’ll see the image has appeared.
16. The proxy’s work is done for now, so you can go ahead and stop it.
docker stop socat-registry
17. With the image in our cluster registry, the last thing to do is apply the manifest to create and deploy the hello-kenzan pod based on the image.
kubectl apply -f applications/hello-kenzan/k8s/manual-deployment.yaml
18. Launch a web browser and view the service.
minikube service hello-kenzan
Notice the change you made to the index.html file. That change was baked into the image when you built it and then was pushed to the registry. Pretty cool!
19. Delete the hello-kenzan deployment and service you created.
kubectl delete service hello-kenzan
kubectl delete deployment hello-kenzan
We are going to keep the registry deployment in our cluster as we will need it for the next few parts in our series.
If you’re done working in Minikube for now, you can go ahead and stop the cluster by entering the following command:
minikube stop
|
If you need to walk through the steps we did again (or do so quickly), we’ve provided npm scripts that will automate running the same commands in a terminal. 1. To use the automated scripts, you’ll need to install NodeJS and npm. On Linux, follow the NodeJS installation steps for your distribution. To quickly install NodeJS and npm on Ubuntu 16.04 or higher, use the following terminal commands.
a. curl -sL https://deb.nodesource.com/setup_7.x | sudo -E bash -
b. sudo apt-get install -y nodejs
On macOS, download the NodeJS installer, and then double-click the .pkg file to install NodeJS and npm. 2. Change directories to the cloned repository and install the interactive tutorial script: a. cd ~/kubernetes-ci-cd b. npm install 3. Start the script
npm run part1 (or part2, part3, part4 of the blog series)
4. Press Enter to proceed running each command. |
Up Next
In Part 2 of the series, we will continue to build out our infrastructure by adding in a CI/CD component: Jenkins running in its own pod. Using a Jenkins 2.0 Pipeline script, we will build, push, and deploy our Hello-Kenzan app, giving us the infrastructure for continuous deployment that will later be used with our Kr8sswordz Puzzle app.
This article was revised and updated by David Zuluaga, a front end developer at Kenzan. He was born and raised in Colombia, where he studied his BE in Systems Engineering. After moving to the United States, he studied received his master’s degree in computer science at Maharishi University of Management. David has been working at Kenzan for four years, dynamically moving throughout a wide range of areas of technology, from front-end and back-end development to platform and cloud computing. David’s also helped design and deliver training sessions on Microservices for multiple client teams.

