The good news about containers, such as Docker‘s, is they make it easy to deploy applications, and you can run far more of them on a server than you can on a virtual machine. The bad news is that putting an application into a container can be difficult. That’s where Buildah comes in.
Buildah is a newly released shell program for efficiently and quickly building Open Container Initiative (OCI) and Dockercompliant images and containers. Buildah simplifies the process of creating, building, and updating images while decreasing the learning curve of the container environment. Better still, for those interested in continuous integration (CI), it’s easily scriptable and can be used in an environment where one needs to spin up containers automatically based on application calls.
Recently, there’s been a lot of turmoil in the systems language community. We have the Rust Evangelism Strikeforce nudging us towards rewriting everything in Rust. We have the C++17 folks who promise the safety and ease of use of modern programming languages with the performance and power of C. And then there’s a long tail of other “systems” programming languages, like Nim, Reason / OCaml, Crystal, Go, and Pony.
Personally, I’m super excited we’re seeing some interesting work in the programming language theory space. This got me excited to learn more about what’s out there. A lot of the problems I solve are usually solved in C. Recently, Go has begun to encroach on C’s territory. I enjoy C and Go as much as the next person …
What Is a Systems Language?
Let’s back up a bit. What is a systems language? Well, I think that depends on where you are in the stack, and who you ask. In general, I would suggest the definition of a systems language is a language that can be used to implement the components your systems runs atop.
The Linux operating system includes a plethora of tools, all of which are ready to help you administer your systems. From simple file and directory tools to very complex security commands, there’s not much you can’t do on Linux. And, although regular desktop users may not need to become familiar with these tools at the command line, they’re mandatory for Linux admins. Why? First, you will have to work with a GUI-less Linux server at some point. Second, command-line tools often offer far more power and flexibility than their GUI alternative.
Determining memory usage is a skill you might need should a particular app go rogue and commandeer system memory. When that happens, it’s handy to know you have a variety of tools available to help you troubleshoot. Or, maybe you need to gather information about a Linux swap partition or detailed information about your installed RAM? There are commands for that as well. Let’s dig into the various Linux command-line tools to help you check into system memory usage. These tools aren’t terribly hard to use, and in this article, I’ll show you five different ways to approach the problem.
I’ll be demonstrating on the Ubuntu Server 18.04 platform. You should, however, find all of these commands available on your distribution of choice. Even better, you shouldn’t need to install a single thing (as most of these tools are included).
With that said, let’s get to work.
top
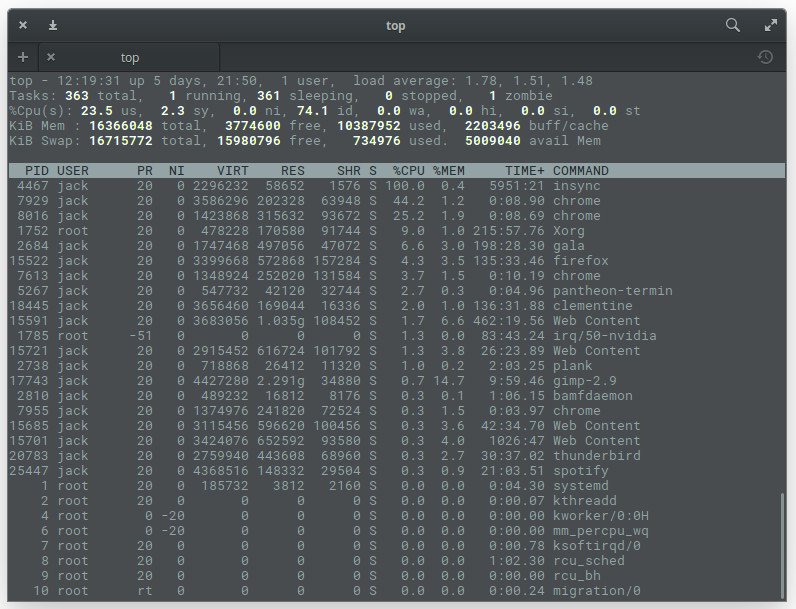
I want to start out with the most obvious tool. Thetopcommand provides a dynamic, real-time view of a running system. Included in that system summary is the ability to check memory usage on a per-process basis. That’s very important, as you could easily have multiple iterations of the same command consuming different amounts of memory. Although you won’t find this on a headless server, say you’ve opened Chrome and noticed your system slowing down. Issue the top command to see that Chrome has numerous processes running (one per tab – Figure 1).
Figure 1: Multiple instances of Chrome appearing in the top command.
Chrome isn’t the only app to show multiple processes. You see the Firefox entry in Figure 1? That’s the primary process for Firefox, whereas the Web Content processes are the open tabs. At the top of the output, you’ll see the system statistics. On my machine (a System76 Leopard Extreme), I have a total of 16GB of RAM available, of which just over 10GB is in use. You can then comb through the list and see what percentage of memory each process is using.
One of the things topis very good for is discovering Process ID (PID) numbers of services that might have gotten out of hand. With those PIDs, you can then set about to troubleshoot (or kill) the offending tasks.
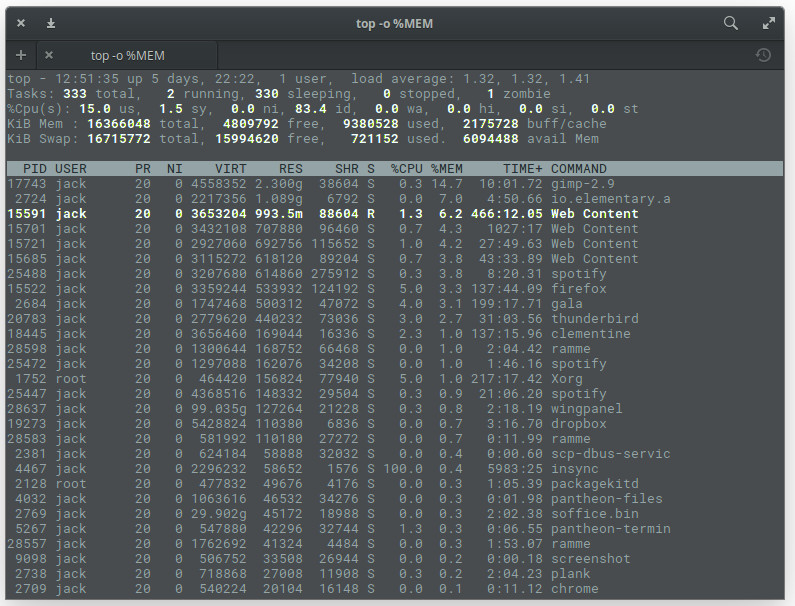
If you want to make topa bit more memory-friendly, issue the command top -o %MEM, which will cause top to sort all processes by memory used (Figure 2).
Figure 2: Sorting process by memory used in top.
The topcommand also gives you a real-time update on how much of your swap space is being used.
free
Sometimes, however, top can be a bit much for your needs. You may only need to see the amount of free and used memory on your system. For that, there is the free command. The freecommand displays:
Total amount of free and used physical memory
Total amount of swap memory in the system
Buffers and caches used by the kernel
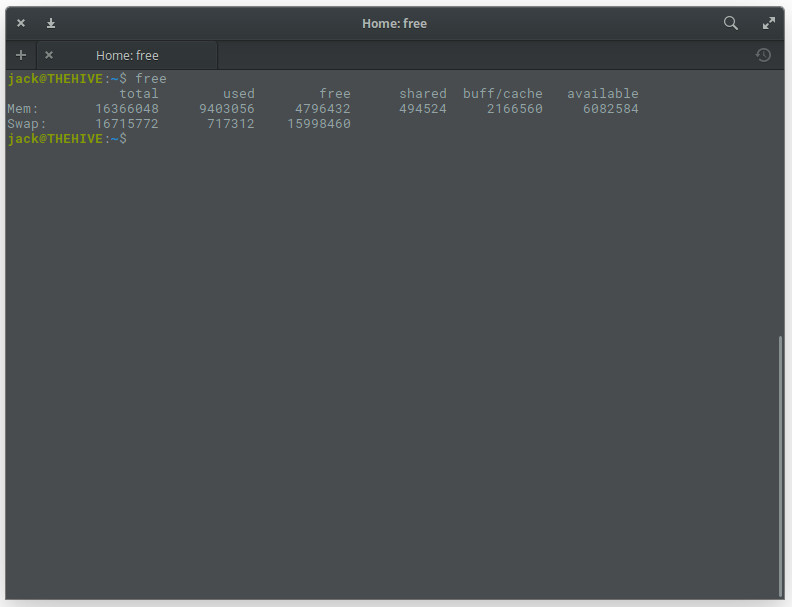
From your terminal window, issue the command free. The output of this command is not in real time. Instead, what you’ll get is an instant snapshot of the free and used memory in that moment (Figure 3).
Figure 3: The output of the free command is simple and clear.
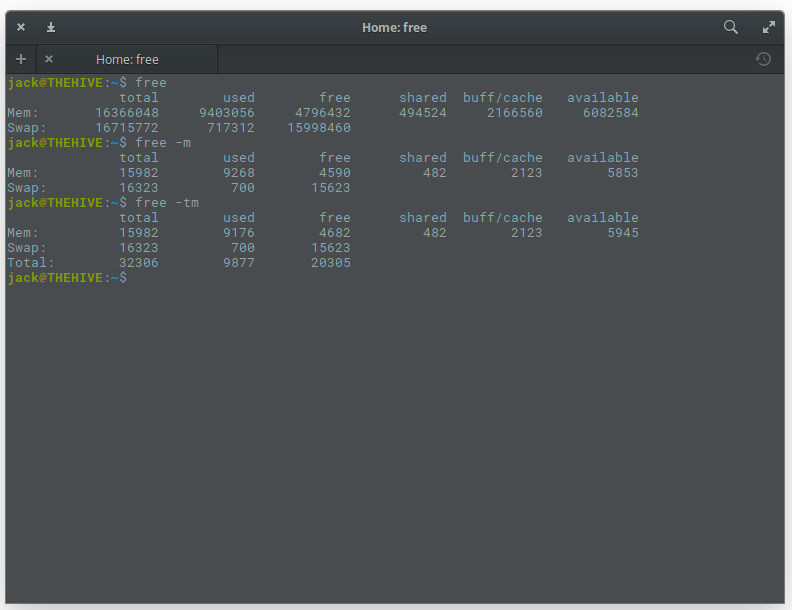
You can, of course, make freea bit more user-friendly by adding the -moption, like so:free -m. This will report the memory usage in MB (Figure 4).
Figure 4: The output of the free command in a more human-readable form.
Of course, if your system is even remotely modern, you’ll want to use the -goption (gigabytes), as in free -g.
If you need memory totals, you can add thet option like so: free -mt. This will simply total the amount of memory in columns (Figure 5).
Figure 5: Having free total your memory columns for you.
vmstat
Another very handy tool to have at your disposal is vmstat. This particular command is a one-trick pony that reports virtual memory statistics. The vmstat command will report stats on:
Processes
Memory
Paging
Block IO
Traps
Disks
CPU
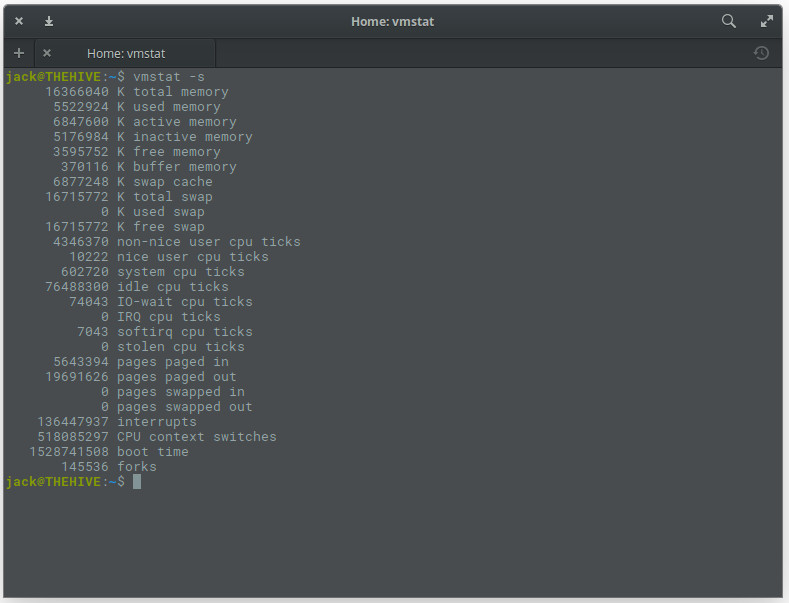
The best way to issue vmstatis by using the -sswitch, like vmstat -s. This will report your stats in a single column (which is so much easier to read than the default report). The vmstatcommand will give you more information than you need (Figure 6), but more is always better (in such cases).
Figure 6: Using the vmstat command to check memory usage.
dmidecode
What if you want to find out detailed information about your installed system RAM? For that, you could use the dmidecode command. This particular tool is the DMI table decoder, which dumps a system’s DMI table contents into a human-readable format. If you’re unsure as to what the DMI table is, it’s a means to describe what a system is made of (as well as possible evolutions for a system).
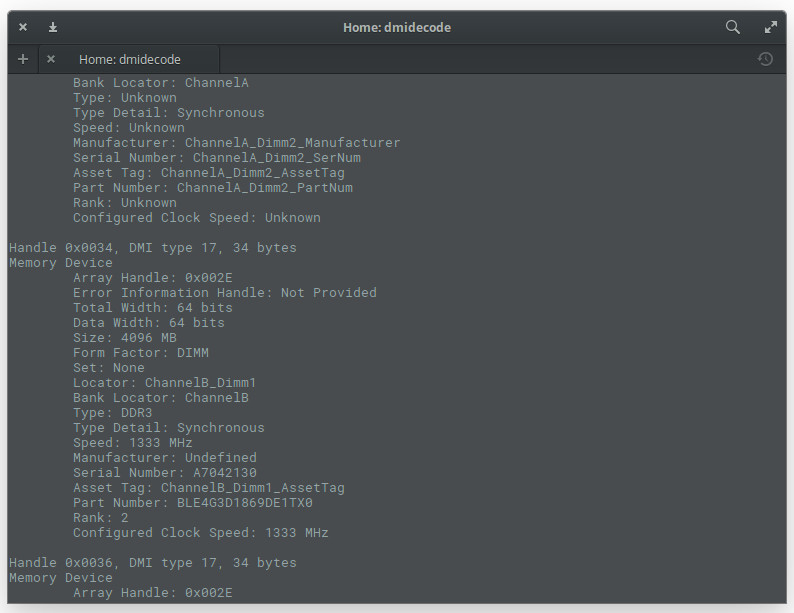
To run the dmidecode command, you do need sudoprivileges. So issue the command sudo dmidecode -t 17. The output of the command (Figure 7) can be lengthy, as it displays information for all memory-type devices. So if you don’t have the ability to scroll, you might want to send the output of that command to a file, like so: sudo dmidecode –t 17 > dmi_infoI, or pipe it to the lesscommand, as in sudo dmidecode | less.
Figure 7: The output of the dmidecode command.
/proc/meminfo
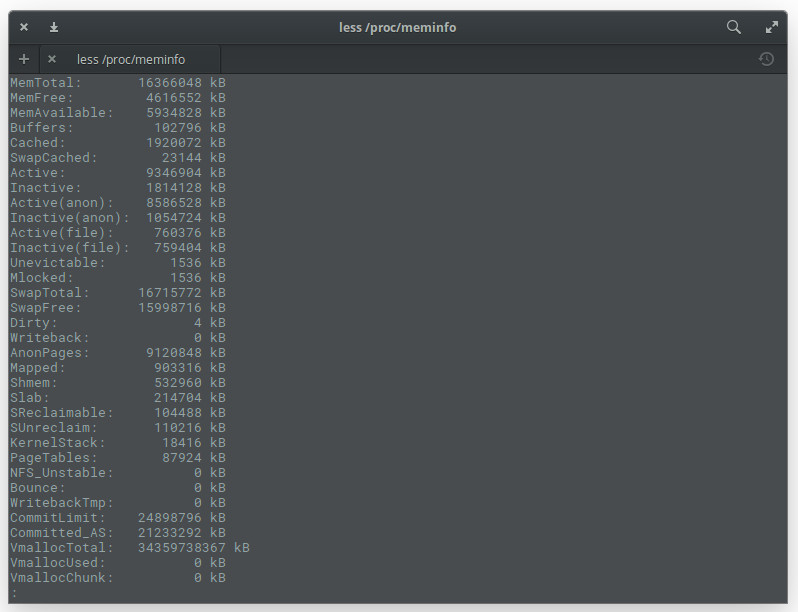
You might be asking yourself, “Where do these commands get this information from?”. In some cases, they get it from the /proc/meminfo file. Guess what? You can read that file directly with the commandless /proc/meminfo. By using the lesscommand, you can scroll up and down through that lengthy output to find exactly what you need (Figure 8).
Figure 8: The output of the less /proc/meminfo command.
One thing you should know about /proc/meminfo: This is not a real file. Instead /pro/meminfo is a virtual file that contains real-time, dynamic information about the system. In particular, you’ll want to check the values for:
MemTotal
MemFree
MemAvailable
Buffers
Cached
SwapCached
SwapTotal
SwapFree
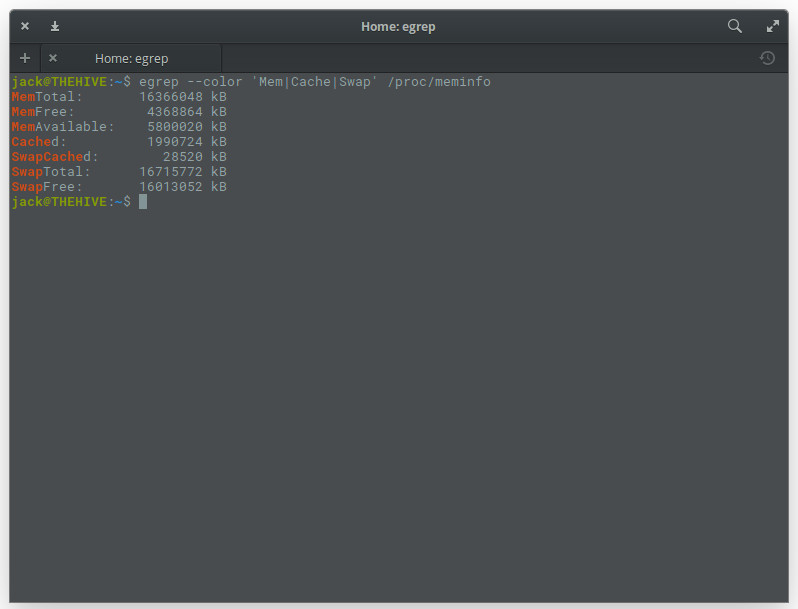
If you want to get fancy with /proc/meminfo you can use it in conjunction with the egrep command like so: egrep –color ‘Mem|Cache|Swap’ /proc/meminfo. This will produce an easy to read listing of all entries that contain Mem, Cache, and Swap … with a splash of color (Figure 9).
Figure 9: Making /proc/meminfo easier to read.
Keep learning
One of the first things you should do is read the manual pages for each of these commands (so man top, man free, man vmstat, man dmidecode). Starting with the man pages for commands is always a great way to learn so much more about how a tool works on Linux.
Learn more about Linux through the free “Introduction to Linux” course from The Linux Foundation and edX.
It’s GIF’s 31st anniversary — exciting, right? Those animated images have truly changed the world. All kidding aside, it is pretty amazing that the file format came to be way back in 1987!
To celebrate tomorrow’s milestone, Google releases a new open source tool today. Called “GIF for CLI,” it can convert a Graphics Interchange Format image into ASCII art for terminal. You can see such an example in the image above.
“Just in time for the 31st anniversary of the GIF, GIF for CLI is available today on GitHub. GIF for CLI takes in a GIF, short video, or a query to the Tenor GIF API and converts it to animated ASCII art. This means each time you log on to your programming workstation, your GIF is there to greet you in ASCII form. Animation and color support are performed using ANSI escape sequences,” says Sean Hayes, Tenor.
A supercomputer, of course, isn’t really a “computer.” It’s not one giant processor sitting atop an even larger motherboard. Instead, it’s a network of thousands of computers tied together to form a single whole, dedicated to a singular set of tasks. They tend to be really fast, but according to the folks at the International Supercomputing Conference, speed is not a prerequisite for being a supercomputer.
But speed does help them process tons of data quickly to help solve some of the world’s most pressing problems. Summit, for example, is already booked for things such as cancer research; energy research, to model a fusion reactor and its magnetically confined plasma tohasten commercial development of fusion energy; and medical research using AI, centering around identifying patterns in the function and evolution of human proteins and cellular systems to increase understanding of Alzheimer’s, heart disease, or addiction, and to inform the drug discovery process.
On May 25, the FBI asked us all to reboot our routers. The story behind this request is one of sophisticated malware and unsophisticated home-network security, and it’s a harbinger of the sorts of pervasive threats — from nation-states, criminals and hackers — that we should expect in coming years.
VPNFilter is a sophisticatedpiece of malware that infects mostly older home and small-office routers made by Linksys, MikroTik, Netgear, QNAP and TP-Link. (For a list of specific models, click here.) It’s an impressive piece of work. It can eavesdrop on traffic passing through the router — specifically, log-in credentials and SCADA traffic, which is a networking protocol that controls power plants, chemical plants and industrial systems — attack other targets on the Internet and destructively “kill” its infected device. It is one of a very few pieces of malware that can survive a reboot, even though that’s what the FBI has requested. It has a number of other capabilities, and it can be remotely updated to provide still others. More than 500,000 routers in at least 54 countries have been infected since 2016.
A security flaw within Intel Core and Xeon processors can be potentially exploited to swipe sensitive data from the chips’ math processing units. Malware or malicious logged-in users can attempt to leverage this design blunder to steal the inputs and results of computations performed in private by other software.
These numbers, held in FPU registers, could potentially be used to discern parts of cryptographic keys being used to secure data in the system. For example, Intel’s AES encryption and decryption instructions use FPU registers to hold keys.
In short, the security hole could be used to extract or guess at secret encryption keys within other programs, in certain circumstances, according to people familiar with the engineering mishap.
Modern versions of Linux – from kernel version 4.9, released in 2016, and later – and modern Windows, including Server 2016, as well as the latest spins of OpenBSD and DragonflyBSD are not affected by this flaw (CVE-2018-3665).
Kubernetes is often touted as the Linux of the cloud world, and that comparison is fair when you consider its widespread adoption. But, with great power comes great responsibility and, as the home of Kubernetes, the Cloud Native Computing Foundation (CNCF) shoulders many responsibilities, including learning from the mistakes of other open source projects while not losing sight of the main goal. The rapid global growth of CNCF also means increased responsibility in terms of cultural diversity and creating a welcoming environment.
Rise of Kubernetes in China
CNCF in general has more than 216 members, making it the second largest project under the umbrella of The Linux Foundation. The project is enjoying massive adoption and growth in new markets, especially in China. For example, JD.com, one of the largest e-commerce companies in China, has moved to Kubernetes.
“If you are looking to innovate as a company, you are not going to always buy off-the-shelf technologies, you take Open Source technologies and customize them to your needs. China has over a billion people and they have to meet the needs of these people; they need to scale. Open Source technologies like Kubernetes enable them to customize and scale technologies to their needs,” said Chris Aniszczyk, CTO, CNCF.
This growth in Asia has inspired CNCF to bring KubeCon and CloudNativeCon to China. The organization will be organizing their first KubeCon + CloudNativeCon in Shanghai, November 14-15, 2018. China is already using open source cloud-native technologies, and through these and other efforts, CNCF wants to build a bridge to help Chinese developers increase their contribution to various projects. CNCF is also gearing up to help the community by offering translations of documentations, exams, certifications, etc.
In interviews and at events in China, language often becomes a barrier to collaboration and the free exchange of ideas and information. CNCF is aware of this. And, according to Aniszczyk, is working on plans for live translation at events to allow presenters to speak in their native language.
CNCF projects are growing not only in new regions but also in scope; people are finding new use-cases every day. While they are enjoying this adoption, the community has also started to prepare themselves for what lies ahead. They certainly can’t predict how some smart organization will use their technology in an area they never envisioned; but they can prepare the community to embrace new requirements.
We have started to hear about CNCF 2020 vision that goes beyond Kubernetes proper and looks at areas such as security and policy. The community has started adding new projects that deal with some of these topics, including Spiffy, which helps users deal with service identity and security at scale for Kubernetes related services, and OPA, a policy management project.
“We are witnessing a wide expansion of areas that CNCF is investing in to bring cloud native technologies to users,” said Aniszczyk.
Bane or boon?
Adoption is great, but we have seen how many open source projects lose track of their core mission and became bloated in order to cater to every use-case. The CNCF is not immune to such problems, but the community — at both developer and organizational level — is acutely aware of the risk and is working to protect itself.
“We have taken several approaches. First and foremost, unlike many other open source projects, CNCF doesn’t force integration. We don’t have one major release that bundles everything. We don’t have any gatekeeping processes that other foundations have,” said Aniszczyk.
What CNCF does do is allow its members and end users to come up with integration themselves to build products that solves the problems of their users. If such integration is useful, then they contribute it back to CNCF. “We have a set of loosely coupled projects that are integrated by users; we don’t force any such integration,” said Aniszczyk.
According to Aniszczyk, CNCF acts almost like a release valve and experimentation center for new things. It creates an environment to test new projects. “They are like sandbox projects doing some interesting innovation, solving some serious problems. We will see if they work or not. If they do work then the community may decide to integrate them, but none of it is forced,” said Aniszczyk.
It’s magic
All of this makes CNCF a unique project in the open source ecosystem. Kubernetes has now been widely adopted across industries. Look at cloud providers, for example, and you see that Kubernetes has the blessing of the public cloud trinity, which includes AWS, Azure, and Google Cloud. Three top Linux vendors — SUSE, Red Hat, and Canonical — have put their weight behind Kubernetes, as well as many other companies and organizations.
“I‘m so proud of being a person that’s been involved in open source and seeing all these companies working together under one neutral umbrella,” Aniszczyk said.
Join us at Open Source Summit in Vancouver, August for 250+ sessions covering the latest technologies and best practices in Kubernetes, cloud, open source, and more.
Join us August 29-31, in Vancouver, BC, for 250+ sessions covering a wide array of topics including Linux Systems, Cloud Native Applications, Blockchain, AI, Networking, Cloud Infrastructure, Open Source Leadership, Program Office Management and more. Arrive early for new bonus content on August 28 including co-located events, tutorials, labs, workshops, and lightning talks.
Open source is community and collaboration driven. Instead of one dedicated product development team, there are thousands of developers from all over the world who contribute and develop the open-source project. For traditional marketers entering the open-source space, it takes a bit of a mindset shift. And if you are a company that is participating in an open-source project, you also have a role to play in helping to market it.
So, what have I learned about how to market open-source projects?
1. Recognize and respect the importance of the community.
As a marketer, you work for the community. They are the stars. It is your job to make them shine from behind the scenes. Without the community, the open-source project will die.