Linus Torvalds took the wraps off the first Linux 4.13 kernel release candidate on Saturday, a day ahead of its expected release.
The new release candidate (RC) comes a fortnight after the stable release of Linux 4.12, which was one of the biggest updates in the kernel’s 25 year history. That kernel also got its first update to 4.12.1 last week.
“This looks like a fairly regular release, and as always, rc1 is much too large to post even the shortlog for,” wrote Torvalds.
“Once again, the diffstat is absolutely dominated by some AMD gpu header files, but if you ignore that, things look pretty regular, with about two thirds drivers and one third “rest” (architecture, core kernel, core networking, tooling).”
We discussed these trends with David Schatsky, of the Deloitte University think tank, who has recently written on the state of quantum, and pressed him to predict quantum computing’s next important milestone toward commercial viability. Such is the elusive nature of the technology, and in the knowledge how difficult progress has been in its 30 years of existence, that Schatsky swathed his response in caveats.
“I’ll only give you a guess if you include that nobody really has an idea, especially me,” he said good naturedly. “But I think what we’re likely to see is answers to questions arrived at through the application of quantum computing in a laboratory setting first. It could be some kind of research question that a quantum computer has been especially designed to answer, in an R&D kind of setting. I wouldn’t be shocked if we see things like that in a couple of years.”
Actual commercial viability for quantum computing is probably in the 15-year time frame, he said, adding that while quantum computing is expected be used for somewhat tightly focused analytical problems, “if quantum computing becomes a really commercially accessible platform, these things have a way of creating a virtuous cycle where the capability to solve problems can draw new problem types and new uses for them. So I think we may be able to use them in ways we can’t image today.”
More immediate impact from quantum could come in the form of hybrid strategies that merge HPC systems with quantum computing techniques, Schatsky said, attacking HPC-class problems with the infusion of “quantum thinking.”
Chances are good that you are already an administrator for some systems you own, and you do it for free because that’s just how it goes these days. But there are employers willing and eager to pay good money for someone to help administer their systems. We’re currently near zero unemployment in system and network administration, and the Bureau of Labor Statistics projects continued 9% growth in the field through 2024.
What about automation, you ask. Perhaps you’ve heard sysadmins say how they intend to automate away their entire job, or how they automated their predecessor’s job in a single shell script. How many have you heard of that succeeding? When the job is automation, there is always more to automate.
If you attend or watch videos of sysadmin conferences, you’ll see a field that needs new blood. Not only is there a distinct lack of younger people, but also fairly extreme gender and racial imbalances. While those are topics for a different article, diversity is well proven to improve resilience, problem-solving, innovation, and decision-making—things of great interest to sysadmins.
Artificial intelligence is becoming more ingrained with the consumer market. Microsoft has Cortana, Apple has Siri and Amazon has Alexa as self-learning artificial intelligence projects. Self-driving cars are now becoming a reality thanks to AI driving technology. Even the marketing industry is taking advantage self-learning AI, as shown by Andy Fox of Element 7 Digital.
The disappointing reality of mainstream artificial intelligence is that it is being dominated by proprietary software. Industries may not give up their secrets so easily, which is why the open source community needs to support free AI projects that currently exist.
Why Use Linux?
Linux is not a household name for the majority of end users, but it widely appreciated by web hosters, researchers, and programmers. The security of Linux is much greater than Windows or OSX and it does not have any nasty surprises since the source code is public domain. It is also the most portable operating system since the kernel can be compiled and used by just about any architecture.
Considering the openness and security of Linux, wouldn’t you prefer that your self-driving car uses a more secure operating system? Even Google has been bitten by the Linux bug and is using their own Ubuntu variant for machine learning named Goobuntu.
Some Of The AI Projects For GNU/Linux
Lovers of FOSS and Linux will be pleased to know that there is a plethora of AI projects available for Linux. Most of these projects are machine learning libraries that can also be cross-platform for Windows, OSX or BSD variants.
Mycroft AI
Mycroft is the first project that aims to be an open source competitor to assistants like Siri or Cortana. Dubbed as the “AI For Everyone”, it is designed to run on any platform including automobiles or a Raspberry Pi. The framework is designed to learn from voice commands and will share the information with the project to help develop a better AI. The source code can be ran on any device that has a Python interpreter.
OpenNN
The Open Neural Networks Library (OpenNN) is an open source C++ library used specifically for deep machine learning. It’s architecture uses several layers of processing units for analytical learning. It supports acceleration by OpenMP and NVIDIA’s Cuda.
OpenCyc
OpenCyc is one of the older AI projects and has been in production since 2001. It is a general knowledge AI that is particularly useful for trivia games, understanding text, and learning knowledge within specific domains.
NuPIC
NuPIC is an AI learning framework that is implementable into Python, C++, Java, Clojure, Go, or JavaScript. It gathers analytics from from live data streams to recognized time-based patterns. It is ideal for detecting anomalies within live data. Their HTM design is inspired by neuroscience.
Apache SystemML
Apache’s SystemML is an artificial intelligence framework that is available for R and Python. It is designed for big-data systems using high-level mathematical equations. It is currently being used by large industries like automotive or airport traffic control.
Deeplearning4j
Deeplearning4j (Deep Learning for Java) is one of the leading open source AI libraries for Java and Scala. It is suitable for business applications and may be accelerated by CPUs or GPUs.
Caffe
Caffe boasts as being one of the fastest of the deep learning framework. It is ideal for research projects needing quick processing of data and hardware acceleration. Its modular design allows it to easily be forked or extended and it is already been deployed in thousands of other projects.
H20
H20 is designed for advanced decision making for large industries. It supports AI methods like gradient boosting, random forests and generalized linear.
MLlib
MLlib is designed to run on Hadoop clusters and other distributed computing platforms. It comes with a variety of advanced algorithms and it compatible with Python, Java, Scala and R.
Since AI is becoming such a hot trend this day, it is inevitable that more open sourced projects will keep spawning. As more large corporations will realize the benefits of using Linux, we should expect to see more corporate funding amongst these open source projects as well. Also consider that since Linux has such portability, it may be the most desired operating system for AI solutions in embedded IoT devices in the near future.
This week in open source and Linux news, Hortonworks CTO considers why open source is the new normal in analytics, new Linux Foundation edX MOOC called a “no-brainer” and more! Read on for the top headlines of the week
1) Hortonworks CTO unpacks how open source data architectures are“now considered mainstream in the IT environments and are widely deployed in live production in several industries.”
GOING WAY BACK, pretty much all software was effectively open source. That’s because it was the preserve of a small number of scientists and engineers who shared and adapted each other’s code (or punch cards) to suit their particular area of research. Later, when computing left the lab for the business, commercial powerhouses such as IBM, DEC and Hewlett-Packard sought to lock in their IP by making software proprietary and charging a hefty license fee for its use.
The precedent was set and up until five years ago, generally speaking, that was the way things went. Proprietary software ruled the roost and even in the enlightened environs of the INQUIRER office mention of open source was invariably accompanied by jibes about sandals and stripy tanktops, basement-dwelling geeks and hairy hippies. But now the hippies are wearing suits, open source is the default choice of business and even the arch nemesis Microsoft has declared its undying love for collaborative coding.
But how did we get to here from there? Join INQ as we take a trip along the open source timeline, stopping off at points of interest on the way, and consulting a few folks whose lives or careers were changed by open source software.
Have you ever been struggling with an nth obscure project, thinking: “I could do the job with this language but why not switch to another one which would be more enjoyable to work with”? In his awesome blog post: The eigenvector of “Why we moved from language X to language Y.” Erik Bernhardsson generated an N*N contingency table of all Google queries related to changing languages. However, when I read it, I couldn’t help wondering what the proportion of people who effectively switched is. Thus, it has become engaging to deepen this idea and see how the popularity of languages changes among GitHub users.
Dataset available
Thanks to our data retrieval pipeline, source{d} opened the dataset that contains the yearly numbers of bytes coded by each GitHub user in each programming language. In a few figures, it is:
Adaptability — the ability to quickly and easily change — has become a primary goal for modern businesses and has put pressure on technology teams to build platforms that are easier and less costly to change. Working in such environments, these teams have been attracted more and more to the microservices style of software architecture. What attracts them is the promise of a method for expediting changes to software, without introducing unnecessary danger to the business.
The microservices way of doing things is made possible in large part by favoring decentralization of software components and data — more specifically, by breaking up “monolithic” elements into smaller, easier to change pieces, and deploying those pieces on the network. Making this architecture work well requires a change to the way work is done and how work is governed. The organization that adopts microservices is one that “gets out of the developer’s way,” and provides the freedom and autonomy to make the magic happen.
One of the great things about open source is that (most of the time), source code repositories are easily accessible. They can be great sources of diagnostic data, enabling you to understand who is contributing and committing code to your critical upstream projects. However, acquiring this data can be a labor-intensive process when monitoring a bunch of repos at once. This is particularly true if you want to monitor how contributions to a project change over time.
My background is in math, and I love digging into numbers to understand how and why things are happening in a certain way. Over the past few years I realized that generating summary statistics is the most time-consuming part of analyzing contributor stats. There are tools out there which can generate excellent summaries for single repos (and particularly for the kernel; gitdm is fantastic at this).
However, I regularly found myself doing substantial post-processing to generate consolidated views of the data. Unfortunately, this meant hours in Excel monkeying around with pivot tables. And, if you discover you got something wrong or need to map a domain name to a corporate affiliation, it’s back to square one… and when you want to see how things have changed, it happens all over again.
This is not a good way to keep yourself sane. So, in the spirit of “scratch your own itch,” I wrote a tool to analyze groups of git repos, aggregate the stats, and produce summary reports.
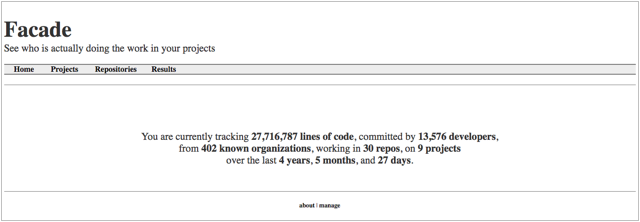
The FOSS Anomaly Detector, aka “Facade”
I call the project Facade (Figure 1). The meaning is twofold: First, this was originally conceived as a “FOSS Anomaly Detector” (F.O.S.S.A.D.), which would allow you to see how contribution patterns changed over time. Second, it allows you to see behind your speculations about the project, and get an informed view of who is doing the development work, based upon real data.
Figure 1: Facade.
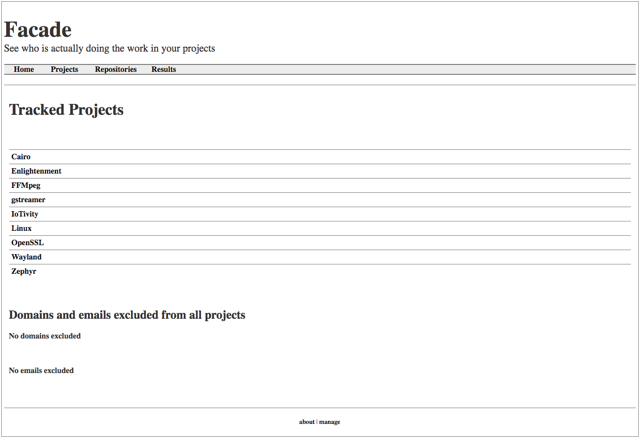
Facade is built around the idea of “projects,” which are groups of repositories (Figure 2). Statistics are aggregated by project and for individual repos. Most interactions with it are web-based, and it can run more or less unattended and continuously. Creating reports requires little more than copying and pasting, but if you really want to dive in, it can produce a CSV of raw contributor data. If you’re handy with Python and MySQL, you can also create customized summary reports as Excel files each time the dataset is updated.
Figure 2: Facade projects.
Facade gets its data by mining the git log. First, it calculates the list of parent commits for HEAD, and figures out which it hasn’t yet parsed. For each commit, it stores the author info, the committer info, the files that were changed, and stats about the patch itself. Then once the analysis is complete, it summarizes these stats by repo or project:
Lines of code added (minus whitespace changes)
Lines of code removed
Number of whitespace changes (changes to indentation, blank lines, etc)
Number of patches
Number of unique contributors
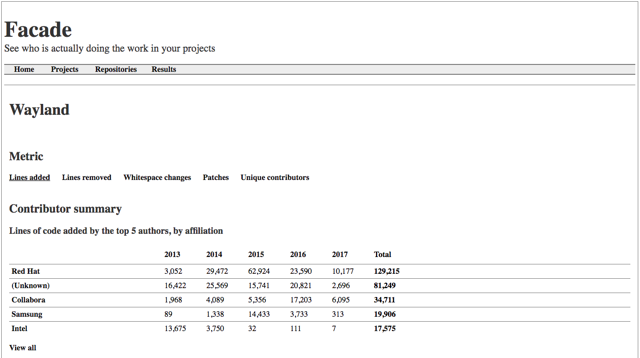
Facade attempts to associate email addresses with companies (Figure 3). These mappings can be added in the web interface, so you can gradually increase the accuracy of Facade over time.
Figure 3: Facade summary.
Facade also includes the ability to tag email addresses, for identifying teams of contributors within the data.
All of the info is stored in a database, so if you want to get really granular (for example, “who authored the most non-whitespace changes to a certain file between 2011 and 2014?”) you have the raw data you need. I designed it to store pretty much everything, so for every commit it records:
The commit hash
The author’s name
The author’s email
The author’s canonical email, if they used an alias
The author’s affiliation (if known)
The date the patch was generated
The committer’s name
The committer’s email
The committer’s canonical email, if they used an alias
The best way to get started is to clone Facade into your web root, and then follow the README. You will probably need to resolve a few dependencies.
Next you’ll run python utilities/setup.py. By and large, it should do everything for you unless you want to customize things. If you already have a MySQL database that supports utf8mb4, Facade can use that. Or you can just mash the Enter key a bunch of times, enter the root database password, and Facade will create the database, user, and tables for you. Once you set up your username and password for the website, you’re ready to go.
The first thing to do is log into the website, using the “manage” link at the bottom. This will allow you to configure projects, add repos, create tags, update aliases and affiliations, and set global configurations.
Once you’ve added a few repos, it’s back to the command line. Run utilities/Facade-worker.py, and when it’s complete project and repo stats will appear on the website.
Chances are pretty good that almost all will be categorized as (Unknown) affiliations. Don’t panic, that’s expected. Go to the People tab, fill in a few domain mappings, and re-run Facade-worker.py. The results should make a bit more sense.
Facade is intended to be run on a regular basis, so I recommend setting up a daily cron job. Just remember, if you make changes using the web interface, run the facade-worker.py script to see their effects.
So how does this compare with gitdm?
Gitdm is a fantastic tool, and it’s used for different things than Facade. In particular, it’s really well designed for gathering Linux kernel statistics, and it enables much finer-grained control over the range of commits. It also is a little easier to get up and running, as it doesn’t require a database or web server. gitdm also works on a single repository, and produces a single aggregate report.
On the other hand, Facade is meant to be run continuously, and data is stored so it doesn’t have to be recalculated each time. The statistics are grouped by date, which allows different views of the data. Facade will also yield slightly different results because it attempts to break out whitespace contributions separately.
So while both tools do gather summary stats, there are different (and very good) reasons to use one or the other.
“Dammit Jim, I’m a manager, not an engineer!”
I’ll just close with a preemptive apology — I write code for fun, not for a living, and am the first to admit I have lots more to learn. There may be rough edges, corner cases, and things which can be improved. So if you look at Facade and something about it makes you cringe, I would love to see your patches. Or if you’d like to make it do something new and cool, I would also love to see your patches. I am maintaining a list of things I’d like to add, and welcome both ideas and contributors.
Integrating Honeycomb into your Kubernetes cluster with ksonnet.
Although JSON/YAML Kubernetes manifests are straightforward to read and write, they are not always the best way to manage applications on your cluster. If you have a complex, production system and want to modify its deployment with existing approaches, you may experience significant operational costs.
In that case, what do you do if you want to add a feature like observability to your Kubernetes cluster? Even if you have a solution that (1) provides insight into the intrinsically dynamic workloads of a cloud native platform, it also needs to be (2) easy to embed and (3) easily extensible.
Recently we teamed up with the folks at Honeycomb, who had prior domain experience from Facebook, to address these points. Fortunately for us, they have an existing observability agent that handles all of (1). What we bring to the table is ksonnet, an open-source Jsonnet library and a powerful, composable approach to writing Kubernetes manifests. Our resulting collaboration, a Honeycomb library of ksonnet mixins, accomplishes all the aforementioned goals.